. 2020 Mar;74(2-3):125-137.
doi: 10.1007/s10858-019-00295-9. Epub 2020 Jan 30.

Amino-acid selective isotope labeling enables simultaneous overlapping signal decomposition and information extraction from NMR spectra

Affiliations

Amino-acid selective isotope labeling enables simultaneous overlapping signal decomposition and information extraction from NMR spectra

Takuma Kasai et al. J Biomol NMR. 2020 Mar.

Abstract

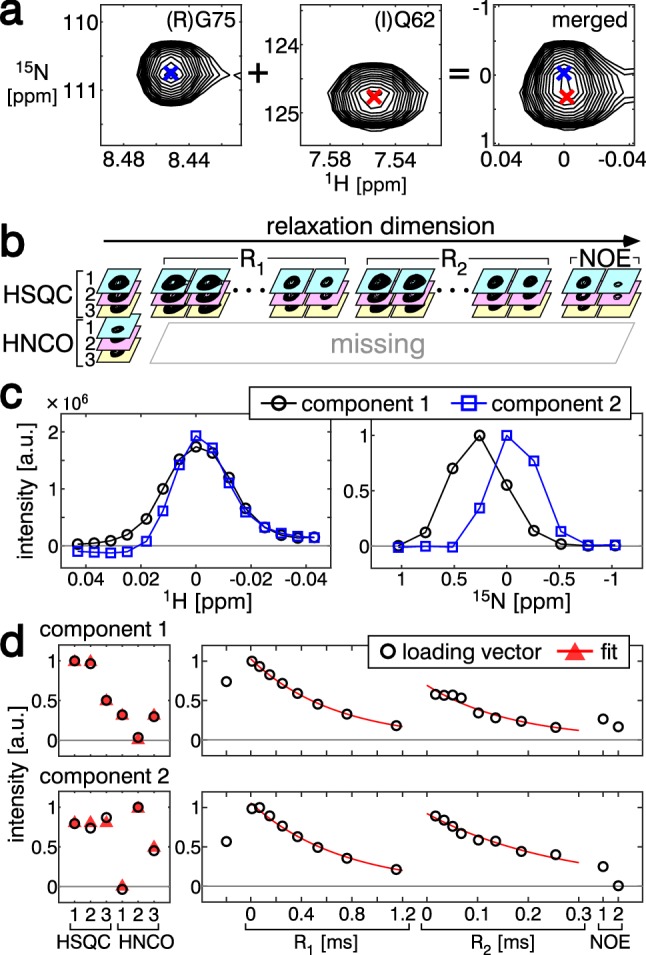
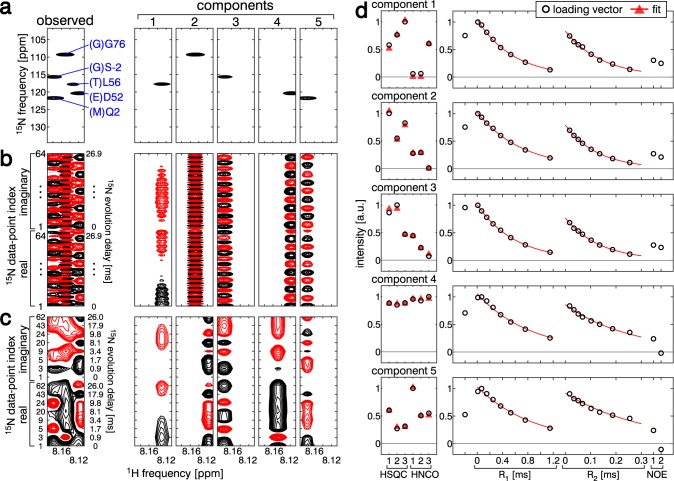
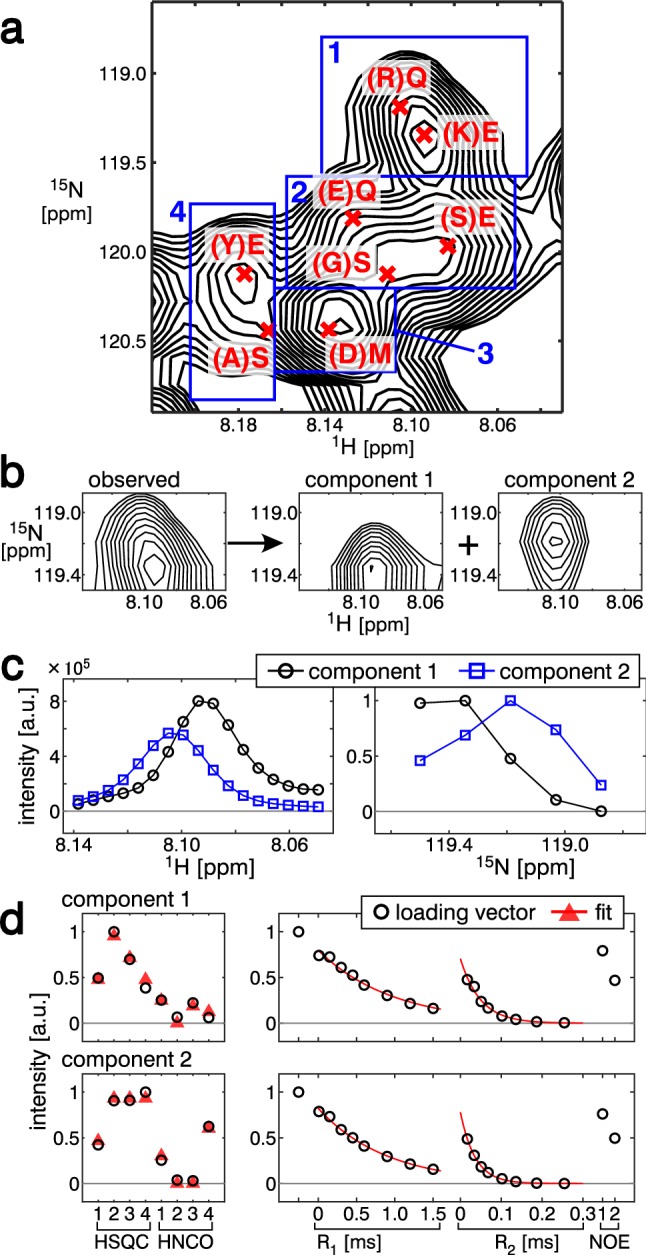
Signal overlapping is a major bottleneck for protein NMR analysis. We propose a new method, stable-isotope-assisted parameter extraction (SiPex), to resolve overlapping signals by a combination of amino-acid selective isotope labeling (AASIL) and tensor decomposition. The basic idea of Sipex is that overlapping signals can be decomposed with the help of intensity patterns derived from quantitative fractional AASIL, which also provides amino-acid information. In SiPex, spectra for protein characterization, such as 15N relaxation measurements, are assembled with those for amino-acid information to form a four-order tensor, where the intensity patterns from AASIL contribute to high decomposition performance even if the signals share similar chemical shift values or characterization profiles, such as relaxation curves. The loading vectors of each decomposed component, corresponding to an amide group, represent both the amino-acid and relaxation information. This information link provides an alternative protein analysis method that does not require "assignments" in a general sense; i.e., chemical shift determinations, since the amino-acid information for some of the residues allows unambiguous assignment according to the dual selective labeling. SiPex can also decompose signals in time-domain raw data without Fourier transform, even in non-uniformly sampled data without spectral reconstruction. These features of SiPex should expand biological NMR applications by overcoming their overlapping and assignment problems.

Keywords: Combinatorial selective labeling; Non-uniform sampling (NUS); Relaxation analysis; Spectral deconvolution; Stable isotope encoding (SiCode); Tensor factorization.


Conflict of interest statement

Takuma Kasai and Takanori Kigawa are inventors on a Japanese Patent (Number 6191927) related to this work. Shunsuke Ono, Seizo Koshiba, Masayuki Yamamoto, Toshiyuki Tanaka, and Shiro Ikeda declare that they have no conflict of interest.

Figures

Fig. 1
Fig. 1
Encoding and decoding amino acid information for amide signals. a The labeling pattern (“codebook”) used in this study. Each amino acid is represented as a combination (a “codeword”) of the isotope labeling ratios of three labeled samples. The labeling ratios of 13C and 15N are indicated as percentages. b A set of 2D spectra to form a three-order tensor. A small region-of-interest (ROI) that contains the (E)V17 signal was extracted. c Loading vectors of the signal. From left to right, the loading vectors along the 1H, 15N, and SiCode dimensions are shown as black lines and circles. The best fits to the extracted amino-acid information (Eqs. 7and8) are shown as red triangles
Fig. 2
Fig. 2
Decomposition of simulated overlapping signals. a Preparation of the artificial dataset with overlapping signals. ROIs with the same size, including the (R)G75 (indicated by blue crosses) and (I)Q62 (indicated by red crosses) signals, were extracted and merged by element-wise tensor addition. Only the 15N HSQC spectrum of sample 1 is shown. b Illustration of four-order tensor formation with a set of 2D spectra. c Loading vectors along the 1H (left) and 15N (right) dimensions. The first (f = 1) component is shown as black lines and circles, and the second (f = 2) component is shown as blue lines and squares. d Loading vectors along the SiCode (left) and relaxation (right) dimensions. The first (top panels) and second (bottom panels) components are shown. Red triangles and lines indicate the best fits for the extraction of amino acid information and the exponential decays
Fig. 3
Fig. 3
Analysis of non-uniformly sampled time domain data. a Decomposition of the ROI in which the 15N dimension is the Fourier transformed frequency domain. Black and red lines show positive and negative contours, respectively. The leftmost panel is the observed data and the right five panels are the decomposed components. Only the 15N HSQC spectrum of sample 1 is shown. b Decomposition of the same ROI as in (a), but the 15N dimension is the time-domain raw data. Both the real and imaginary parts of the complex data are shown. c A simulation of NUS in the 15N dimension, by extracting 8 out of the 64 complex points used in (b). d Loading vectors along the SiCode (left) and relaxation (right) dimensions. From top to bottom, five decomposed components are shown. The markers and line styles are the same as in Fig. 2d
Fig. 4
Fig. 4
Analysis of a crowded spectral region of an intrinsically disordered protein. a15N HSQC spectrum of sample 1 of the analyzed spectral region. Four subregions for individual tensor decomposition runs are shown in the blue box and numbered. The decomposed signals are shown by red crosses with amino-acid information by SiPex. bd Decomposition of subregion 1. b The observed spectrum (left panel) was decomposed into two components (right two panels). Only the 15N HSQC spectrum of sample 1 is shown. c Loading vectors along the 1H (left) and 15N (right) dimensions. The markers and line styles are the same as in Fig. 2c. b Loading vectors along the SiCode (left) and relaxation (right) dimensions. The markers and line styles are the same as in Fig. 2d

References

    1. Alderson TR, Markley JL. Biophysical characterization of α-synuclein and its controversial structure. Intrinsically Disord Proteins. 2013;1:18–39. doi: 10.4161/idp.26255. - DOI - PMC - PubMed
    1. Andersson CA, Bro R. The N-way toolbox for MATLAB. Chemometrics Intellig Lab Syst. 2000;52:1–4. doi: 10.1016/S0169-7439(00)00071-X. - DOI
    1. Arbogast LW, Delaglio F, Schiel JE, Marino JP. Multivariate analysis of two-dimensional 1H, 13C methyl NMR spectra of monoclonal antibody therapeutics to facilitate assessment of higher order structure. Anal Chem. 2017;89:11839–11845. doi: 10.1021/acs.analchem.7b03571. - DOI - PMC - PubMed
    1. Barna JCJ, Laue ED. Conventional and exponential sampling for 2D NMR experiments with application to a 2D NMR spectrum of a protein. J Magn Reson. 1969;75:384–389.
    1. Barna JCJ, Laue ED, Mayger MR, Skilling J, Worrall SJP. Exponential sampling, an alternative method for sampling in two-dimensional NMR experiments. J Magn Reson. 1987;73:69–77.

MeSH terms

LinkOut - more resources