. 2020 Sep;287(18):3967-3988.
doi: 10.1111/febs.15236. Epub 2020 Feb 20.

Host engulfment pathway controls inflammation in inflammatory bowel disease

Affiliations

Host engulfment pathway controls inflammation in inflammatory bowel disease

Ibrahim M Sayed et al. FEBS J. 2020 Sep.

Abstract

Chronic diseases, including inflammatory bowel disease (IBD) urgently need new biomarkers as a significant proportion of patients, do not respond to current medications. Inflammation is a common factor in these diseases, and microbial sensing in the intestinal tract is critical to initiate the inflammation. We have identified ELMO1 (engulfment and cell motility protein 1) as a microbial sensor in epithelial and phagocytic cells that turns on inflammatory signals. Using a stem cell-based 'gut-in-a-dish' coculture model, we studied the interactions between microbes, epithelium, and monocytes in the context of IBD. To mimic the in vivo cell physiology, enteroid-derived monolayers (EDMs) were generated from the organoids isolated from WT and ELMO1-/- mice and colonic biopsies of IBD patients. The EDMs were infected with the IBD-associated microbes to monitor the inflammatory responses. ELMO1-depleted EDMs displayed a significant reduction in bacterial internalization, a decrease in pro-inflammatory cytokine productions and monocyte recruitment. The expression of ELMO1 is elevated in the colonic epithelium and in the inflammatory infiltrates within the lamina propria of IBD patients where the higher expression is positively correlated with the elevated expression of pro-inflammatory cytokines, MCP-1 and TNF-α. MCP-1 is released from the epithelium and recruits monocytes to the site of inflammation. Once recruited, monocytes require ELMO1 to engulf the bacteria and propagate a robust TNF-α storm. These findings highlight that the dysregulated epithelial ELMO1 → MCP-1 axis can serve as an early biomarker in the diagnostics of IBD and other inflammatory disorders.

Keywords: enteroid; epithelial-immune cell crosstalk; inflammatory bowel disease; microbial sensing and bacterial engulfment; monocyte chemoattractant protein 1.


Conflict of interest statement

Conflict of interest - Each author revealed that they do not have any competing financial and non-financial interests or connections, direct or indirect, or other situations that might raise the question of bias in the work reported or the conclusions, implications, or opinions stated here– including pertinent commercial or other sources of funding.

Figures

Fig. 1:
Fig. 1:. ELMO1 is expressed in the gut epithelium, and its elevated expression in the gut correlates with inflammation.
(A) Gene Expression Omnibus (GEO) repository was queried for the patterns of expression of ELMO1 in publicly available cDNA microarrays [GSE83687] [28]; using the surgical specimens from 134 patients undergoing bowel resection for IBD and non-IBD controls. The ELMO1 level was determined in this cohort with 60 healthy, 42 CD (Crohn’s Disease), and 32 UC (Ulcerative colitis) subjects. Data represented as mean ± SEM and p value was assayed by two-tailed Student's t-test. (B) Expression of ELMO1, MCP-1, and TNF-α were determined by qRT-PCR of the RNA isolated from colonic biopsies obtained from healthy controls (6 samples) and patients with CD or UC (n=8 samples/group). Data represented as mean ± SEM. * indicates p≤0.05 as assayed by two-tailed Student's t-test. (C) The association between the levels of ELMO1 and MCP-1 (CCL2) mRNA expression was tested in a cohort of 214 normal colon samples available in NCBI-GEO data-series (see Methods). Left: Graph displaying individual arrays according to the expression levels of CCL2 and ELMO1 in 214 normal colon tissues. Probe ID used for each gene is shown. Blue and red indicate samples stratified into high (n = 127) vs low (n = 87) ELMO1 groups using StepMiner algorithm. Middle: Box plot comparing the levels of ELMO1 between high vs low ELMO1 groups. Right: Box plot comparing the levels of MCP-1 between high vs low ELMO1 groups. Data represented as mean ± SEM and p value was assayed by two-tailed Student's t-test.
Fig. 2:
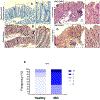
Fig. 2:. ELMO1 is detected by immunohistochemistry (IHC) on biopsies
obtained from healthy controls (normal colon; left, n=5) or patients with UC or CD (right, n=8). A part of the section was stained with secondary antibody (A) that was shown as negative control and indicated the specific staining of ELMO1. A representative figure was selected from all the sections stained with ELMO1 where the patients’ specimens were selected from each group of samples with healthy (B, n=5), CD (C, n=8) and UC (D, n=8) subjects. Images (A-D) displayed are representative of three independent experiments (E) The level of ELMO was determined between healthy and IBD patients’ by IHC on the sections of colonic biopsies. Staining intensity was scored and compared between two groups of patients where the bar graph displays the proportion of patients in each group with varying intensities of staining; lowest as ‘0’ and highest as ‘> 3+’ staining (detailed in the method section). *** indicates p≤0.001 as assayed by two-tailed Student's t-test.
Fig. 3:
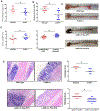
Fig. 3:. ELMO1 promotes DSS-induced colitis in vivo.
WT mice and ELMO1−/− mice (global and myeloid-cell specific) were treated with DSS and the degree of colitis was assessed. (A) The substantial weight loss was monitored and depicted on day 8 in WT mice compared to the ELMO1−/− mice. * indicates p≤0.05 as assayed by two-tailed Student's t-test. (B) The disease activity index (DAI) was measured in which weight loss, presence of stool consistency and the presence of blood at anus were scored. * indicates p≤0.05 as assayed by two-tailed Student's t-test. (C) Colon length was measured in DSS-treated WT mice and ELMO1−/− mice (global) as well as with LysM cre negative WT and LysM cre positive KO mice. * indicates p≤0.05 as assayed by two-tailed Student's t-test. (D) A representative figure of the colon was shown from DSS-treated global and myeloid-cell specific ELMO1 KO mice. (E) The H&E staining and the pathology score was measured to see the degree of crypts loss, the infiltration of leukocytes in both mucosa and submucosa, and the thickening of the bowel wall from DSS-treated global and myeloid-cell specific ELMO1 KO mice. * indicates p≤0.05 as assayed by two-tailed Student's t-test.
Fig. 4:
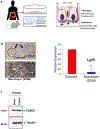
Fig. 4:. Development of 3D interstinal organoid and enteroid-derived monolayers “gut-in-a-dish” model system
(A) left: Enteroids isolated from colonic biopsies that were obtained from either healthy controls or patients with CD or from the WT or ELMO1−/− mice. Enteroid -derived monolayers (EDM) were prepared from the enteroids via terminal differentiation (see Methods). Right: Schematic of experimental strategy to show the plans with the monolayer or the supernatant from the polarized EDMs. EDMs were used for RNA to test the gene expression, immunofluorescence (IF) and coculture with monocyte for recruitment assay. The supernatant was used for ELISA and monocyte recruitment assay. (B) left: A representative light microscopy image of spheroids (arrows) and EDMs were displayed. Right: The expression of Lgr5 was detected in between enteroid and EDMs to confirm the transition of stem cells to the differentiated EDMs. Data represent the mean ± SD of three separate experiments. * indicates p≤0.05 as assayed by two-tailed Student's t-test. (C) The expression level of ELMO1 (75 kD) was detected by immunoblotting of enteroids derived from the terminal ileum and sigmoid colon of a representative healthy subject; where α-Tubulin was used as a loading control. We used a total of 5 healthy subjects in 5 repeated blots and out of that 5, a representative blot was selected.
Fig 5:
Fig 5:. Integorate the role of ELMO1 in the gut epithelium
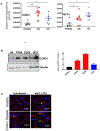
(A) The expression of ELMO1 and MCP-1 were measured in the EDMs generated from enteroid lines isolated from colonic biopsies from healthy (selected from 6 subjects), CD (9 subjects) and UC (7 subjects). The graphs display the relative expression of ELMO1 or MCP-1 in healthy, CD and UC-derived enteroids from three independent experiments and displayed as mean ± SD. * indicates p≤0.05 . ** indicates p≤0.01 as assayed by two-tailed Student's t-test. (B) The expression level of ELMO1 was compared between healthy, CD and UC –derived enteroids. The equal loading of the lysates from colonic organoids were confirmed with Tubulin as a loading control. The densitometry plot was generated to compare the level of ELMO1 in healthy, CD and UC-derived enteroids after normalizing the intensity of ELMO1 with the loading control. The detailed information of the UC and CD subjects were summarized in Table 2. Images displayed are representative of three independent experiments (C) EDMs derived from enteroids of colonic specimens of healthy and CD subjects were infected (right) or not (left) with AIEC-LF82 prior to fixation and stained for ZO-1 (red), a marker for TJs and nucleus (DAPI; blue). Disruptions in TJs are marked (arrowheads). In healthy EDMs, disrupted TJs are seen exclusively after infection with AIEC-LF82 (compare two upper images). In CD-derived EDMs, disrupted TJs were noted at baseline (lower left), almost to a similar extent as after infection with AIEC-LF82 (compare two lower images). The picture was a representative figure from the EDMs of 3 healthy subjects and 3 CD patients’. Images were acquired using Confocal microscope with a Plan APO 63x objective.
Fig. 6.
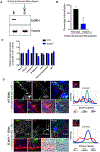
Fig. 6.. The engulfment (internalization) of AIEC-LF82 through epithelial TJs is impaired in ELMO1−/− EDMs with reduced recruitment of lysosomal proteins to the sites of internalization.
(A) Expression of ELMO1 protein was assessed by immunoblotting in enteroids isolated from colons of WT and ELMO1−/− mice. α-Tubulin was analyzed as a loading control. Images displayed are representative of three independent experiments (B) WT and ELMO1−/− EDMs were infected with AIEC-LF82 for 6 h followed by counting the bacterial entry using gentamicin protection assay (see Methods). Bar graphs display % internalization. Data represent the mean ± SD of three separate experiments. * indicates p≤0.05 as assayed by two-tailed Student's t-test. (C) The cellular composition of WT and ELMO1−/− enteroids were assessed by measuring the mRNA level of different cell markers; enterocyte markers (CA1 and Sucrase isomaltase), Paneth cell markers (Lysozymes and β defensin), tuft cells markers (DCLK-1), goblet cell marker (Muc-2) and stemness marker (lgr-5). The level of expression was normalized to the housekeeping gene (18s rRNA) and then the fold change was determined by comparing with the respective control (WT) as 1. Data represent the mean ± SD of three separate experiments. * indicates p≤0.05 as assayed by two-tailed Student's t-test. (D) WT and ELMO1−/− EDMs were infected with AIEC-LF82 as in B, fixed, stained with ZO1 (red), LAMP1 (green) and DAPI for nucleus, and analyzed by confocal imaging. Left: The maximum projection of Z-stacks of representative fields was shown. Insets in merged images represent magnified images and displayed at the bottom to zoom in at the point of bacterial entry through epithelial TJs. Lysosomes (marked by LAMP1) were aligned with the TJs (marked by ZO-1) in WT EDMs, but remain dispersed throughout the epithelial cell in ELMO1−/− EDMs. Lysosomes were seen in close proximity to the invading bacteria exclusively in the WT EDMs. Right: RGB plots show distance in pixels between the internalized bacteria (blue) and the TJs of host cells (red) and lysosomes (green). . Images were acquired using Confocal microscope with a Plan APO 63x objective.
Figure 7:
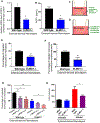
Figure 7:. The induction of MCP-1 and recruitment of monocytes in response to AIEC-LF82 is blunted in ELMO1−/− EDMs; compared to WT EDMs.
(A) Levels of expression of MCP-1 was measured by qRT-PCR in EDMs derived from colonic specimens of WT and ELMO1−/− mice after infection with AIEC-LF82 for 6 h. Bar graphs display fold change in MCP-1. Data represented as mean ± SD of three separate experiments. * indicates p≤0.05 as assayed by two-tailed Student's t-test. (B) The production of MCP-1 in the supernatants of WT and ELMO1−/− EDMs (collected from A) was measured by ELISA. In A and B. Data represent the mean ± SD of three separate experiments. * indicates p≤0.05 as assayed by two-tailed Student's t-test. (C-D) Schematics of the EDM-monocyte coculture model used to study monocyte recruitment. Either infected EDMs (WT or ELMO1−/−) (C) or conditioned supernatant (D) collected from infected EDMs were placed in the lower compartment where monocytes were placed in the upper chamber, separated by porous inserts of Transwell™ (see Methods). The number of monocytes that migrated from the upper to the lower chamber by 16 h was counted. (E-F) Bar graphs display monocyte migration towards infected EDMs (E) or conditioned media (F) plotted as a percent (%) normalized to that seen when using supernatant from WT EDMs. Data represented as mean ± SD of three separate experiments. * indicates p≤0.05 as assayed by two-tailed Student's t-test. (G) The effect of MCP1 blocking was tested in the monocyte recruitment assay using the EDMs from WT and ELMO1−/− mice (either untreated or infected with AIEC-LF82 for 6 h). The conditioned supernatant was cocultured with monocytes in the presence or absence of two different MCP-1 blocking antibody (see methods). The number of monocytes that migrated from the upper to the lower chamber by 16 h was counted. Bar graphs display the percentage of monocyte migration measured in presence of control antibody or MCP-1 blocking antibodies (5 μg/ml, 1: Thermo-scientific, 2: Novus) in WT and ELMO1−/− EDMs, where WT EDMs with control antibody was taken as 100%. Data represented as mean ± SD of three separate experiments. * indicates p≤0.05, ** indicates p≤0.01 as assayed by two-tailed Student's t-test (H) LDH assay was performed with all the EDMs either untreated or infected with AIEC-LF82 collected from experiments (A-B and E). Data represented as mean ± SD of three separate experiments. * indicates p≤0.05 as assayed by two-tailed Student's t-test.
Fig. 8:
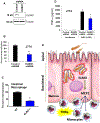
Fig. 8:. Compared to WT macrophages, ELMO1-deficient macrophages display impairment in the engulfment of AIEC-LF82 and induction of TNF-α.
(A) The downregulation of ELMO1 in ELMO1 shRNA cell was compared to control shRNA cells by performing the Western blot of cell lysates with ELMO1 antibody and the lower panel was used for loading control with α-Tubulin. The representative blot was shown from three independent experiments. (B) Internalization of AIEC-LF82 in control (Control shRNA) and ELMO1-depleted (ELMO1 shRNA) J774 cells was assessed using a gentamicin protection assay as in 3B. Bar graphs display % internalization after 1 h of infection where control shRNA has taken as 100. Data represent mean ± SD of three separate experiments, * indicates p≤0.05 as assayed by two-tailed Student's t-test. (C) The intestinal macrophages isolated from wild type (WT) and ELMO1−/− mice were infected with AIEC-LF82 for 1 h at 37°C and bacterial internalization was measured by the gentamicin protection assay (as done in B). The average number of internalized bacteria (mean ± SD) was calculated and represented as % internalization where WT has taken as 100. * indicates p≤0.05 as assayed by two-tailed Student's t-test. (D) TNF-α produced by AIEC-LF82-infected J774 cells in A were analyzed by ELISA. Data represented as mean ± SD of three separate experiments. * indicates p≤0.05 as assayed by two-tailed Student's t-test. (E) Schematic summarizing the role of ELMO1 in coordinating inflammation first in non-phagocytic (epithelial) and subsequently in phagocytic (monocytes) cells of the gut. Epithelial ELMO1 is essential for the engulfment of invasive pathogens like AIEC-LF82 and for the induction of MCP-1 in response to such invasion. MCP-1 produced by the epithelium triggers the recruitment of monocytes, facilitating their recruitment to the site of infection. Once recruited, ELMO1 in monocytes is essential for the engulfment and clearance of invasive bacteria and for the production of pro-inflammatory cytokines such as TNF-α. MCP-1 and TNF-α released from the epithelial and monocytic cells initiate a chain reaction for the recruitment and subsequent activation of other monocytes and T-cells. The resultant storm of pro-inflammatory cytokines propagates diseases characterized by chronic inflammation.

Similar articles

Cited by

References

    1. Moustafa A, Li W, Anderson EL, Wong EHM, Dulai PS, Sandborn WJ, Biggs W, Yooseph S, Jones MB, Venter JC, Nelson KE, Chang JT, Telenti A & Boland BS (2018) Genetic risk, dysbiosis, and treatment stratification using host genome and gut microbiome in inflammatory bowel disease, Clin Transl Gastroenterol. 9, e132. - PMC - PubMed
    1. Manichanh C, Borruel N, Casellas F & Guarner F (2012) The gut microbiota in IBD, Nat Rev Gastroenterol Hepatol. 9, 599–608. - PubMed
    1. Miyoshi J & Chang EB (2017) The gut microbiota and inflammatory bowel diseases, Transl Res. 179, 38–48. - PMC - PubMed
    1. Ni J, Wu GD, Albenberg L & Tomov VT (2017) Gut microbiota and IBD: causation or correlation?, Nat Rev Gastroenterol Hepatol. 14, 573–584. - PMC - PubMed
    1. Hugot JP, Chamaillard M, Zouali H, Lesage S, Cezard JP, Belaiche J, Almer S, Tysk C, O'Morain CA, Gassull M, Binder V, Finkel Y, Cortot A, Modigliani R, Laurent-Puig P, Gower-Rousseau C, Macry J, Colombel JF, Sahbatou M & Thomas G (2001) Association of NOD2 leucine-rich repeat variants with susceptibility to Crohn's disease, Nature. 411, 599–603. - PubMed

Publication types

MeSH terms