. 2020 Jan-Dec:24:2331216519900589.
doi: 10.1177/2331216519900589.

Validation of a Self-Fitting Method for Over-the-Counter Hearing Aids

Affiliations

Validation of a Self-Fitting Method for Over-the-Counter Hearing Aids

Andrew T Sabin et al. Trends Hear. 2020 Jan-Dec.

Abstract

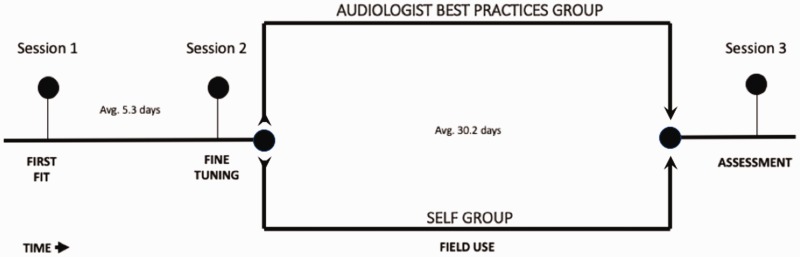
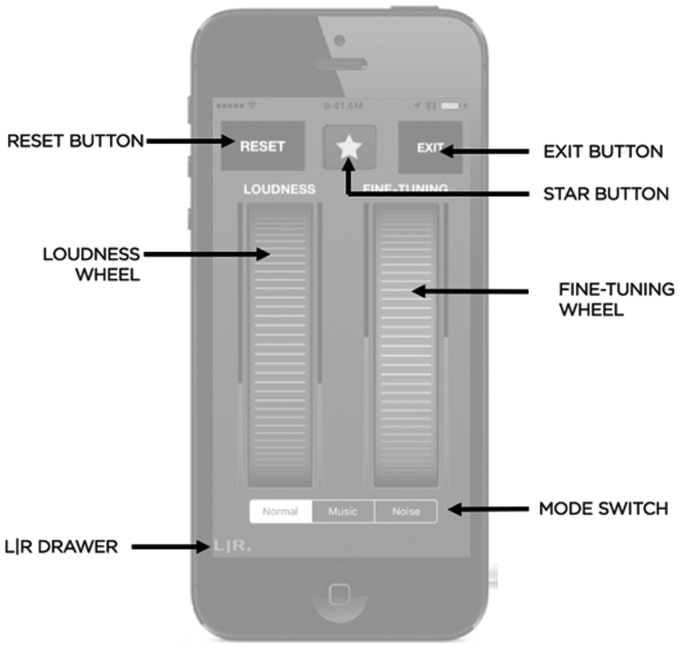
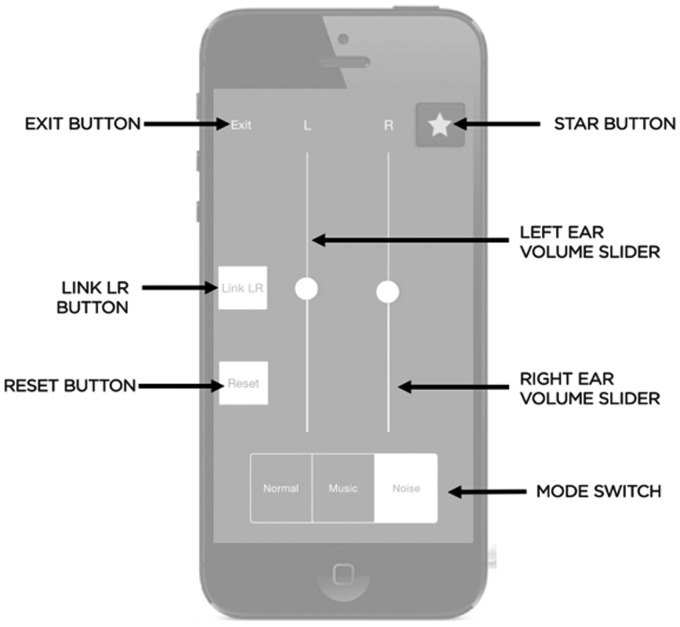
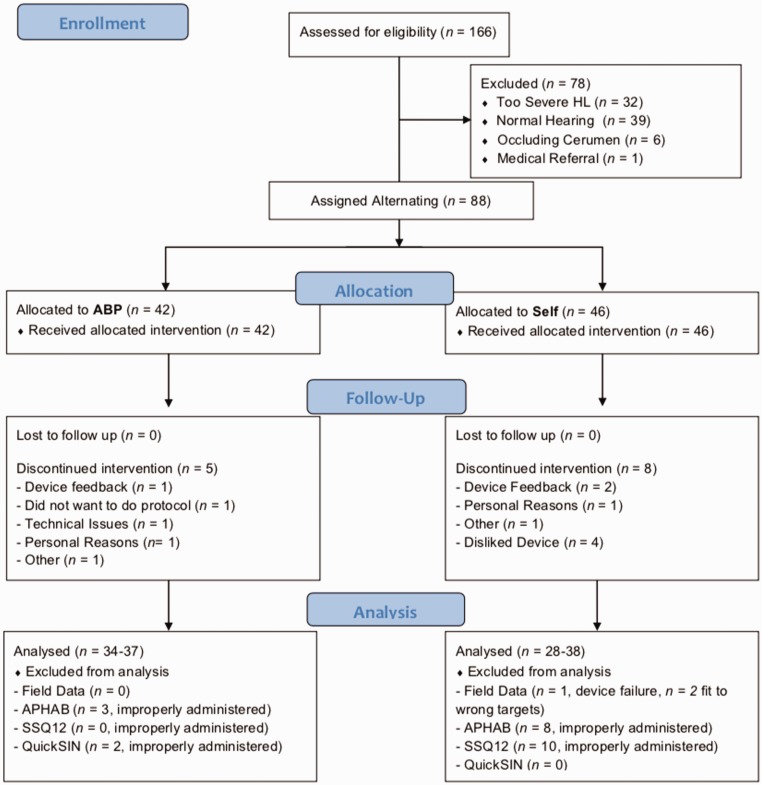
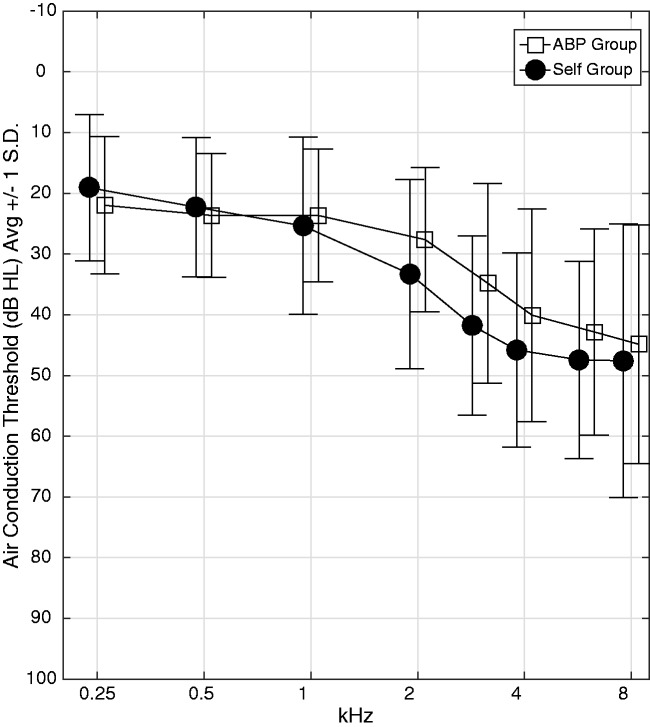
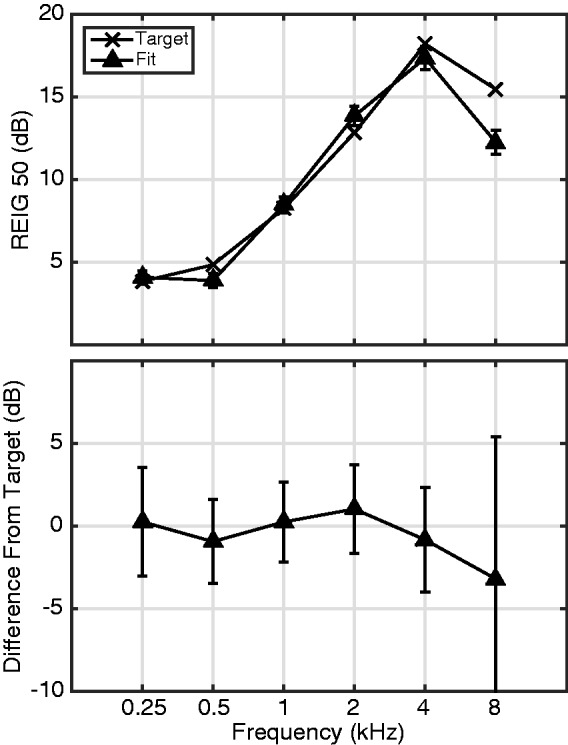
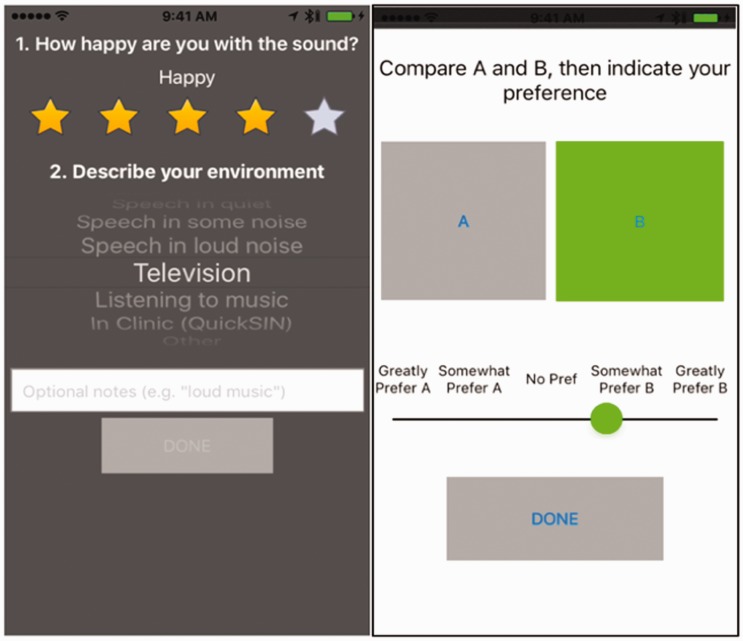
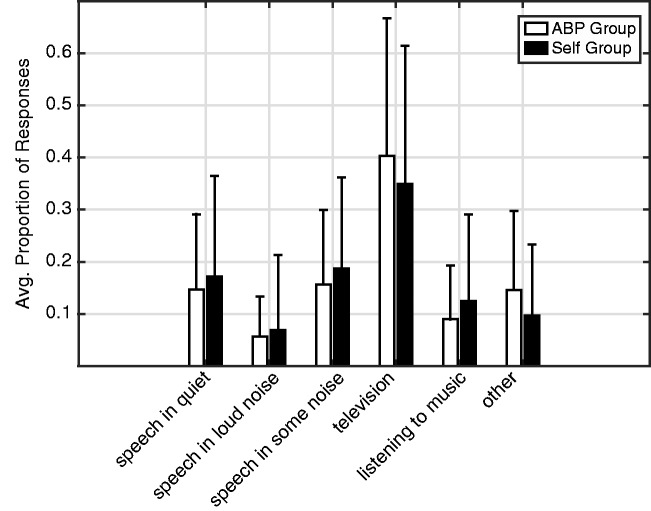
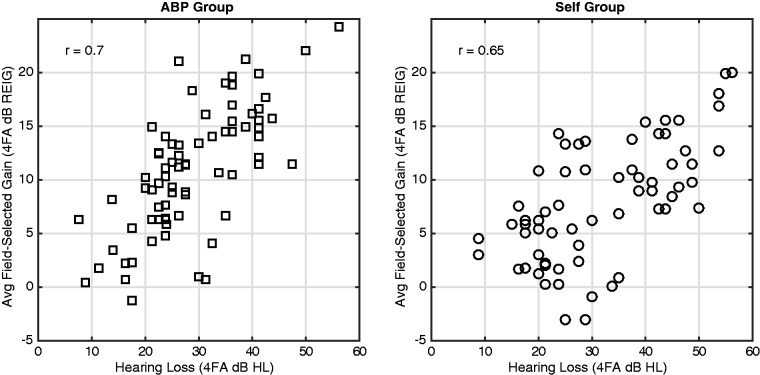
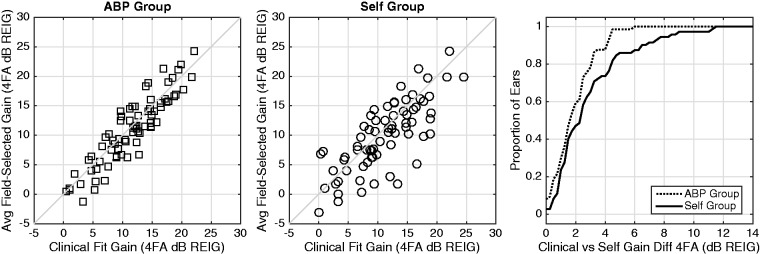
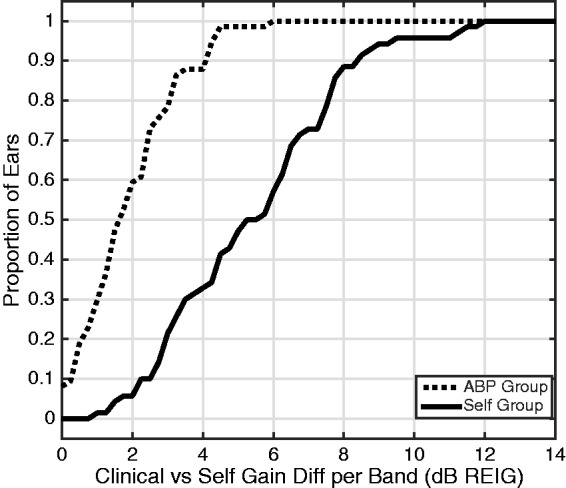
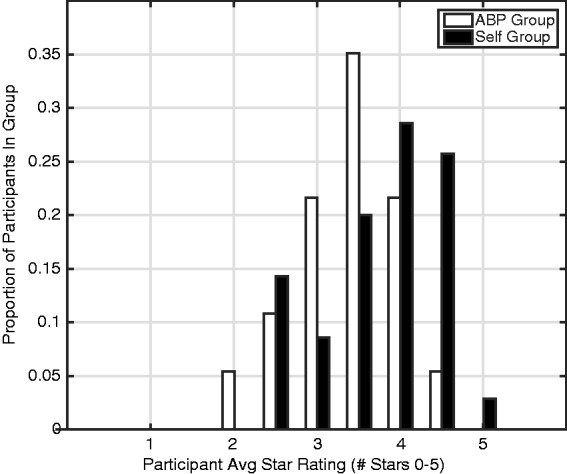
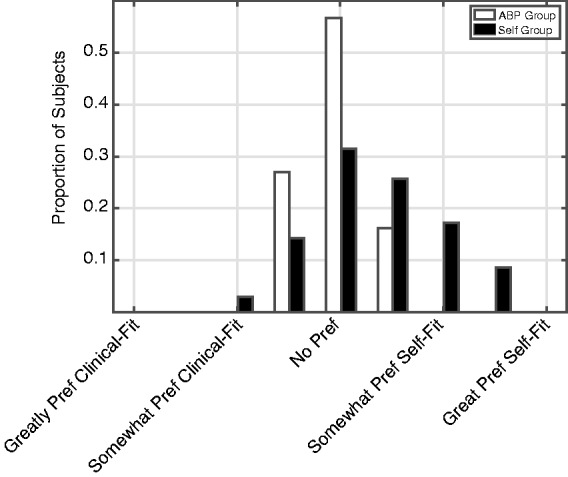
In common practice, hearing aids are fitted by a clinician who measures an audiogram and uses it to generate prescriptive gain and output targets. This report describes an alternative method where users select their own signal processing parameters using an interface consisting of two wheels that optimally map to simultaneous control of gain and compression in each frequency band. The real-world performance of this approach was evaluated via a take-home field trial. Participants with hearing loss were fitted using clinical best practices (audiogram, fit to target, real-ear verification, and subsequent fine tuning). Then, in their everyday lives over the course of a month, participants either selected their own parameters using this new interface (Self group; n = 38) or used the parameters selected by the clinician with limited control (Audiologist Best Practices Group; n = 37). On average, the gain selected by the Self group was within 1.8 dB overall and 5.6 dB per band of that selected by the audiologist. Participants in the Self group reported better sound quality than did those in the Audiologist Best Practices group. In blind sound quality comparisons conducted in the field, participants in the Self group slightly preferred the parameters they selected over those selected by the clinician. Finally, there were no differences between groups in terms of standard clinical measures of hearing aid benefit or speech perception in noise. Overall, the results indicate that it is possible for users to select effective amplification parameters by themselves using a simple interface that maps to key hearing aid signal processing parameters.

Keywords: hearing aid benefit; hearing aids; over-the-counter hearing aids; self-fitting hearing aids.


Figures

Figure 1.
Figure 1.
Experiment timeline. The between-group design enabled comparison between Audiology Best Practices (ABP) and Self-Fitting (Self) Groups.
Figure 2.
Figure 2.
Bose prototype hearing aid. All participants wore this device throughout the experiment.
Figure 3.
Figure 3.
The mobile app home screen for the Self group.
Figure 4.
Figure 4.
Example insertion gain targets for three loudness wheel positions. The REIG is plotted as a function of frequency for quiet (50 dB SPL), medium (65 dB SPL), and loud (80 dB SPL) overall speech input levels. The REIG values are plotted separately for illustrative low (left panel), mid (middle panel), and high (right panel) “Loudness” wheel positions. For each of these plots, the “Fine-Tuning” wheel is set to zero. REIG is expressed as the quantity that would be observed for a user with average head, torso, and ear acoustics. REIG = real-ear insertion gain.
Figure 5.
Figure 5.
The seed function used to compute the Fine-Tuning gains. The user adjusted a “Fine Tuning” wheel that applied a multiplier in range of ±20 to this function. The resulting gains were added to those selected by the “Loudness” wheel.
Figure 6.
Figure 6.
The mobile app home screen for the ABP group.
Figure 7.
Figure 7.
CONSORT flow diagram. ABP = Audiologist Best Practices; APHAB = Abbreviated Profile of Hearing Aid Benefit; SSQ = Speech, Spatial, and Qualities of Hearing questionnaire.
Figure 8.
Figure 8.
Average air conduction audiograms for participants in the ABP (squares) and Self (circles) groups. Error bars reflect standard deviation across all ears in the group. ABP = Audiologist Best Practices.
Figure 9.
Figure 9.
Audiologist Match-to-Target during First-Fit. (Top) NAL-NL2 Target and Measured REIG for a quiet input averaged across all listeners. (Bottom) Average and standard deviation of the difference between target and measured responses computed across all users. REIG = real-ear insertion gain.
Figure 10.
Figure 10.
Distribution of changes to gain between First-Fit and Fine-Tuning sessions. REIG = real-ear insertion gain.
Figure 11.
Figure 11.
(Left) First screen following Star Button Press asks user for sound quality judgment and report of current sound environment. (Right) Second screen following Star Button Press—participant performs a blind sound quality comparison (AB comparison) between the Audiologist- and Self-Selected sets of WDRC parameters.
Figure 12.
Figure 12.
Distribution of environments in which star button presses occurred for the ABP (white) and Self (black) groups. Bars show averages and thin lines indicate 1 SD. ABP = Audiologist Best Practices.
Figure 13.
Figure 13.
Relation between hearing loss and field-selected gains for the ABP group (left) and Self group (right). ABP = Audiologist Best Practices; REIG = real-ear insertion gain.
Figure 14.
Figure 14.
Field-selected gain (y-axis) versus clinical gain (x-axis) for the ABP (left) and Self (middle) groups. Each point is an ear. Cumulative distribution (right) of field-selected versus clinical absolute overall gain differences plotted for ABP (dotted line) and Self (solid line) groups. ABP = Audiologist Best Practices; REIG = real-ear insertion gain.
Figure 15.
Figure 15.
Cumulative distribution of field-selected versus clinical band-average absolute gain differences plotted for ABP (dotted line) and Self (solid line) groups. ABP = Audiologist Best Practices; REIG = real-ear insertion gain.
Figure 16.
Figure 16.
Distribution of star ratings for the ABP (white) and Self (black) groups. The bars of the histogram represent the proportion of listeners in each group whose average star rating falls in each of 11 bins that are equally spaced from 0 to 5 stars in steps of 0.5. ABP = Audiologist Best Practices.
Figure 17.
Figure 17.
Distribution of participant average AB scores plotted for ABP (white) and Self (black) groups. The bars of the histogram represent the proportion of listeners in each group whose average rating falls in each of nine bins that are equally spaced from −2 to 2 in steps of 0.5. ABP = Audiologist Best Practices.

Similar articles

Cited by

References

    1. Abrams H., Edwards B., Valentine S., Fitz K. (2011). A patient-adjusted fine-tuning approach for optimizing hearing aid response. Hearing Review, 18(3), 18–27.
    1. American National Standards Institute/Consumer Technology Association. (2017). Personal Sound Amplification Performance Criteria (ANSI/CTA 2051-2017). Retrieved from https://webstore.ansi.org/standards/ansi/cta20512017 ansi+&cd=&hl=en&ct=...
    1. Banerjee S. (2011). Hearing aids in the real world: Typical automatic behavior of expansion, directionality, and noise management. Journal of the American Academy of Audiology, 22, 34–48. doi:10.3766/jaaa.22.1.5 - PubMed
    1. Boothroyd A., Mackersie C. (2017). A “Goldilocks” approach to hearing-aid self-fitting: User interactions. American Journal of Audiology, 26(3S), 430–435. doi:10.1044/2017_AJA-16-0125 - PMC - PubMed
    1. Boymans M., Dreschler W. (2012). Audiologist-driven versus patient-driven fine tuning of hearing instruments. Trends in Amplification, 16(1), 49–58. doi:10.1177/1084713811424884 - PMC - PubMed

Publication types