

Increased Time in Range and Fewer Missed Bolus Injections After Introduction of a Smart Connected Insulin Pen
- PMID: 32003590
- PMCID: PMC7591375
- DOI: 10.1089/dia.2019.0411
Increased Time in Range and Fewer Missed Bolus Injections After Introduction of a Smart Connected Insulin Pen
Abstract
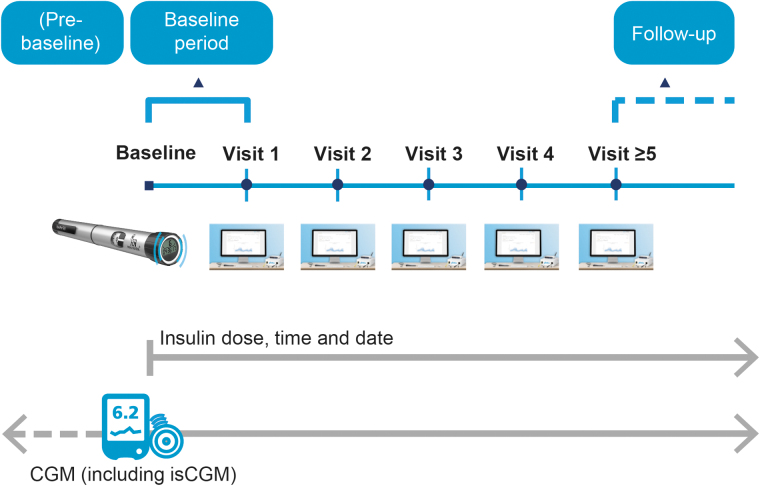
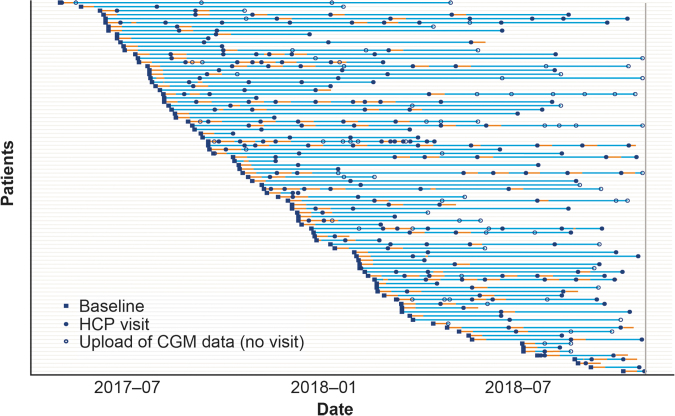
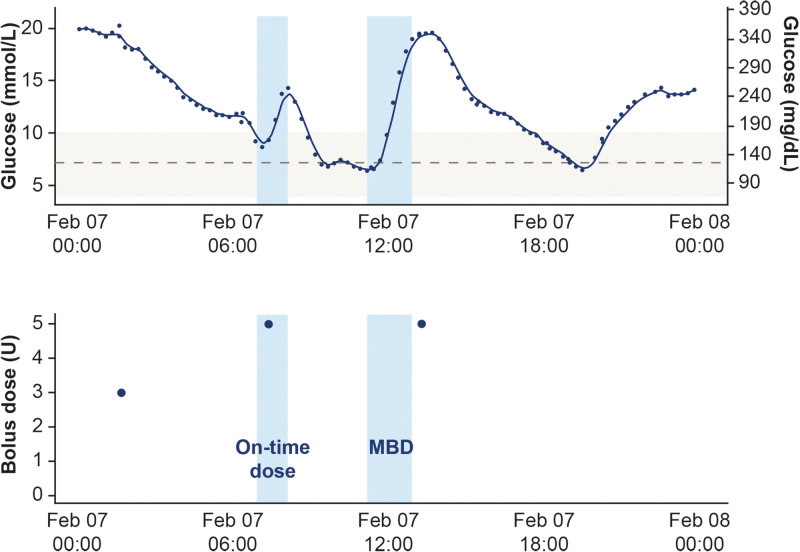
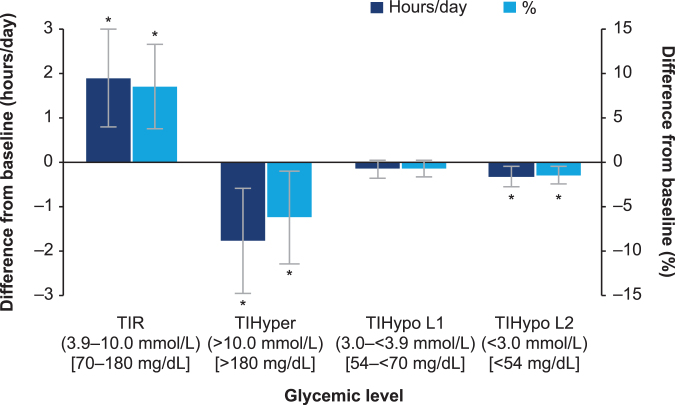
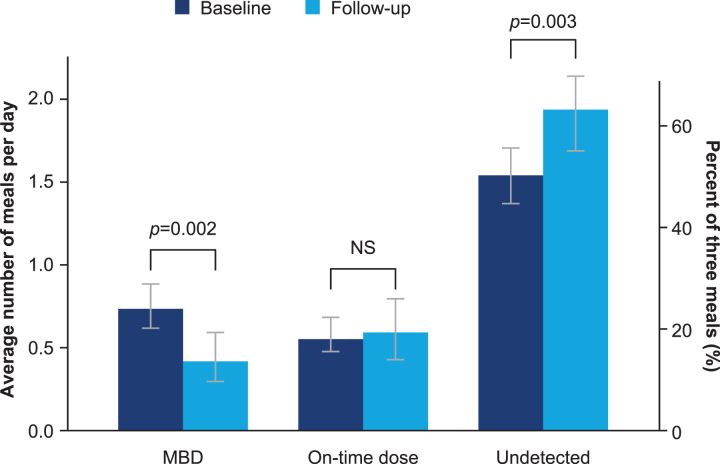
Background: This observational study investigated whether the connected NovoPen® 6 could influence insulin regimen management and glycemic control in people with type 1 diabetes (T1D) using a basal-bolus insulin regimen and continuous glucose monitoring in a real-world setting. Methods: Participants from 12 Swedish diabetes clinics downloaded pen data at each visit (final cohort: n = 94). Outcomes included time in range (TIR; sensor glucose 3.9-10.0 mmol/L), time in hyperglycemia (>10 mmol/L), and hypoglycemia (L1: 3.0- <3.9 mmol/L; L2: <3.0 mmol/L). Missed bolus dose (MBD) injections were meals without bolus injection within -15 and +60 min from the start of a meal. Outcomes were compared between the baseline and follow-up periods (≥5 health care professional visits). Data were analyzed from the first 14 days following each visit. For the TIR and total insulin dose analyses (n = 94), a linear mixed model was used, and for the MBD analysis (n = 81), a mixed Poisson model was used. Results: TIR significantly increased (+1.9 [0.8; 3.0]95% CI h/day; P < 0.001) from baseline to follow-up period, with a corresponding reduction in time in hyperglycemia (-1.8 [-3.0; -0.6]95% CI h/day; P = 0.003) and L2 hypoglycemia (-0.3 [-0.6; -0.1]95% CI h/day; P = 0.005), and no change in time in L1 hypoglycemia. MBD injections decreased by 43% over the study (P = 0.002). Change in MBD injections corresponded to a decrease from 25% to 14% based on the assumption that participants had three main meals per day. Conclusions: Our study highlights the potential benefit on glycemic control and dosing behavior when reliable insulin dose data from a connected pen contribute to insulin management in people with T1D.
Keywords: Adherence; Connected insulin pen; Glycemic control; Hypoglycemia; Time in range.
Conflict of interest statement
P.A. has received research support or advisory board fees from Eli Lilly, Novo Nordisk, Roche, funding from Research and Development, Region Halland, and is an employee of Region Halland.
N.V.H., A.K., and J.B.M. are full-time employees of, and hold stock in, Novo Nordisk A/S.
J.H. has received advisory board fees from Abbott, Bayer, Sanofi, Novo Nordisk, Eli Lilly, MSD, and Boehringer Ingelheim and received consultancy fees from Sanofi, Novo Nordisk, and Boehringer Ingelheim.
Figures
Comment in
-
Dokumentation von Insulininjektionen digitalisieren.MMW Fortschr Med. 2021 Dec;163(21-22):81. doi: 10.1007/s15006-021-0609-x. MMW Fortschr Med. 2021. PMID: 34888822 German. No abstract available.
References
-
- Davies MJ, Gagliardino JJ, Gray LJ, et al. : Real-world factors affecting adherence to insulin therapy in patients with type 1 or type 2 diabetes mellitus: a systematic review. Diabet Med 2013;30:512–524 - PubMed
-
- Cramer JA: A systematic review of adherence with medications for diabetes. Diabetes Care 2004;27:1218–1224 - PubMed
-
- Munshi MN, Slyne C, Greenberg JM, et al. : Nonadherence to insulin therapy detected by bluetooth-enabled pen cap is associated with poor glycemic control. Diabetes Care 2019;42:1129–1131 - PubMed
Publication types
MeSH terms
Substances
LinkOut - more resources
Full Text Sources
Medical
