. 2020 May 1;36(9):2731-2739.
doi: 10.1093/bioinformatics/btaa065.

LAMPA, LArge Multidomain Protein Annotator, and its application to RNA virus polyproteins

Affiliations

LAMPA, LArge Multidomain Protein Annotator, and its application to RNA virus polyproteins

Anastasia A Gulyaeva et al. Bioinformatics. .

Abstract

Motivation: To facilitate accurate estimation of statistical significance of sequence similarity in profile-profile searches, queries should ideally correspond to protein domains. For multidomain proteins, using domains as queries depends on delineation of domain borders, which may be unknown. Thus, proteins are commonly used as queries that complicate establishing homology for similarities close to cutoff levels of statistical significance.

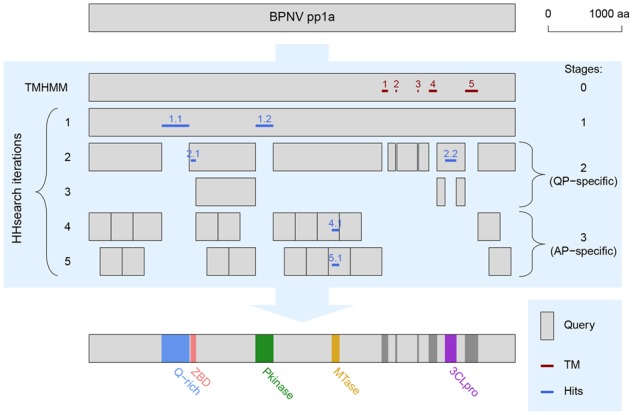
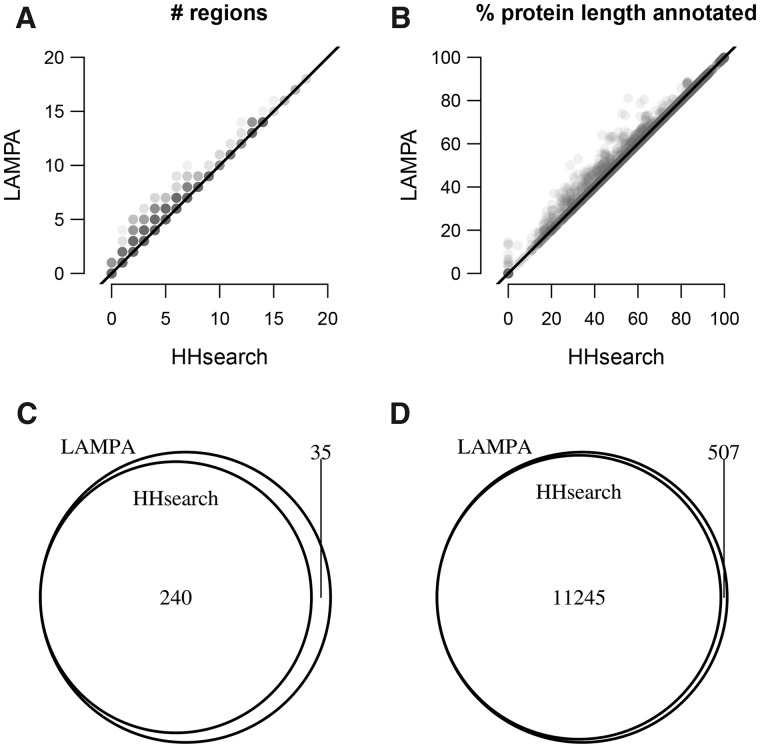
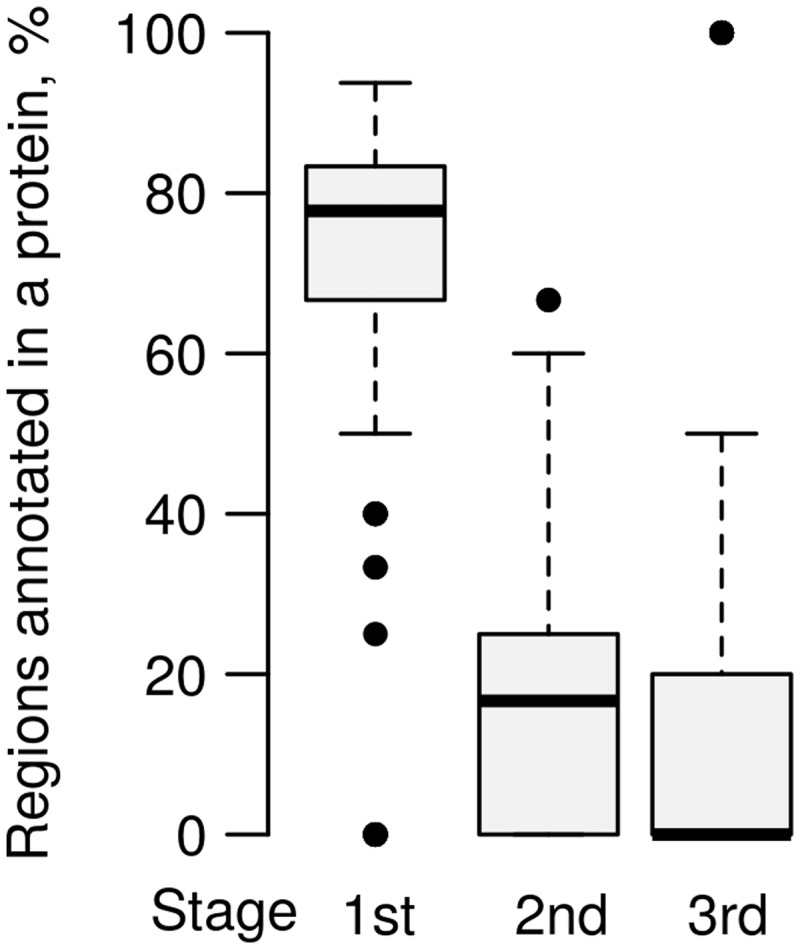
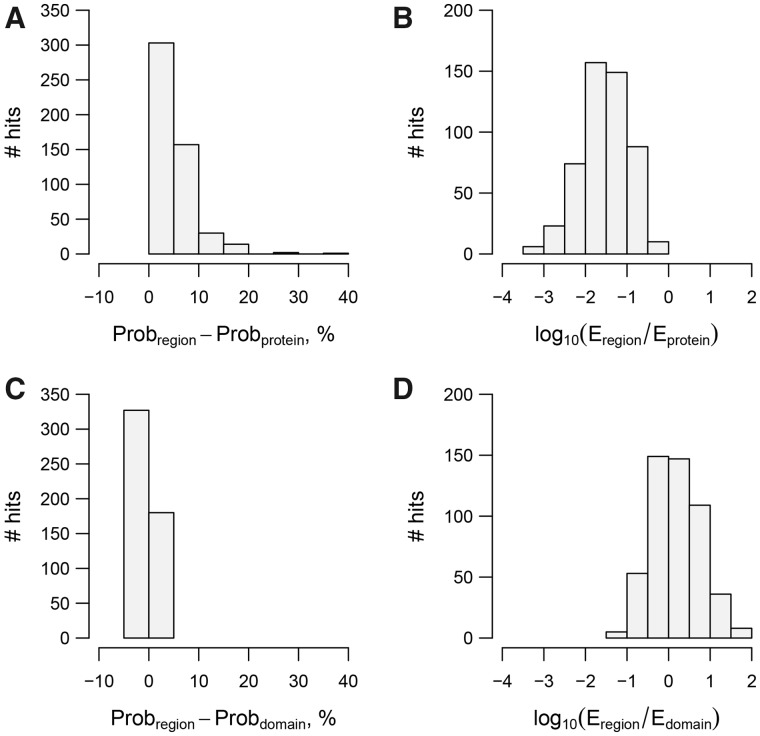
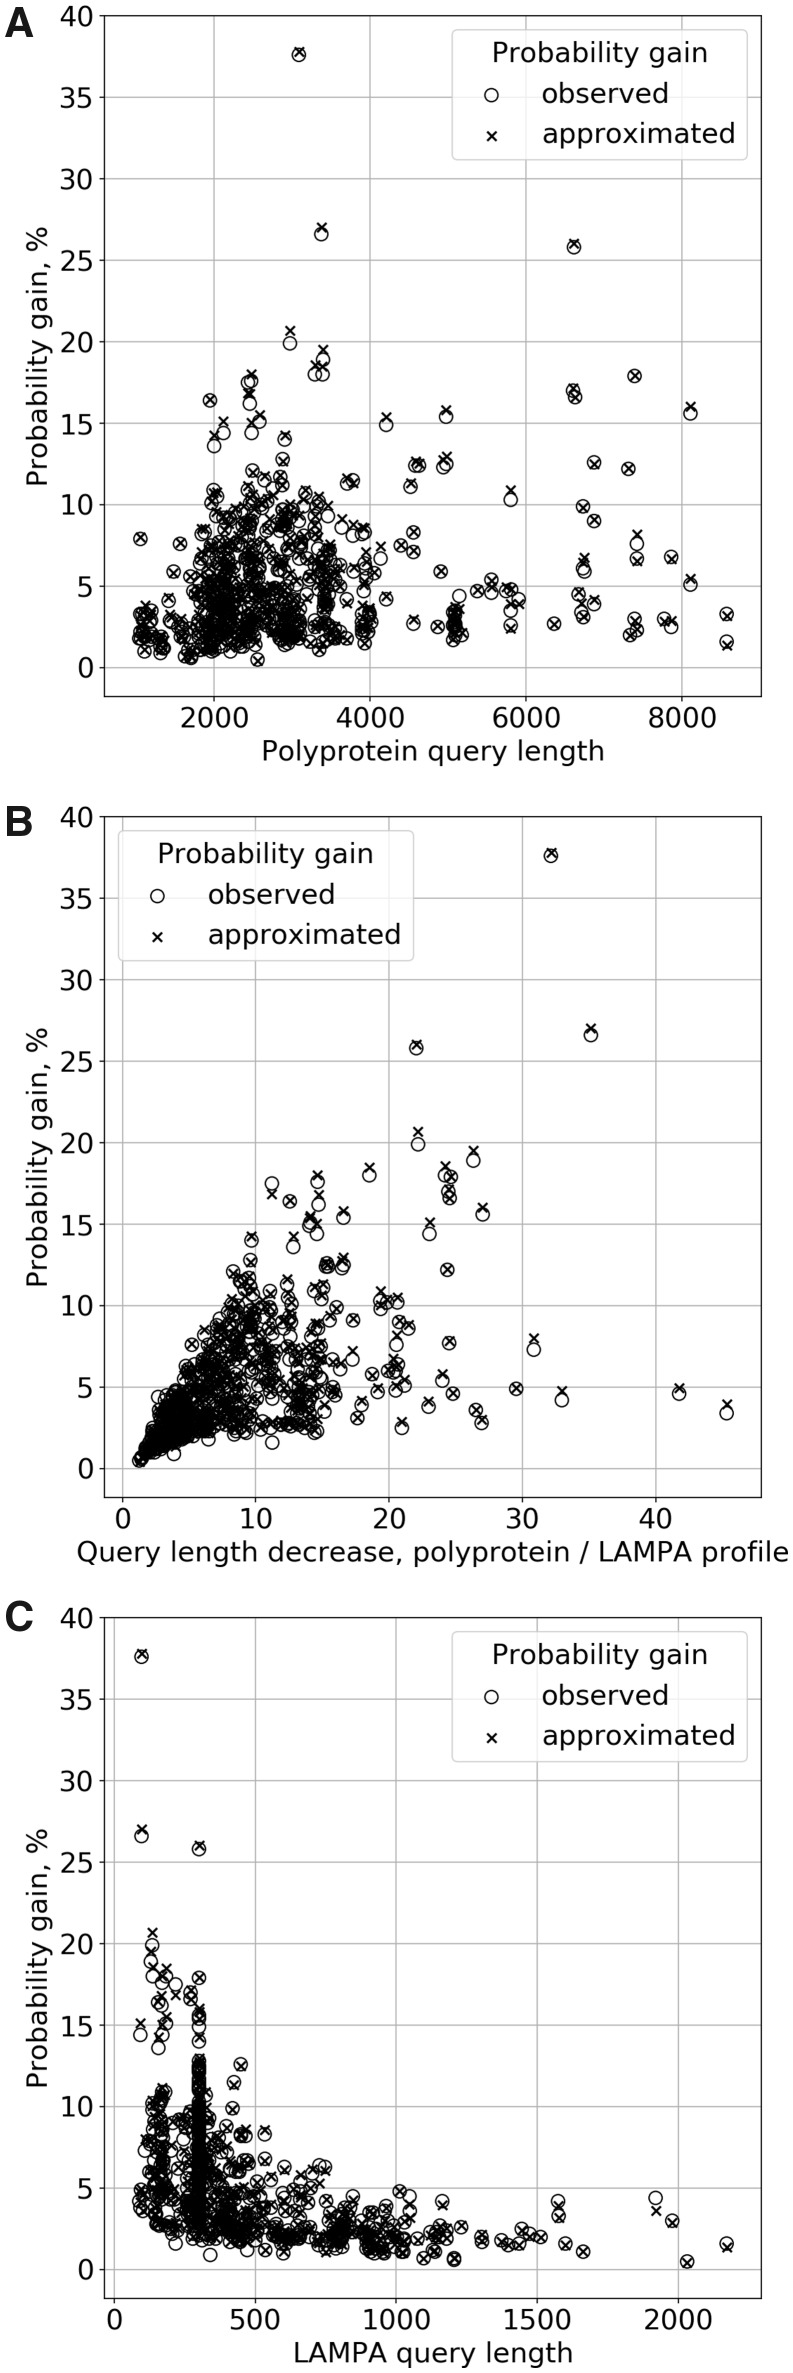
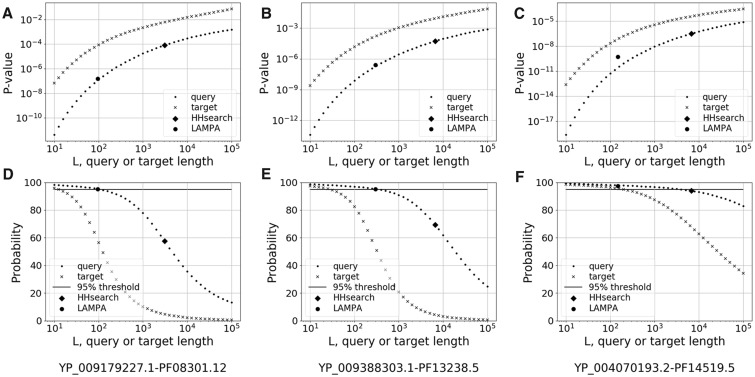
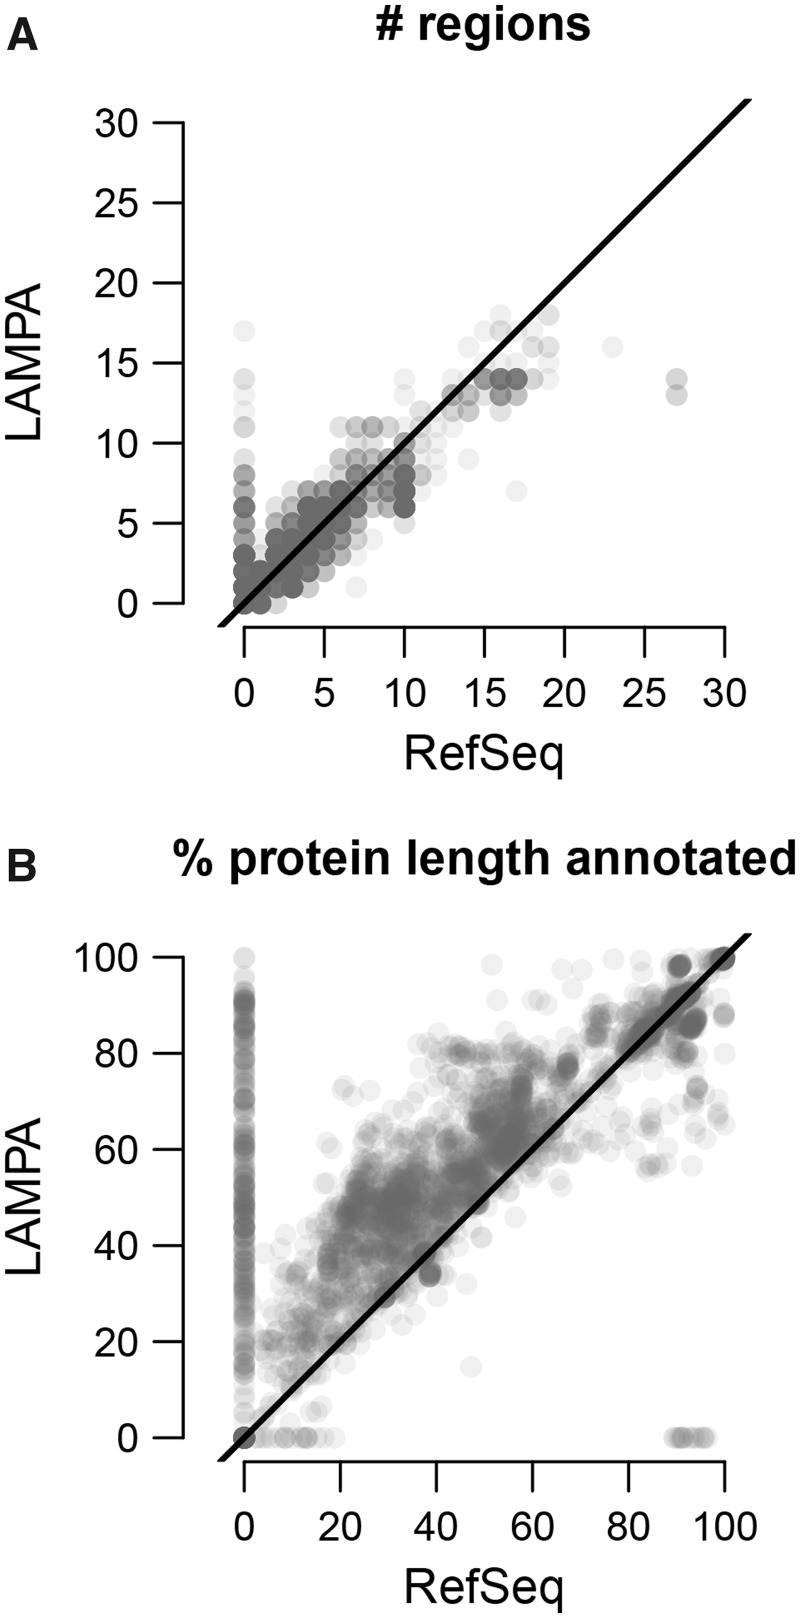
Results: In this article, we describe an iterative approach, called LAMPA, LArge Multidomain Protein Annotator, that resolves the above conundrum by gradual expansion of hit coverage of multidomain proteins through re-evaluating statistical significance of hit similarity using ever smaller queries defined at each iteration. LAMPA employs TMHMM and HHsearch for recognition of transmembrane regions and homology, respectively. We used Pfam database for annotating 2985 multidomain proteins (polyproteins) composed of >1000 amino acid residues, which dominate proteomes of RNA viruses. Under strict cutoffs, LAMPA outperformed HHsearch-mediated runs using intact polyproteins as queries by three measures: number of and coverage by identified homologous regions, and number of hit Pfam profiles. Compared to HHsearch, LAMPA identified 507 extra homologous regions in 14.4% of polyproteins. This Pfam-based annotation of RNA virus polyproteins by LAMPA was also superior to RefSeq expert annotation by two measures, region number and annotated length, for 69.3% of RNA virus polyprotein entries. We rationalized the obtained results based on dependencies of HHsearch hit statistical significance for local alignment similarity score from lengths and diversities of query-target pairs in computational experiments.

Availability and implementation: LAMPA 1.0.0 R package is placed at github (https://github.com/Gorbalenya-Lab/LAMPA).

Supplementary information: Supplementary data are available at Bioinformatics online.


Figures

Fig. 1.
Fig. 1.
Length distribution of proteins in datasets relevant to comparison of HHsearch and LAMPA. This plot depicts sizes of six protein datasets labeled from A to F and used or cited in this study. (A) 6271 SCOP domains used for HHsearch training (range: 21–1504 aa); (B) 2985 RefSeq virus polyproteins (range: 1001–8572 aa); (C) 431 RefSeq virus polyproteins which include 507 regions exclusively annotated by LAMPA (range: 1039–8572 aa); (D) 507 hit regions generated by LAMPA from 431 RefSeq polyproteins (range: 88–2172 aa); (E) 507 domains tentatively demarcated around LAMPA hits (range: 164–732 aa); and (F) 41 designed sizes of each of three proteins, 123 in total, tested in computational experiments (range: 10–100.000 aa)
Fig. 2.
Fig. 2.
LAMPA workflow and its application to RNA virus polyprotein. Presented is outline of the LAMPA approach (blue background) applied to polyprotein 1a (pp1a) of BPNV. Gray bars, regions of BPNV pp1a that served as TMHMM or HHsearch queries. Iterations of the procedure and programs used are depicted on the left; stages are indicated on the right. Clusters of TM helices are depicted in dark red, clusters of hits—in dark blue. Hit double digits refer to iteration and hit position on polyprotein from left to right, respectively, except for hits at Stage #0 which are labelled with the position only. Hits and annotations obtained on Stage #1 represent output of conventional HHsearch. Q-rich, region rich in glutamine residue; ZBD, zinc-binding domain; Pkinase, protein kinase; MTase, methyltransferase; 3CLpro, 3C-like protease. For other details see text. (Color version of this figure is available at Bioinformatics online.)
Fig. 3.
Fig. 3.
Gain of homology recognition by LAMPA compared to HHsearch. Presented are four depictions of results of querying pfamA_31.0 with 2985 RNA virus proteins using LAMPA and HHsearch. (A) Number of regions (hit clusters) per query protein annotated by the two tools. Each protein is depicted by a transparent gray dot. Since multiple proteins may have the same or similar number of regions annotated by the two tools (x and y dot coordinates), dots may overlap. Gray density is proportional to the number of overlapping dots. Black line, diagonal. (B) Share of protein length (%) annotated by the two tools. For other details, see panel A. (C) Overlap between Pfam profiles that were linked to RNA virus proteins by the two tools. (D) Overlap between RNA virus polyprotein regions annotated by the two tools
Fig. 4.
Fig. 4.
Contribution of different stages of LAMPA procedure to protein annotation. Contribution of three LAMPA stages to annotation of 431 proteins, including regions exclusively annotated by LAMPA, was measured by percentage of regions annotated in each protein. Total number of regions annotated in each protein was considered 100%, regardless of their actual number and share in the protein. The box plots, lower and upper limits of the box delimit the first (25%) and third (75%) quartiles, midline limit of the box—median, whiskers extend to the most extreme data point which is no >1.5 times the interquartile range from the box, data beyond that distance are represented by points
Fig. 5.
Fig. 5.
Gain of hit statistical significance by LAMPA compared to HHsearch. LAMPA hits to region queries, obtained during the QP-specific and AP-specific stages of LAMPA procedure, are compared with matching HHsearch hits to polyprotein queries, in respect to hit Probability (A) and E-value (B); and with matching HHsearch hits to putative domain queries (operational definition, see text for details), in respect to hit Probability (C) and E-value (D). Analyzed HHsearch hits were not subject to post-processing
Fig. 6.
Fig. 6.
Relationship between Probability gain by LAMPA and query lengths. Difference between Probabilities of hit to region query (LAMPA Stages #2 or #3) versus polyprotein query (HHsearch without hits post-processing) (empty circle), is compared with difference between the respective approximated Probabilities for the matching hit in computational experiments (cross) at the y axis, for 507 hits in total. These values are plotted against values of three characteristics of respective queries at the x axis: (A) polyprotein length (Stage #1), (B) ratio of polyprotein to query region length (Stage #1 versus Stage #2/3) and (C) query region length (Stage #2/3)
Fig. 7.
Fig. 7.
Relationship between hit statistical significance and profile lengths in computational experiments. HHsearch hit P-value (A–C) and Probability (D–F) were estimated for 41 designed lengths of query or target, each of which was equidistant from its immediate neighbor on base 10 logarithmic scale (see Supplementary Text S1). The 41 pairs of values were plotted to reveal relationship between two characteristics. These plots used hit score values of three query-target pairs, which are specified at the bottom of the figure and whose respective hit statistics values at the Stage #1 (HHsearch), and Stage #2 or #3 (LAMPA) are also depicted
Fig. 8.
Fig. 8.
Summary statistic of annotation coverage by LAMPA and RefSeq experts. Comparison of the number of regions per protein (A) or percentage of protein length (protein coverage) (B) annotated by LAMPA (Stages #1–3) and RefSeq experts, based on analysis 2985 RNA virus proteins. Each protein is represented by a transparent gray dot; dot density is proportional to the number of proteins with identical characteristics. Black line, diagonal

References

    1. Altschul S.F et al. (1997) Gapped BLAST and PSI-BLAST: a new generation of protein database search programs. Nucleic Acids Res., 25, 3389–3402. - PMC - PubMed
    1. Baltimore D. (1971) Expression of animal virus genomes. Bacteriol. Rev., 35, 235–241. - PMC - PubMed
    1. Brister J.R. et al. (2015) NCBI viral genomes resource. Nucleic Acids Res., 43, D571–D577. - PMC - PubMed
    1. Charif D., Lobry J.R., (2007) SeqinR 1.0-2: a contributed package to the R project for statistical computing devoted to biological sequences retrieval and analysis In: Bastolla Uet al. (eds.) Structural Approaches to Sequence Evolution: Molecules, Networks, Populations. Springer Berlin Heidelberg, Berlin, Heidelberg, pp. 207–232.
    1. Das K., Arnold E. (2015) Negative-strand RNA virus L proteins: one machine, many activities. Cell, 162, 239–241. - PubMed

Publication types