. 2020 May 1;36(10):2980-2985.
doi: 10.1093/bioinformatics/btaa073.

Coolpup.py: versatile pile-up analysis of Hi-C data

Affiliations

Coolpup.py: versatile pile-up analysis of Hi-C data

Ilya M Flyamer et al. Bioinformatics. .

Abstract

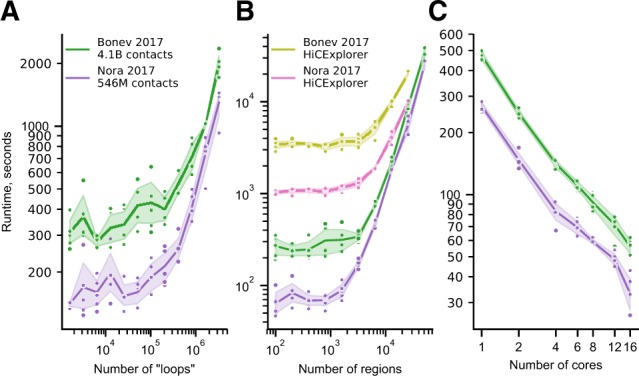
Motivation: Hi-C is currently the method of choice to investigate the global 3D organization of the genome. A major limitation of Hi-C is the sequencing depth required to robustly detect loops in the data. A popular approach used to mitigate this issue, even in single-cell Hi-C data, is genome-wide averaging (piling-up) of peaks, or other features, annotated in high-resolution datasets, to measure their prominence in less deeply sequenced data. However, current tools do not provide a computationally efficient and versatile implementation of this approach.

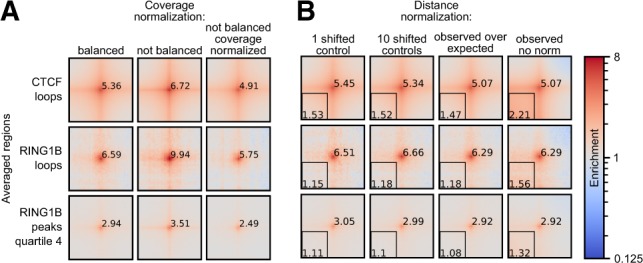
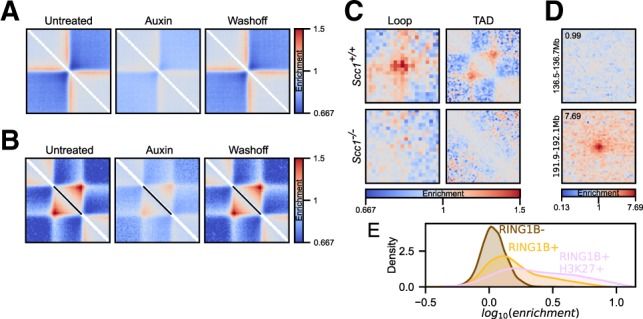
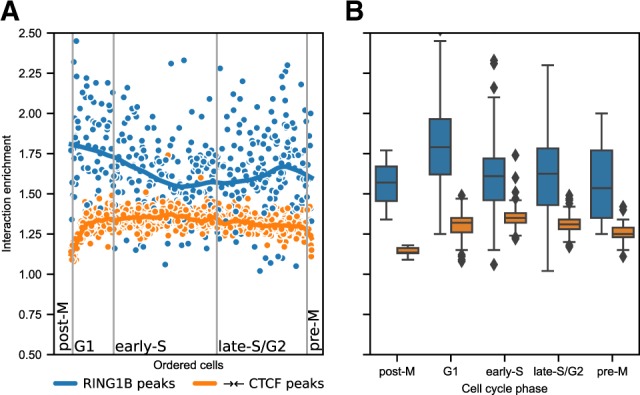
Results: Here, we describe coolpup.py-a versatile tool to perform pile-up analysis on Hi-C data. We demonstrate its utility by replicating previously published findings regarding the role of cohesin and CTCF in 3D genome organization, as well as discovering novel details of Polycomb-driven interactions. We also present a novel variation of the pile-up approach that can aid the statistical analysis of looping interactions. We anticipate that coolpup.py will aid in Hi-C data analysis by allowing easy to use, versatile and efficient generation of pile-ups.

Availability and implementation: Coolpup.py is cross-platform, open-source and free (MIT licensed) software. Source code is available from https://github.com/Phlya/coolpuppy and it can be installed from the Python Packaging Index.


Figures

Fig. 1.
Fig. 1.
Hi-C data normalization strategies. (A) Comparison of coverage normalization strategies for pile-up analyses using mouse ES cell Hi-C data (Bonev et al., 2017). Normalization approaches are in columns: matrix balancing (iterative correction); no normalization; no balancing with coverage normalization of the pile-ups. The different averaged regions are shown in rows: loops associated with CTCF (n = 6536), loops associated with RING1B (n = 104) (see Materials and Methods section), all pairwise combinations of high RING1B peak regions from the fourth quartile (by RING1B ChIP-seq read count) (n = 2660 of peak regions). All pile-ups produced with 10 randomly shifted controls. All pile-ups are normalized to the average of the top-left and bottom-right corner pixels to bring them to same scale. Value of the central pixel is displayed. Five kilobytes resolution with 100 kb padding around the central pixel. Colour is shown in log-scale and shows enrichment of interactions. (B) Same as (A), but for different approaches to remove distance-dependency of contact probability with balanced data. In columns: single randomly shifted control regions per ROI; 10 randomly shifted control per ROI; normalization to chromosome-wide expected; no normalization. Same rows as in (A). Average enrichment of the lower-left corner of the pile-up is displayed
Fig. 2.
Fig. 2.
Pile-up variations. (A) Local pile-ups of high-insulating regions in ES cells across untreated, auxin-treated and wash-off conditions in CTCF-AID Hi-C data (Nora et al., 2017). Twenty-five kbp resolution data with 1000 kbp padding around the central pixel. (B) Local rescaled pile-ups of TADs (defined based on high-insulating regions) across same data as in (A) from 5 kbp resolution data. (C) Loop and rescaled TAD pile-ups for pooled single-cell Hi-C data showing loss of structures in Scc1−/− zygotes (Gassler et al., 2017). (D) Two examples of anchored pile-ups from RING1B+/H3K27me3+ CpG islands on chr1, with no visible enrichment (top), or with very prominent enrichment (bottom). The anchored region is on the left side of the pile-up, and its coordinates (including the padding) are shown on the left. The value of the central pixel (‘loopability’) shown in top left corner. (E) Distribution of ‘loopability’ values of CpG islands not bound by RING1B, CpG islands bound by RING1B, and CpG islands bound by RING1B and also marked by H3K27me3
Fig. 3.
Fig. 3.
Chromatin looping dynamics across cell cycle. (A) Hi-C interaction enrichment levels for single cells ordered along the cell cycle (Nagano et al., 2017) for CTCF- and RING1B-associated interactions. The former is limited to 100–800 kb distance, while the latter is shown for all distances above 100 kb. Curves represent LOWESS-smoothed data for easier interpretation. (B) Distribution of enrichment values in all cell cycle stages from data in (A)
Fig. 4.
Fig. 4.
Performance profiling. (A) Runtime (seconds) of coolpup.py with varying number of averaged ‘loops’ for two Hi-C datasets with different depth. (B) Same as (A), but for number of linear regions between which interactions are averaged. Also shown is runtime for HiCExplorer hicAggregateContacts. Note that the longest time-point for HiCExplorer required over 512 Gb RAM and was not computed. (С) Runtime of the same analysis with 5000 linear regions and a varying number of cores. Same colour coding as in (A)

References

    1. Abdennur N., Mirny L.A. (2019) Cooler: scalable storage for Hi-C data and other genomically labeled arrays. Bioinformatics, 36, 311–316. - PMC - PubMed
    1. Abdennur N. et al. (2018) Condensin II inactivation in interphase does not affect chromatin folding or gene expression. bioRxiv, doi: 10.1101/437459.
    1. Alabert C. et al. (2015) Two distinct modes for propagation of histone PTMs across the cell cycle. Genes Dev., 29, 585–590. - PMC - PubMed
    1. Barutcu A.R. et al. (2016) C-ing the genome: a compendium of chromosome conformation capture methods to study higher-order chromatin organization. J. Cell. Physiol., 231, 31–35. - PMC - PubMed
    1. Bonev B. et al. (2017) Multiscale 3D genome rewiring during mouse neural development. Cell, 171, 557–572.e24. - PMC - PubMed

Publication types