. 2020 Mar 1;318(3):H671-H681.
doi: 10.1152/ajpheart.00280.2019. Epub 2020 Jan 31.

Antithrombotic effects of heme-degrading and heme-binding proteins

Affiliations

Antithrombotic effects of heme-degrading and heme-binding proteins

Karl A Nath et al. Am J Physiol Heart Circ Physiol. .

Abstract

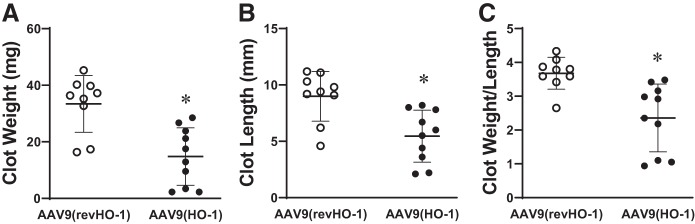
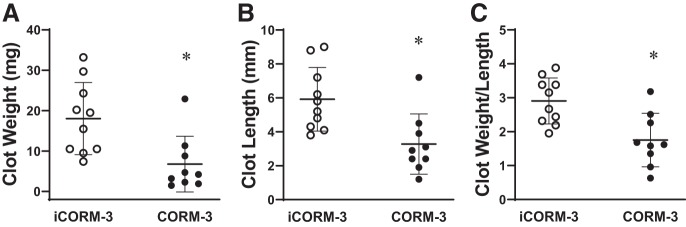
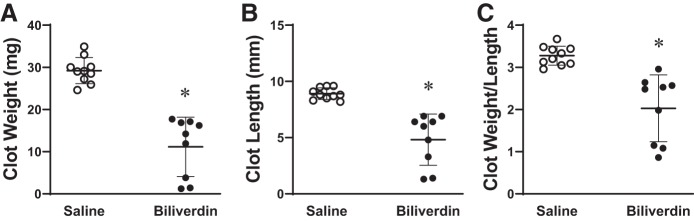
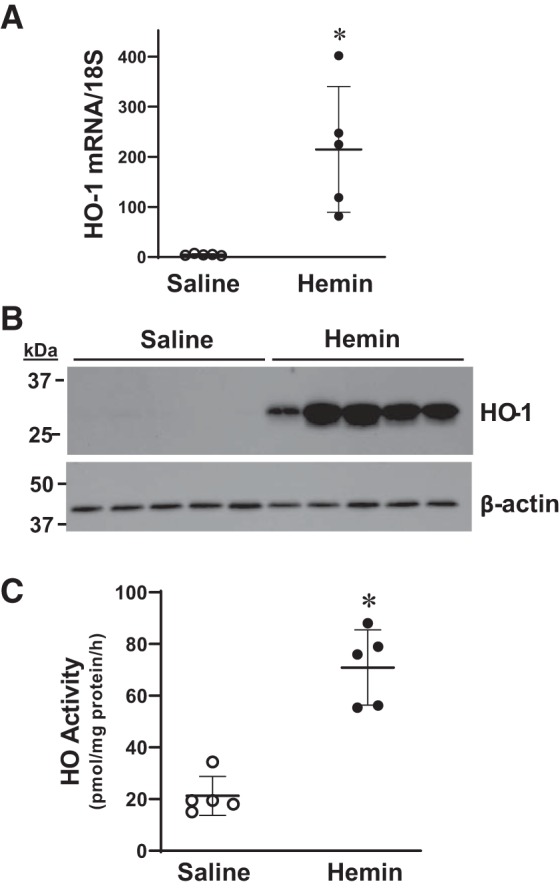
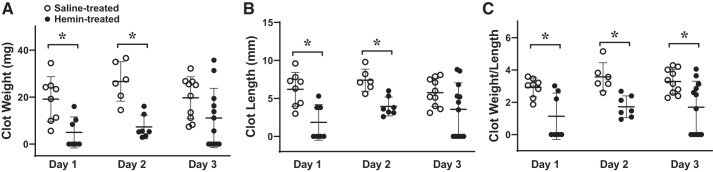
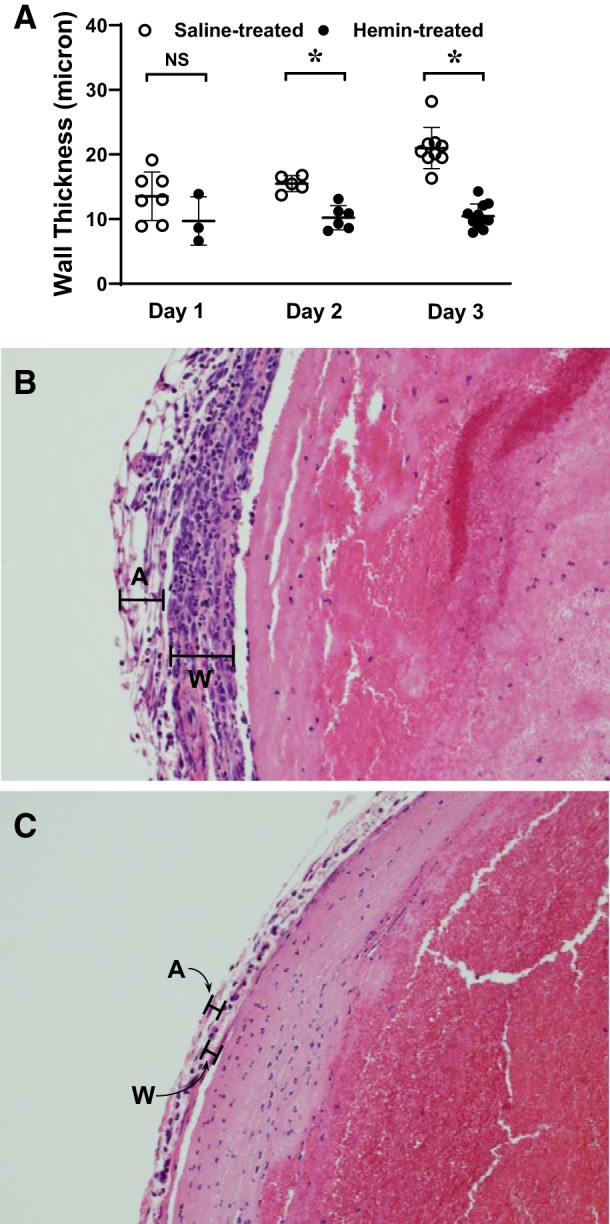
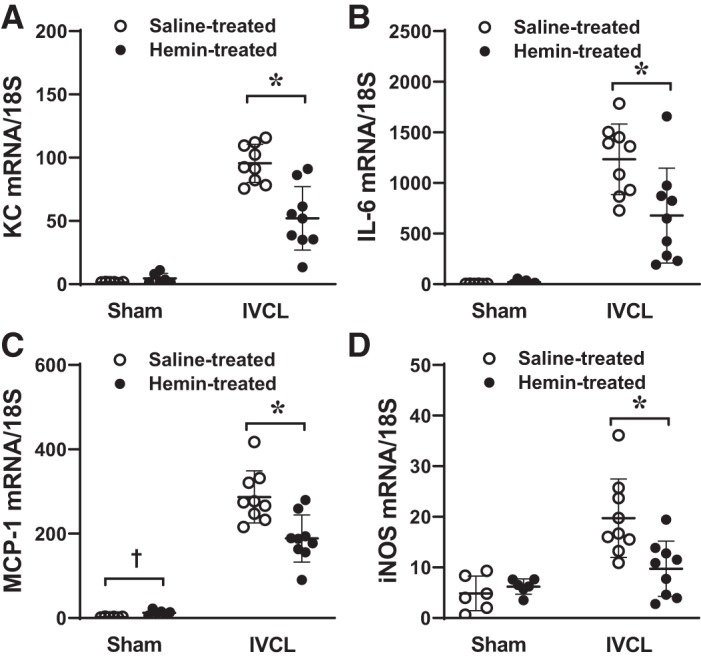
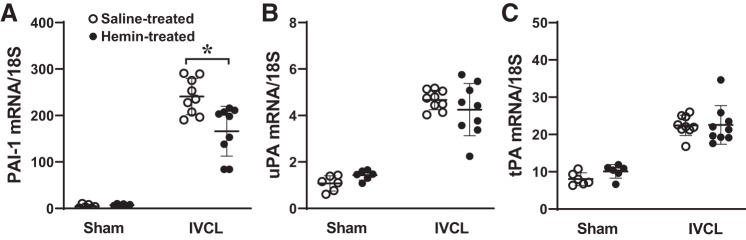
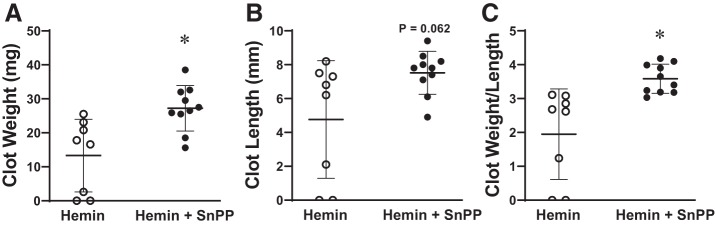
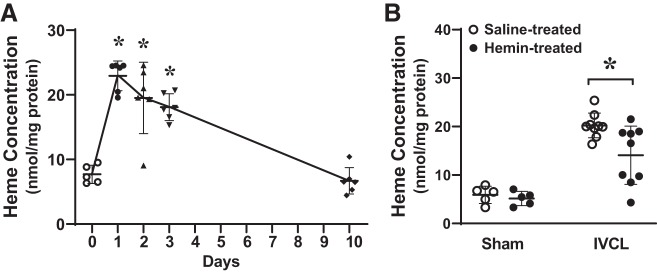
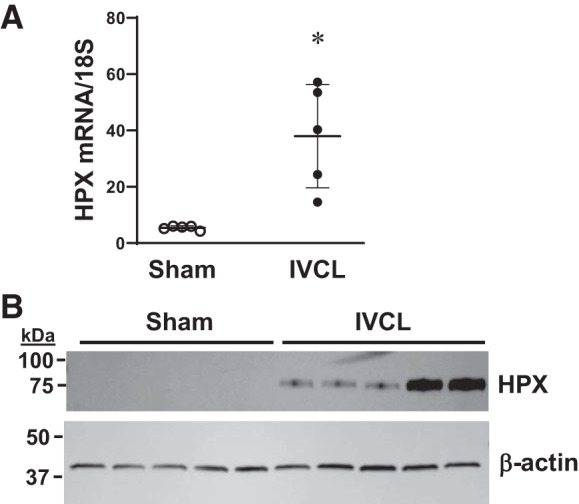
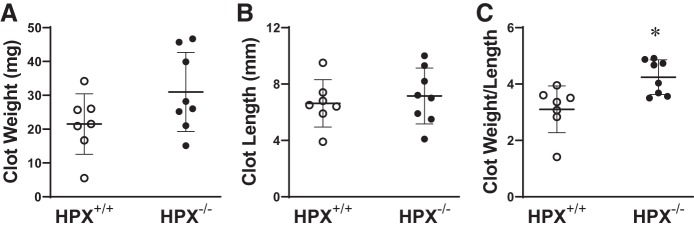
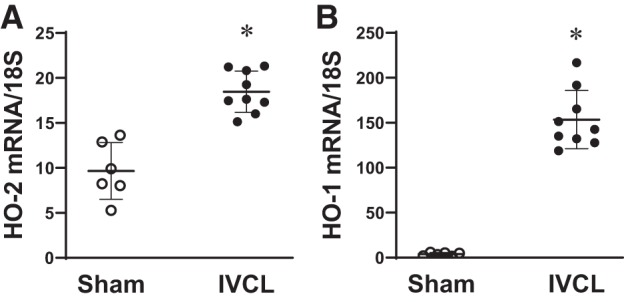
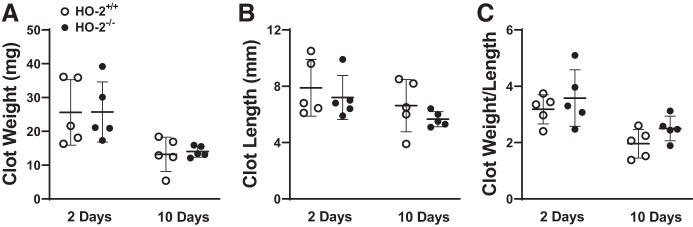
In the murine venous thrombosis model induced by ligation of the inferior vena cava (IVCL), genetic deficiency of heme oxygenase-1 (HO-1) increases clot size. This study examined whether induction of HO-1 or administration of its products reduces thrombosis. Venous HO-1 upregulation by gene delivery reduced clot size, as did products of HO activity, biliverdin, and carbon monoxide. Induction of HO-1 by hemin reduced clot formation, clot size, and upregulation of plasminogen activator inhibitor-1 (PAI-1) that occurs in the IVCL model, while leaving urokinase plasminogen activator (uPA) and tissue plasminogen activator (tPA) expression unaltered. The reductive effect of hemin on clot size required HO activity. The IVCL model exhibited relatively high concentrations of heme that peaked just before maximum clot size, then declined as clot size decreased. Administration of hemin decreased heme concentration in the IVCL model. HO-2 mRNA was induced twofold in the IVCL model (vs. 40-fold HO-1 induction), but clot size was not increased in HO-2-/- mice compared with HO-2+/+ mice. Hemopexin, the major heme-binding protein, was induced in the IVCL model, and clot size was increased in hemopexin-/- mice compared with hemopexin+/+ mice. We conclude that in the IVCL model, the heme-degrading protein HO-1 and HO products inhibit thrombus formation, as does the heme-binding protein, hemopexin. The reductive effects of hemin administration require HO activity and are mediated, in part, by reducing PAI-1 upregulation in the IVCL model. We speculate that HO-1, HO, and hemopexin reduce clot size by restraining the increase in clot concentration of heme (now recognized as a procoagulant) that otherwise occurs.NEW & NOTEWORTHY This study provides conclusive evidence that two proteins, one heme-degrading and the other heme-binding, inhibit clot formation. This may serve as a new therapeutic strategy in preventing and treating venous thromboembolic disease.

Keywords: bile pigments; carbon monoxide; heme oxygenase-1; hemopexin; murine model; venous thromboembolic disease.


Conflict of interest statement

G. M. Vercellotti and J. D. Belcher receive research funding from CSL Behring and Mitobridge/Astellas. Dr. Regan has received research funding from CSL Behring.

Figures

Fig. 1.
Fig. 1.
Effect of adeno-associated viral serotype 9 (AAV9)-mediated HO-1 upregulation on clot size in the inferior vena cava ligation (IVCL) model. Clot weight (A), clot length (B), and the clot weight-to-length ratio (C) in negative control vector [AAV9(revHO-1)]-treated (n = 9) and AAV9 vector [AAV9(HO-1)]-treated (n = 10) mice were determined at 2 days following IVCL. *P < 0.05 vs. AAV9(revHO-1)-treated group for that index.
Fig. 2.
Fig. 2.
Effect of carbon monoxide delivered via carbon monoxide-releasing molecule 3 (CORM-3) on clot size in the inferior vena cava ligation (IVCL) model. Clot weight (A), clot length (B), and the clot weight-to-length ratio (C) in inactivated CORM-3 (iCORM-3)-treated (n = 10) and CORM-3-treated (n = 9) mice were determined at 2 days following IVCL. *P < 0.05 vs. iCORM-3-treated group for that index.
Fig. 3.
Fig. 3.
Effect of biliverdin on clot size in the inferior vena cava ligation (IVCL) model. Clot weight (A), clot length (B), and the clot weight-to-length ratio (C) in saline-treated (n = 10) and biliverdin-treated (n = 9) mice were determined at 2 days following IVCL. *P < 0.05 vs. saline-treated group for that index.
Fig. 4.
Fig. 4.
Heme oxygenase-1 (HO-1) expression and HO activity in intact veins in mice administered hemin. HO-1 mRNA expression in jugular veins was measured by quantitative real-time RT-PCR (A), HO-1 protein expression in thoracic inferior vena cava (IVC) was assessed by Western blot analysis (B), and HO activity was determined in the abdominal IVC (C) in mice treated with saline or hemin daily for 3 days, but without IVC ligation. Assessments were made 6 h after the 3rd dose of saline or hemin. *P < 0.05 vs. saline-treated group; n = 5 in each group.
Fig. 5.
Fig. 5.
Effect of hemin on clot size in the inferior vena cava ligation (IVCL) model. Clot weight (A), clot length (B), and the clot weight-to-length ratio (C) were determined in saline-treated and hemin-treated mice at days 1, 2, and 3 following IVCL. n = 8, 6, and 10 in each group for days 1, 2, and 3, respectively, in saline-treated mice, and n = 7, 7, and 12 in each group for days 1, 2, and 3, respectively, in hemin-treated mice. *P < 0.05 vs. saline-treated group at that day.
Fig. 6.
Fig. 6.
Effect of hemin on venous wall thickness in the inferior vena cava ligation (IVCL) model. Venous wall thickness in the IVCL model in histologic samples available after tissue preparation and histological processing was determined morphometrically in saline-treated and hemin-treated mice at days 1, 2, and 3 following IVCL (A). n = 7, 5, and 9 in each group for days 1, 2, and 3, respectively, in saline-treated mice, and n = 3, 6, and 11 in each group for days 1, 2, and 3, respectively, in hemin-treated mice. *P < 0.05 vs. saline-treated group at that day. Representative histological views (×200) of the IVCL model in saline-treated (B) and hemin-treated (C) mice at day 3 after IVCL are shown. In B and C, the wall (W) and adventitia (A) are demarcated by black lines. The IVCL in hemin-treated mice displays reduced wall thickness and smaller and fewer foci of neutrophil-enriched inflammation.
Fig. 7.
Fig. 7.
Effect of hemin on the expression of inflammation-related genes in the inferior vena cava ligation (IVCL) model. Expression of keratinocyte chemoattractant (KC; A), interleukin-6 (IL-6; B), monocyte chemoattractant protein-1 (MCP-1; C) and inducible nitric oxide synthase (iNOS; D) was determined by quantitative real-time RT-PCR following IVCL or sham operation in saline-treated or hemin-treated mice and undertaken at day 2 after IVCL. n = 6 for each sham group, n = 9 for each IVCL group. *P < 0.05 vs. saline-treated IVCL. †P < 0.05 vs. saline-treated sham.
Fig. 8.
Fig. 8.
Effect of hemin on the expression of plasminogen activator inhibitor-1 (PAI-1), urokinase plasminogen activator (uPA), and tissue plasminogen activator (tPA) mRNA in the inferior vena cava ligation (IVCL) model. Expression of PAI-1 (A), uPA (B), and tPA (C) was determined by quantitative real time RT-PCR following IVCL or sham operation in saline-treated or hemin-treated mice and undertaken at day 2 after IVCL. n = 6 for each sham group; n = 9 for each IVCL group. *P < 0.05 vs. saline-treated IVCL.
Fig. 9.
Fig. 9.
Role of heme oxygenase (HO) activity in mediating the effect of hemin on clot size in the inferior vena cava ligation (IVCL) model. Clot weight (A), clot length (B), and the clot weight-to-length ratio (C) were determined in hemin-treated (n = 8) and hemin + SnPP (tin protoporphyrin)-treated (n = 10) mice at day 1 following IVCL. SnPP is a competitive inhibitor of HO activity. *P < 0.05 vs. hemin-treated group.
Fig. 10.
Fig. 10.
Heme concentration in the inferior vena cava (IVC) ligation (IVCL) model. A: heme concentration was measured by the pyridine-chromogen method and normalized for lysate protein content at day 1, 2, 3, and 10 following IVCL. n = 6 in each group for studies at day 1, 2, 3, and 10; n = 5 in the day 0 (IVC only control) group. *P < 0.05 vs. day 0. B: heme concentration was determined by pyridine-chromogen method following IVCL or sham operation in saline-treated or hemin-treated mice and undertaken at day 2 after IVCL. n = 5 for each sham group; n = 9 for each IVCL group. *P < 0.05 vs. saline-treated IVCL.
Fig. 11.
Fig. 11.
Expression of hemopexin (HPX) in the inferior vena cava (IVC) wall in the IVC ligation (IVCL) model. HPX mRNA was measured by quantitative real-time RT-PCR (A) and HPX protein was assessed by Western blot analysis (B) in the IVC wall (without contained clot) of mice 2 days following IVCL or sham operation. n = 5 in each group for the mRNA measurements in A. *P < 0.05 vs. sham group.
Fig. 12.
Fig. 12.
Effect of genetic deficiency of hemopexin (HPX) on clot size in the inferior vena cava ligation (IVCL) model. Clot weight (A), clot length (B), and the clot weight-to-length ratio (C) were determined in HPX+/+ mice and HPX−/− mice at day 2 following IVCL. n = 7 and n = 8 in HPX+/+ mice and HPX−/− groups, respectively. *P < 0.05 vs. HPX+/+ group for that index.
Fig. 13.
Fig. 13.
Expression of heme oxygenase-2 (HO-2) and heme oxygenase-1 (HO-1) mRNA in the inferior vena cava (IVC) ligation (IVCL) model. Expression of HO-2 (A) and HO-1 (B) mRNA in the IVCL model (IVC and contained clot) was determined in mice at 2 days after IVCL or sham surgery. n = 6 for each sham group; n = 9 for each IVCL group. *P < 0.05 vs. sham group.
Fig. 14.
Fig. 14.
Effect of genetic deficiency of heme oxygenase-2 (HO-2) on clot size in the inferior vena cava ligation (IVCL) model. Clot weight (A), clot length (B), and the clot weight-to-length ratio (C) were determined in HO-2+/+ mice and HO-2−/− mice at 2 and 10 days following IVCL. n = 5 in each group.

References

    1. Agarwal A, Bolisetty S. Adaptive responses to tissue injury: role of heme oxygenase-1. Trans Am Clin Climatol Assoc 124: 111–122, 2013. - PMC - PubMed
    1. Alam J, Killeen E, Gong P, Naquin R, Hu B, Stewart D, Ingelfinger JR, Nath KA. Heme activates the heme oxygenase-1 gene in renal epithelial cells by stabilizing Nrf2. Am J Physiol Renal Physiol 284: F743–F752, 2003. doi:10.1152/ajprenal.00376.2002. - DOI - PubMed
    1. Alotaibi GS, Wu C, Senthilselvan A, McMurtry MS. Secular trends in incidence and mortality of acute venous thromboembolism: the AB-VTE population-based study. Am J Med 129: 819–825, 2016. - PubMed
    1. Anderson UD, Jälmby M, Faas MM, Hansson SR. The hemoglobin degradation pathway in patients with preeclampsia - Fetal hemoglobin, heme, heme oxygenase-1 and hemopexin - Potential diagnostic biomarkers? Pregnancy Hypertens 14: 273–278, 2018. doi:10.1016/j.preghy.2018.02.005. - DOI - PubMed
    1. Ayer A, Zarjou A, Agarwal A, Stocker R. Heme oxygenases in cardiovascular health and disease. Physiol Rev 96: 1449–1508, 2016. doi:10.1152/physrev.00003.2016. - DOI - PMC - PubMed

Publication types