Observational Study
. 2020 Jan 31;17(1):e1003019.
doi: 10.1371/journal.pmed.1003019. eCollection 2020 Jan.

Comparison of aggregate and individual participant data approaches to meta-analysis of randomised trials: An observational study

Affiliations
Observational Study

Comparison of aggregate and individual participant data approaches to meta-analysis of randomised trials: An observational study

Jayne F Tierney et al. PLoS Med. .

Abstract

Background: It remains unclear when standard systematic reviews and meta-analyses that rely on published aggregate data (AD) can provide robust clinical conclusions. We aimed to compare the results from a large cohort of systematic reviews and meta-analyses based on individual participant data (IPD) with meta-analyses of published AD, to establish when the latter are most likely to be reliable and when the IPD approach might be required.

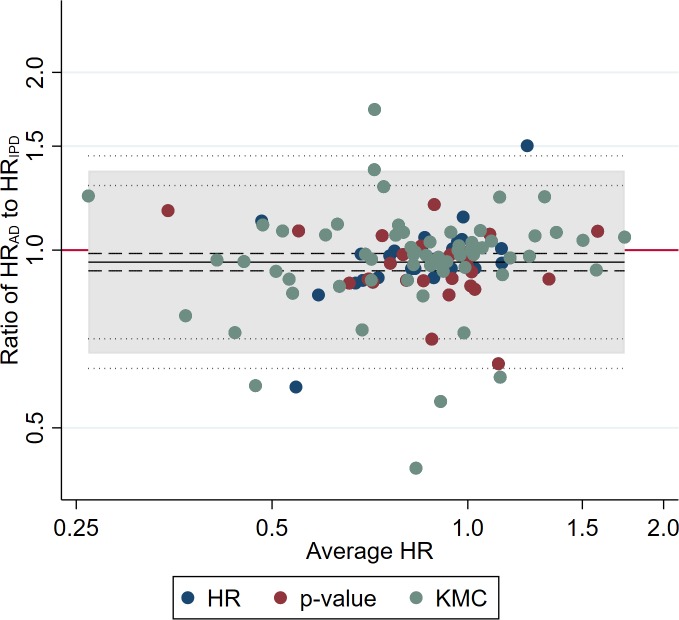
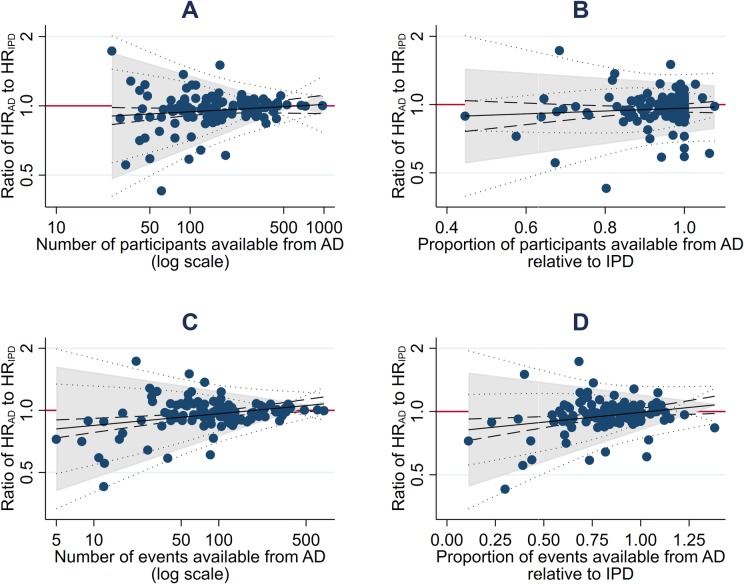
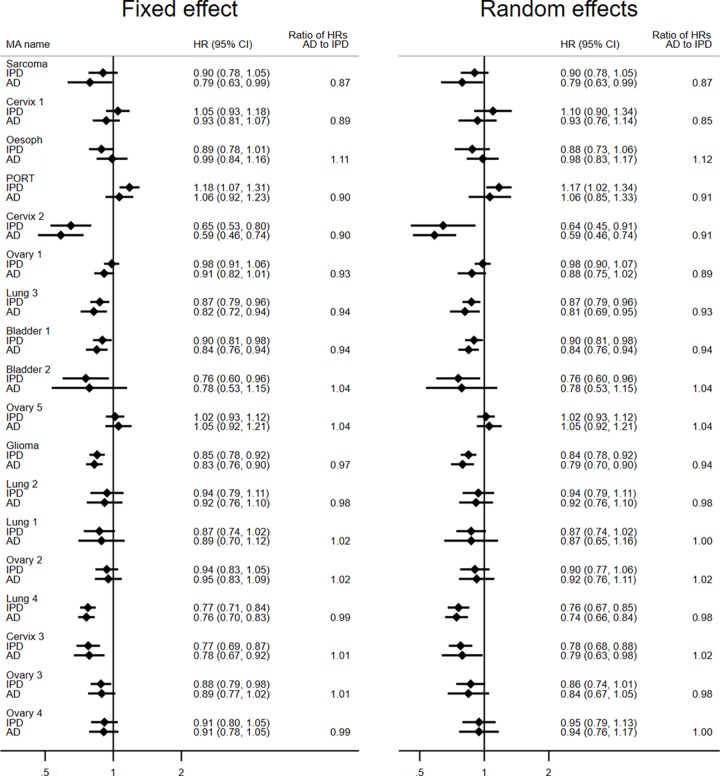
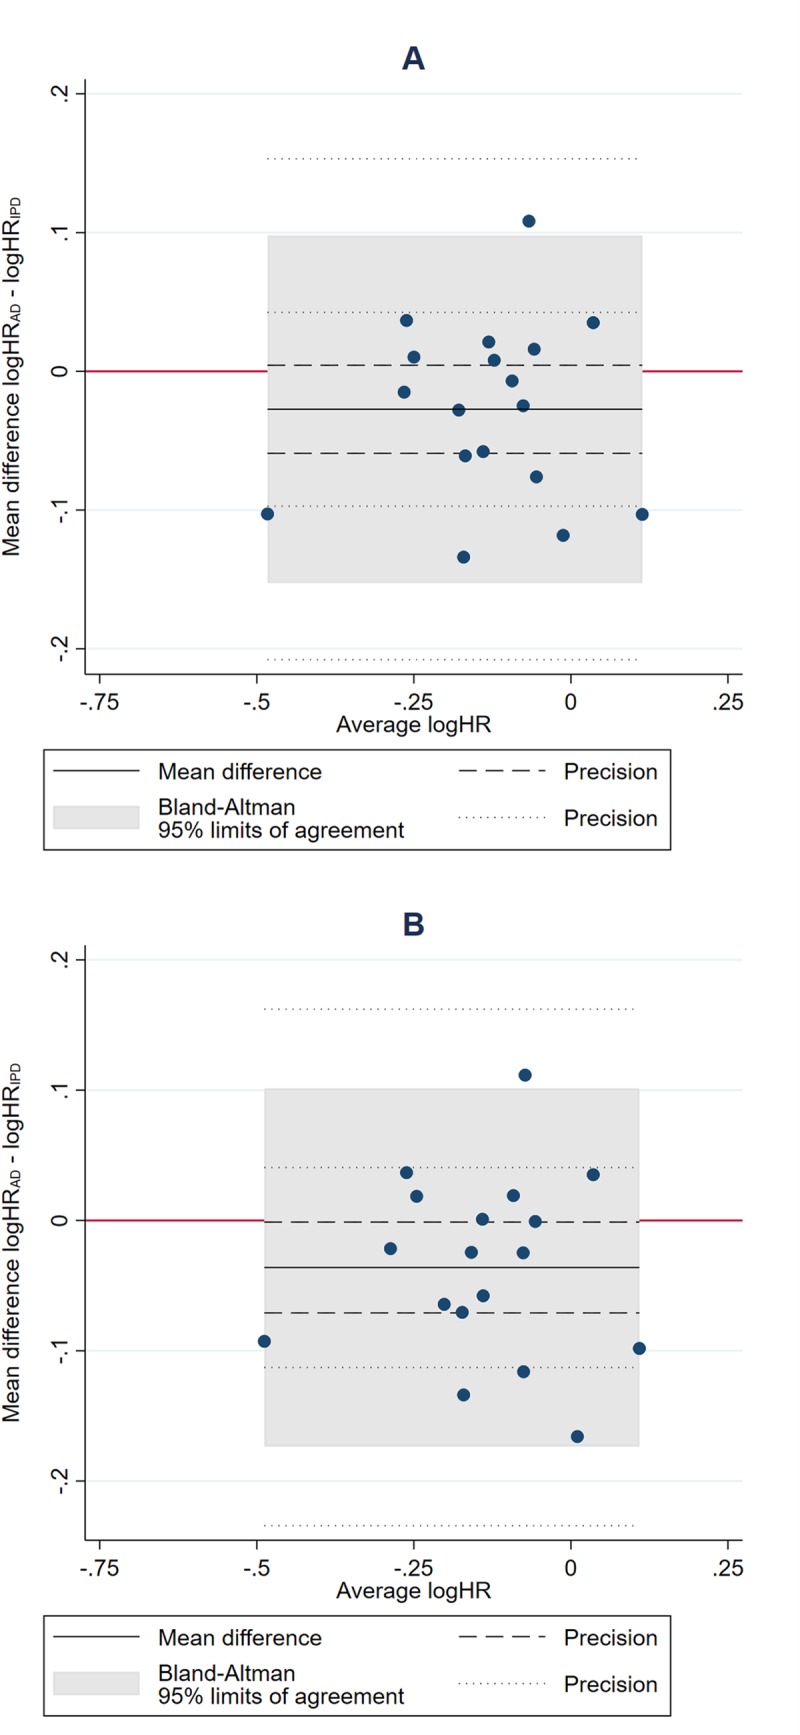
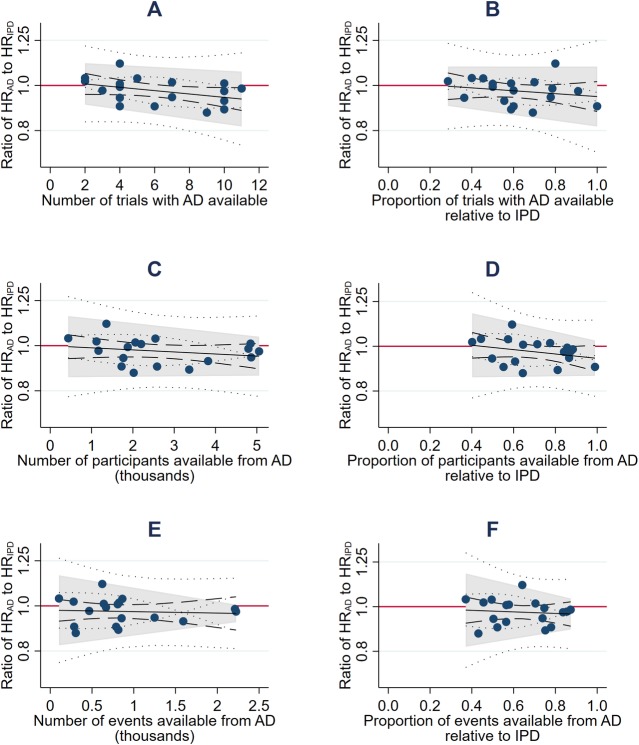
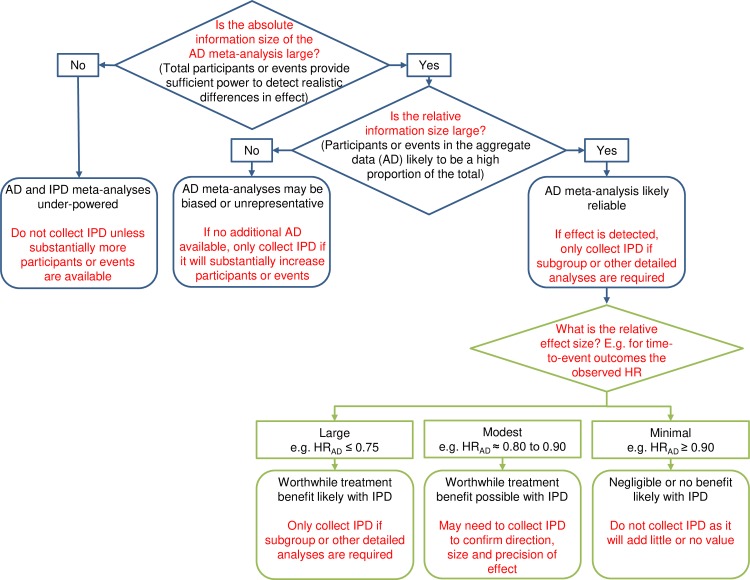
Methods and findings: We used 18 cancer systematic reviews that included IPD meta-analyses: all of those completed and published by the Meta-analysis Group of the MRC Clinical Trials Unit from 1991 to 2010. We extracted or estimated hazard ratios (HRs) and standard errors (SEs) for survival from trial reports and compared these with IPD equivalents at both the trial and meta-analysis level. We also extracted or estimated the number of events. We used paired t tests to assess whether HRs and SEs from published AD differed on average from those from IPD. We assessed agreement, and whether this was associated with trial or meta-analysis characteristics, using the approach of Bland and Altman. The 18 systematic reviews comprised 238 unique trials or trial comparisons, including 37,082 participants. A HR and SE could be generated for 127 trials, representing 53% of the trials and approximately 79% of eligible participants. On average, trial HRs derived from published AD were slightly more in favour of the research interventions than those from IPD (HRAD to HRIPD ratio = 0.95, p = 0.007), but the limits of agreement show that for individual trials, the HRs could deviate substantially. These limits narrowed with an increasing number of participants (p < 0.001) or a greater number (p < 0.001) or proportion (p < 0.001) of events in the AD. On average, meta-analysis HRs from published AD slightly tended to favour the research interventions whether based on fixed-effect (HRAD to HRIPD ratio = 0.97, p = 0.088) or random-effects (HRAD to HRIPD ratio = 0.96, p = 0.044) models, but the limits of agreement show that for individual meta-analyses, agreement was much more variable. These limits tended to narrow with an increasing number (p = 0.077) or proportion of events (p = 0.11) in the AD. However, even when the information size of the AD was large, individual meta-analysis HRs could still differ from their IPD equivalents by a relative 10% in favour of the research intervention to 5% in favour of control. We utilised the results to construct a decision tree for assessing whether an AD meta-analysis includes sufficient information, and when estimates of effects are most likely to be reliable. A lack of power at the meta-analysis level may have prevented us identifying additional factors associated with the reliability of AD meta-analyses, and we cannot be sure that our results are generalisable to all outcomes and effect measures.

Conclusions: In this study we found that HRs from published AD were most likely to agree with those from IPD when the information size was large. Based on these findings, we provide guidance for determining systematically when standard AD meta-analysis will likely generate robust clinical conclusions, and when the IPD approach will add considerable value.


Conflict of interest statement

The authors have declared that no competing interests exist

Figures

Fig 1
Fig 1. Comparison of trial HRs from AD versus IPD.
Bland–Altman plot showing how the ratio of the HR from AD to the HR from IPD varies with the average HR (i.e., the geometric mean of the 2 HR estimates). The red horizontal line represents no difference (i.e., a ratio of 1). The shaded area represents the 95% Bland–Altman limits of agreement. Dashed and dotted lines represent statistical precision around the average ratio and the limits of agreement, respectively. Individual data points are distinguished by whether the AD estimate was derived directly from a reported HR, indirectly from a reported p-value and associated information, or indirectly from a Kaplan–Meier curve [6]. AD, aggregate data; HR, hazard ratio; IPD, individual participant data; KMC, Kaplan–Meier curve.
Fig 2
Fig 2. Potential predictors of the extent of agreement between trial HRs from AD and IPD.
Bland–Altman plots showing how the ratio of the HR from AD to the HR from IPD varies according to the number of participants (A) and events (C) available from AD, and the proportion of participants (B) and events (D) available from AD relative to IPD. The red horizontal lines represent no difference (i.e., a ratio of 1). The shaded areas represent the 95% Bland–Altman limits of agreement, with fitted linear dependence upon the value of the covariate. Dashed and dotted lines represent statistical precision around the average ratios and the limits of agreement, respectively. AD, aggregate data; HR, hazard ratio; IPD, individual participant data.
Fig 3
Fig 3. Forest plot of meta-analysis HRs and 95% confidence intervals from AD and IPD.
Each filled diamond denotes the HR for AD or IPD based on fixed-effect and random-effects meta-analyses, with the horizontal lines showing the 95% CIs. Comparisons are ordered by the degree of disagreement, i.e., the HRAD to HRIPD ratio, irrespective of direction. AD, aggregate data; HR, hazard ratio; IPD, individual participant data; MA, meta-analysis.
Fig 4
Fig 4. Comparison of meta-analysis HRs from AD versus IPD.
Bland–Altman plots showing how the ratio of the HR from AD to the HR from IPD, as estimated by fixed-effect (A) and random-effects models (B), respectively, varies with the average HR (i.e., the geometric mean of the 2 HR estimates). The red horizontal line represents no difference (i.e., a ratio of 1). The shaded area represents the 95% Bland–Altman limits of agreement. Dashed and dotted lines represent statistical precision around the average ratio and the limits of agreement, respectively. AD, aggregate data; HR, hazard ratio; IPD, individual participant data.
Fig 5
Fig 5. Potential predictors of the extent of agreement between (fixed-effect) meta-analysis HRs from AD and IPD.
Bland–Altman plots showing how the ratio of the HR from AD to the HR from IPD varies according to the number of trials (A), participants (C), and events (E) available from AD, and the proportion of trials (B), patients (D), and events (F) available from AD relative to IPD. The red horizontal lines represent no difference (i.e., a ratio of 1). The shaded areas represent the 95% Bland–Altman limits of agreement, with fitted linear dependence upon the value of the covariate. Dashed and dotted lines represent statistical precision around the average ratios and the limits of agreement, respectively. AD, aggregate data; HR, hazard ratio; IPD, individual participant data.
Fig 6
Fig 6. Decision tree for assessing when AD meta-analysis HRs are likely reliable and when the IPD approach might be required.
AD, aggregate data; HR, hazard ratio; IPD, individual participant data.

References

    1. Page MJ, Shamseer L, Altman DG, Tetzlaff J, Sampson M, Tricco AC, et al. Epidemiology and reporting characteristics of systematic reviews of biomedical research: a cross-sectional study. PLoS Med. 2016;13(5):e1002028 10.1371/journal.pmed.1002028 - DOI - PMC - PubMed
    1. Baudard M, Yavchitz A, Ravaud P, Perrodeau E, Boutron I. Impact of searching clinical trial registries in systematic reviews of pharmaceutical treatments: methodological systematic review and reanalysis of meta-analyses. BMJ. 2017;356:j448 10.1136/bmj.j448 - DOI - PMC - PubMed
    1. Sterne JAC, Egger M, Moher D, Cochrane Bias Methods Group. Addressing reporting biases In: Higgins JPT, Green S, editors. Cochrane handbook for systematic reviews of interventions. Chichester (UK): John Wiley & Sons; 2008. pp. 297–333.
    1. Parmar MKB, Torri V, Stewart LA. Extracting summary statistics to perform meta-analyses of the published literature for survival endpoints. Stat Med. 1998;17:2815–34. 10.1002/(sici)1097-0258(19981230)17:24<2815::aid-sim110>3.0.co;2-8 - DOI - PubMed
    1. Williamson PR, Tudur Smith C, Hutton JL, Marson AG. Aggregate data meta-analysis with time-to-event outcomes. Stat Med. 2002;21:3337–51. 10.1002/sim.1303 - DOI - PubMed

Publication types