The effect of enrofloxacin on enteric Escherichia coli: Fitting a mathematical model to in vivo data
- PMID: 32004337
- PMCID: PMC6993981
- DOI: 10.1371/journal.pone.0228138
The effect of enrofloxacin on enteric Escherichia coli: Fitting a mathematical model to in vivo data
Abstract
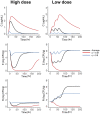
Antimicrobial drugs administered systemically may cause the emergence and dissemination of antimicrobial resistance among enteric bacteria. To develop logical, research-based recommendations for food animal veterinarians, we must understand how to maximize antimicrobial drug efficacy while minimizing risk of antimicrobial resistance. Our objective is to evaluate the effect of two approved dosing regimens of enrofloxacin (a single high dose or three low doses) on Escherichia coli in cattle. We look specifically at bacteria above and below the epidemiological cutoff (ECOFF), above which the bacteria are likely to have an acquired or mutational resistance to enrofloxacin. We developed a differential equation model for the antimicrobial drug concentrations in plasma and colon, and bacteria populations in the feces. The model was fit to animal data of drug concentrations in the plasma and colon obtained using ultrafiltration probes. Fecal E. coli counts and minimum inhibitory concentrations were measured for the week after receiving the antimicrobial drug. We predict that the antimicrobial susceptibility of the bacteria above the ECOFF pre-treatment strongly affects the composition of the bacteria following treatment. Faster removal of the antimicrobial drugs from the colon throughout the study leads to improved clearance of bacteria above the ECOFF in the low dose regimen. If we assume a fitness cost is associated with bacteria above the ECOFF, the increased fitness costs leads to reduction of bacteria above the ECOFF in the low dose study. These results suggest the initial E. coli susceptibility is a strong indicator of how steers respond to antimicrobial drug treatment.
Figures


Similar articles
-
Quantifying trade-offs between therapeutic efficacy and resistance dissemination for enrofloxacin dose regimens in cattle.Sci Rep. 2024 Sep 4;14(1):20598. doi: 10.1038/s41598-024-70741-8. Sci Rep. 2024. PMID: 39232037 Free PMC article.
-
Quantifying trade-offs between therapeutic efficacy and resistance dissemination for enrofloxacin dose regimens in cattle.Res Sq [Preprint]. 2024 Apr 9:rs.3.rs-4166888. doi: 10.21203/rs.3.rs-4166888/v1. Res Sq. 2024. Update in: Sci Rep. 2024 Sep 4;14(1):20598. doi: 10.1038/s41598-024-70741-8. PMID: 38659948 Free PMC article. Updated. Preprint.
-
Selection for amoxicillin-, doxycycline-, and enrofloxacin-resistant Escherichia coli at concentrations lower than the ECOFF in broiler-derived cecal fermentations.Microbiol Spectr. 2024 Oct 3;12(10):e0097024. doi: 10.1128/spectrum.00970-24. Epub 2024 Sep 13. Microbiol Spectr. 2024. PMID: 39269186 Free PMC article.
-
Ceftiofur formulation differentially affects the intestinal drug concentration, resistance of fecal Escherichia coli, and the microbiome of steers.PLoS One. 2019 Oct 4;14(10):e0223378. doi: 10.1371/journal.pone.0223378. eCollection 2019. PLoS One. 2019. PMID: 31584976 Free PMC article.
-
Exploring Post-Treatment Reversion of Antimicrobial Resistance in Enteric Bacteria of Food Animals as a Resistance Mitigation Strategy.Foodborne Pathog Dis. 2016 Nov;13(11):610-617. doi: 10.1089/fpd.2016.2152. Epub 2016 Aug 23. Foodborne Pathog Dis. 2016. PMID: 27552491 Review.
Cited by
-
Quantifying trade-offs between therapeutic efficacy and resistance dissemination for enrofloxacin dose regimens in cattle.Sci Rep. 2024 Sep 4;14(1):20598. doi: 10.1038/s41598-024-70741-8. Sci Rep. 2024. PMID: 39232037 Free PMC article.
-
Antibiotic use practices of veterinarians and para-veterinarians and the implications for antibiotic stewardship in Nigeria.J S Afr Vet Assoc. 2021 May 28;92(0):e1-e14. doi: 10.4102/jsava.v92i0.2120. J S Afr Vet Assoc. 2021. PMID: 34082541 Free PMC article.
-
Quantifying trade-offs between therapeutic efficacy and resistance dissemination for enrofloxacin dose regimens in cattle.Res Sq [Preprint]. 2024 Apr 9:rs.3.rs-4166888. doi: 10.21203/rs.3.rs-4166888/v1. Res Sq. 2024. Update in: Sci Rep. 2024 Sep 4;14(1):20598. doi: 10.1038/s41598-024-70741-8. PMID: 38659948 Free PMC article. Updated. Preprint.
-
Targeted dosing for susceptible heteroresistant subpopulations may improve rational dosage regimen prediction for colistin in broiler chickens.Sci Rep. 2023 Aug 7;13(1):12822. doi: 10.1038/s41598-023-39727-w. Sci Rep. 2023. PMID: 37550398 Free PMC article.
-
Application of Semi-Mechanistic Pharmacokinetic and Pharmacodynamic Model in Antimicrobial Resistance.Pharmaceutics. 2022 Jan 21;14(2):246. doi: 10.3390/pharmaceutics14020246. Pharmaceutics. 2022. PMID: 35213979 Free PMC article. Review.
References
-
- Riviere J, Papich M. Veterinary pharmacology and therapeutics. John Wiley & Sons; 2018.
-
- Collignon P, Conly J, Andremont A, McEwen S, et al. World Health Organization ranking of antimicrobials according to their importance in human medicine: a critical step for developing risk management strategies to control antimicrobial resistance from food animal production. Clin Infect Dis. 2016;63:1087–93. 10.1093/cid/ciw475 - DOI - PubMed
Publication types
MeSH terms
Substances
Grants and funding
LinkOut - more resources
Full Text Sources
Medical

