

A hierarchical Bayesian latent class mixture model with censorship for detection of linear temporal changes in antibiotic resistance
- PMID: 32004341
- PMCID: PMC6993983
- DOI: 10.1371/journal.pone.0220427
A hierarchical Bayesian latent class mixture model with censorship for detection of linear temporal changes in antibiotic resistance
Abstract
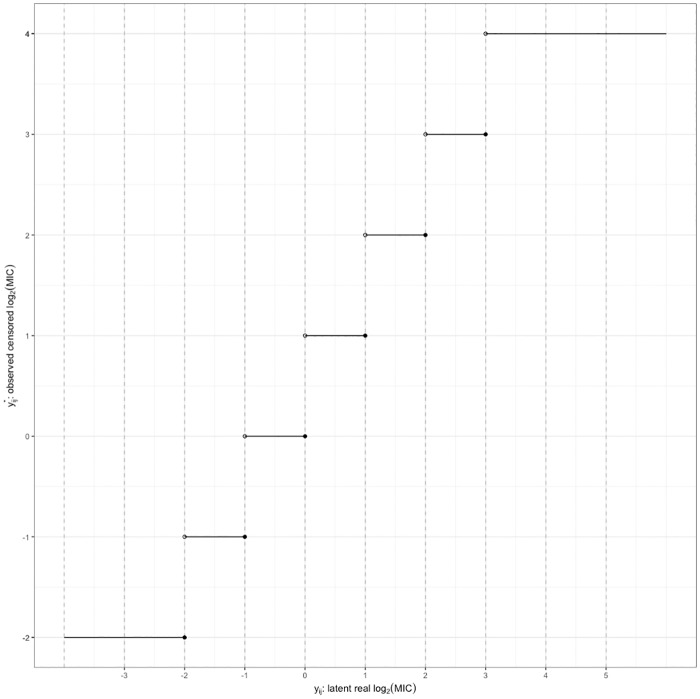
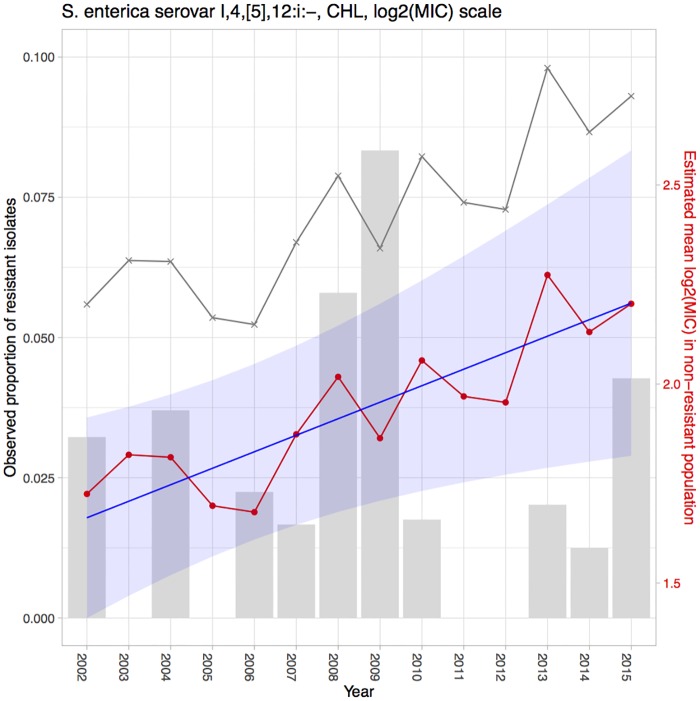
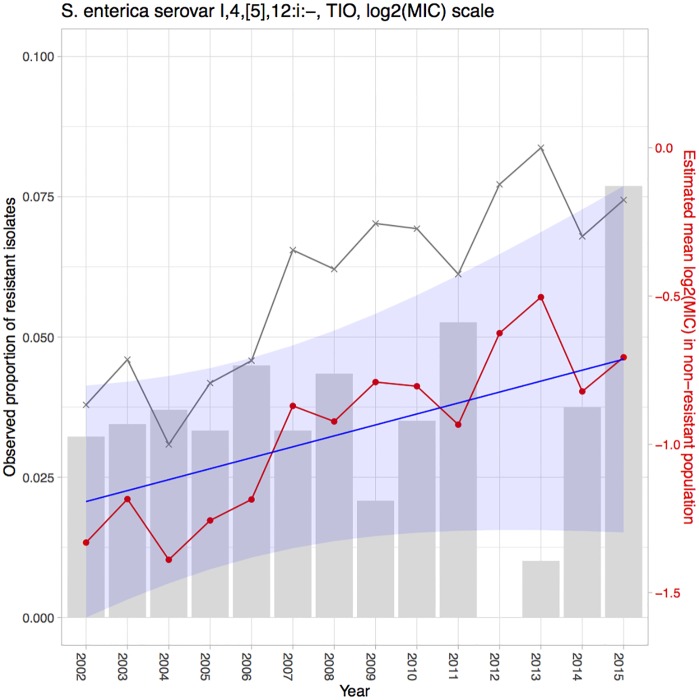
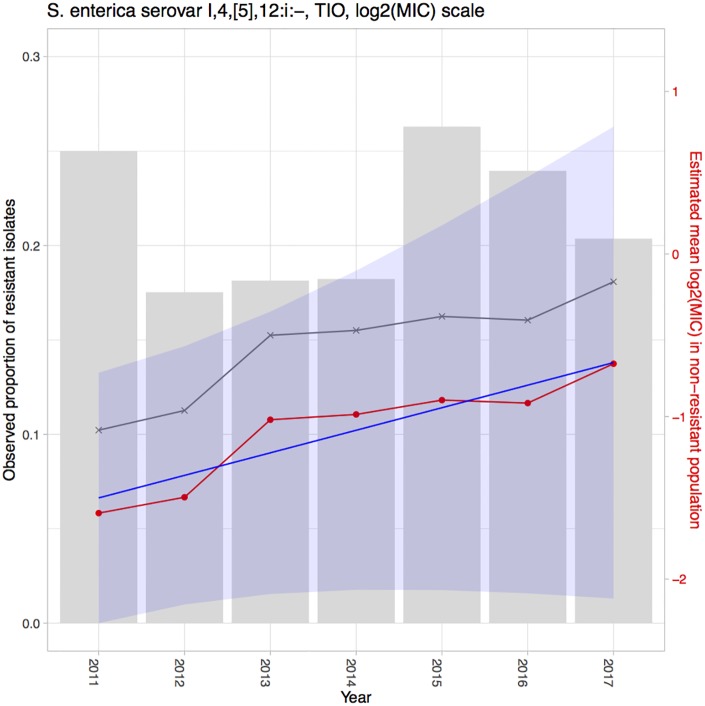
Identifying and controlling the emergence of antimicrobial resistance (AMR) is a high priority for researchers and public health officials. One critical component of this control effort is timely detection of emerging or increasing resistance using surveillance programs. Currently, detection of temporal changes in AMR relies mainly on analysis of the proportion of resistant isolates based on the dichotomization of minimum inhibitory concentration (MIC) values. In our work, we developed a hierarchical Bayesian latent class mixture model that incorporates a linear trend for the mean log2MIC of the non-resistant population. By introducing latent variables, our model addressed the challenges associated with the AMR MIC values, compensating for the censored nature of the MIC observations as well as the mixed components indicated by the censored MIC distributions. Inclusion of linear regression with time as a covariate in the hierarchical structure allowed modelling of the linear creep of the mean log2MIC in the non-resistant population. The hierarchical Bayesian model was accurate and robust as assessed in simulation studies. The proposed approach was illustrated using Salmonella enterica I,4,[5],12:i:- treated with chloramphenicol and ceftiofur in human and veterinary samples, revealing some significant linearly increasing patterns from the applications. Implementation of our approach to the analysis of an AMR MIC dataset would provide surveillance programs with a more complete picture of the changes in AMR over years by exploring the patterns of the mean resistance level in the non-resistant population. Our model could therefore serve as a timely indicator of a need for antibiotic intervention before an outbreak of resistance, highlighting the relevance of this work for public health. Currently, however, due to extreme right censoring on the MIC data, this approach has limited utility for tracking changes in the resistant population.
Conflict of interest statement
The authors have declared that no competing interests exist.
Figures
References
-
- van de Kassteele J, van Santen-Verheuvel MG, Koedijk FD, van Dam AP, van der Sande MA, de Neeling AJ. New statistical technique for analyzing MIC-based susceptibility data. Antimicrobial Agents and Chemotherapy. American Society for Microbiology. 2012. January;56:1557–1563. 10.1128/AAC.05777-11 - DOI - PMC - PubMed
-
- Komárek A. A new R package for Bayesian estimation of multivariate normal mixtures allowing for selection of the number of components and interval-censored data. Computational Statistics & Data Analysis. Elsevier. 2009. October;53(12):3932–3947. 10.1016/j.csda.2009.05.006 - DOI
-
- Jaspers S, Aerts M, Verbeke G, Beloeil PA. A new semi-parametric mixture model for interval censored data, with applications in the field of antimicrobial resistance. Computational Statistics & Data Analysis. Elsevier. 2014. March;71:30–42. 10.1016/j.csda.2013.01.024 - DOI
Publication types
MeSH terms
Substances
LinkOut - more resources
Full Text Sources
Medical
