. 2020 Jan 31;15(1):e0228393.
doi: 10.1371/journal.pone.0228393. eCollection 2020.

Chronic exposure to diesel particles worsened emphysema and increased M2-like phenotype macrophages in a PPE-induced model

Affiliations

Chronic exposure to diesel particles worsened emphysema and increased M2-like phenotype macrophages in a PPE-induced model

Alyne Riani Moreira et al. PLoS One. .

Abstract

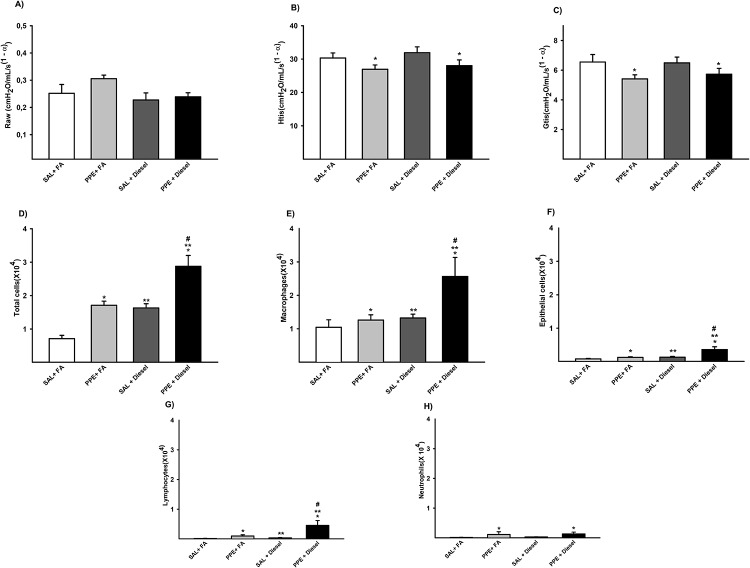
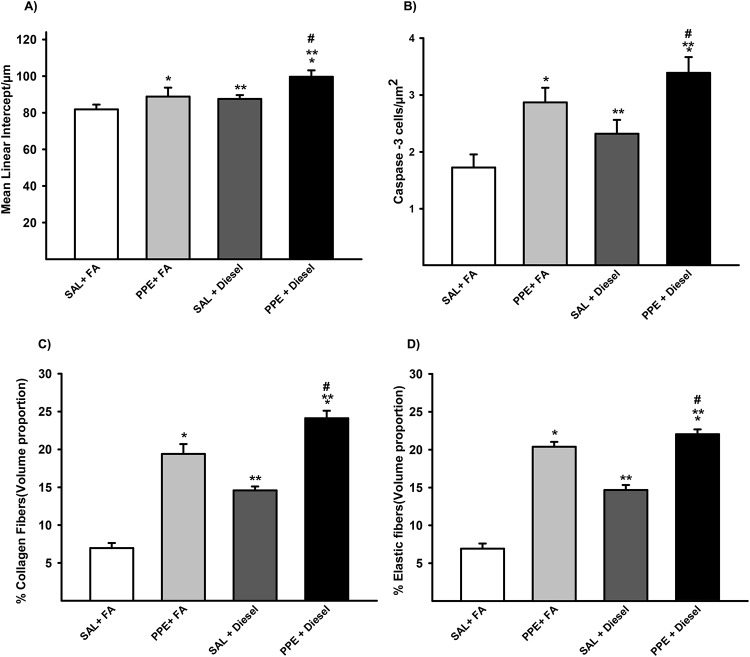
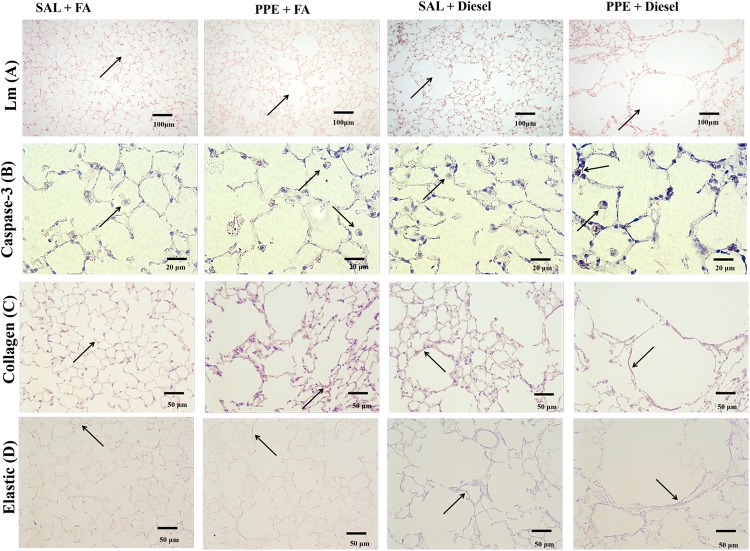
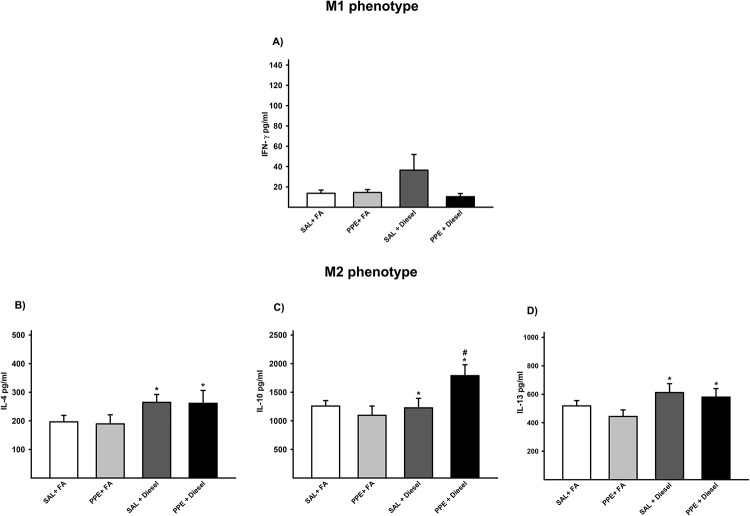
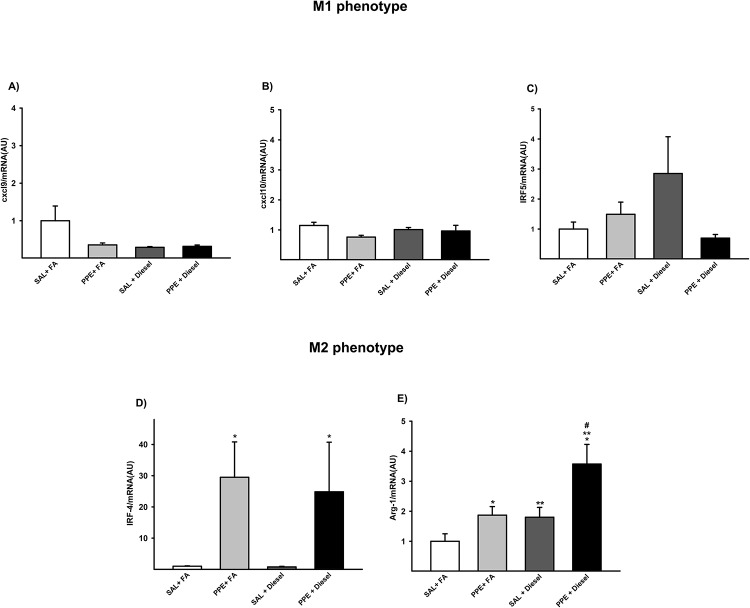
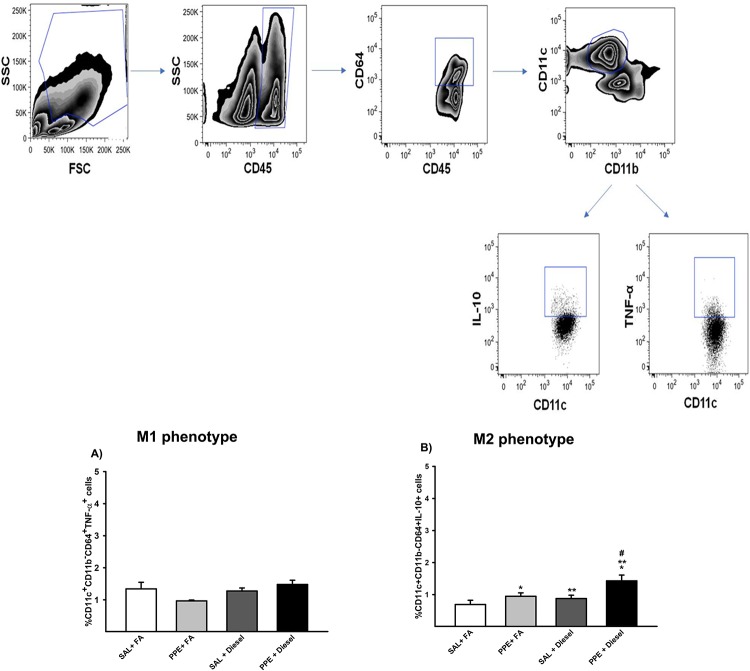
Chronic exposure to ambient levels of air pollution induces respiratory illness exacerbation by increasing inflammatory responses and apoptotic cells in pulmonary tissues. The ineffective phagocytosis of these apoptotic cells (efferocytosis) by macrophages has been considered an important factor in these pathological mechanisms. Depending on microenvironmental stimuli, macrophages can assume different phenotypes with different functional actions. M1 macrophages are recognized by their proinflammatory activity, whereas M2 macrophages play pivotal roles in responding to microorganisms and in efferocytosis to avoid the progression of inflammatory conditions. To verify how exposure to air pollutants interferes with macrophage polarization in emphysema development, we evaluated the different macrophage phenotypes in a PPE- induced model with the exposure to diesel exhaust particles. C57BL/6 mice received intranasal instillation of porcine pancreatic elastase (PPE) to induce emphysema, and the control groups received saline. Both groups were exposed to diesel exhaust particles or filtered air for 60 days according to the groups. We observed that both the diesel and PPE groups had an increase in alveolar enlargement, collagen and elastic fibers in the parenchyma and the number of macrophages, lymphocytes and epithelial cells in BAL, and these responses were exacerbated in animals that received PPE instillation prior to exposure to diesel exhaust particles. The same response pattern was found inCaspase-3 positive cell analysis, attesting to an increase in cell apoptosis, which is in agreement with the increase in M2 phenotype markers, measured by RT-PCR and flow cytometry analysis. We did not verify differences among the groups for the M1 phenotype. In conclusion, our results showed that both chronic exposure to diesel exhaust particles and PPE instillation induced inflammatory conditions, cell apoptosis and emphysema development, as well as an increase in M2 phenotype macrophages, and the combination of these two factors exacerbated these responses. The predominance of the M2-like phenotype likely occurred due to the increased demand for efferocytosis. However, M2 macrophage activity was ineffective, resulting in emphysema development and worsening of symptoms.


Conflict of interest statement

The authors have declared that no competing interests exist.

Figures

Fig 1
Fig 1. Parameters of respiratory mechanic for Raw (A), Htis (B) and Gtis (C) are expressed as the mean ± SE (SAL + FA group: n = 9, PPE + FA group: n = 9, SAL + Diesel group: n = 14 and PPE + Diesel group: n = 10).
(A) No significant difference for this parameter. (B) F = 7.774; df = 1; *p = 0.008 compared with the SAL + FA and SAL + Diesel groups (C) F = 5.356; df = 1; *p = 0.026 compared with the SAL + FA and PPE + FA groups. Values of total cells (D), macrophages (E), epithelial cells (F), lymphocytes (G) and neutrophils (H) in BAL are expressed as the mean ± SE. (D) F = 33.067; df = 1; *p ≤ 0.001 compared with the SAL + FA and SAL + Diesel groups. F = 28.636; df = 1; **p ≤ 0.001 compared with the SAL + FA and PPE + FA groups. F = 0.404; df = 1; #p < 0.001 compared with the PPE + FA and SAL + Diesel groups (SAL + FA group: n = 10, PPE + FA group: n = 10, SAL + Diesel group: n = 14 and PPE + Diesel group: n = 13). (E) F = 4.363; df = 1; *p = 0.043 compared with the SAL + FA and SAL + Diesel groups. F = 5.157; df = 1; **p = 0.028 compared with the SAL + FA and PPE + FA groups. F = 2.166; df = 1; #p = 0.012 compared with the PPE + FA and SAL + Diesel groups (SAL + FA group: n = 10, PPE + FA group: n = 10, SAL + Diesel group: n = 14 and PPE + Diesel group: n = 13). (F) F = 7.414; df = 1; *p = 0.009 compared with the SAL + FA and SAL + Diesel groups. F = 8.117; df = 1; **p = 0.007 compared with the SAL + FA and PPE + FA groups. F = 3.268; df = 1; #p = 0.002 compared with the PPE + FA and SAL + Diesel groups (SAL + FA group: n = 10, PPE + FA group: n = 10, SAL + Diesel group: n = 14 and PPE + Diesel group: n = 13). (G) F = 5.884; df = 1; *p = 0.020 compared with the SAL + FA and SAL + Diesel groups. F = 4.861; df = 1; **p = 0.033 compared with the SAL + FA and PPE + FA groups. F = 3.976; df = 1; #p < 0.006 compared with the PPE + FA and SAL + Diesel groups (SAL + FA group: n = 10, PPE + FA group: n = 10, SAL + Diesel group: n = 14 and PPE + Diesel group n = 13). (H) F = 4.590; df = 1; *p = 0.039 compared with the SAL + FA and SAL + Diesel groups (SAL + FA group: n = 10, PPE + FA group: n = 9, SAL + Diesel group: n = 13 and PPE + Diesel group: n = 12).
Fig 2
Fig 2. Lm (A) values in distal areas of the parenchyma are expressed as the mean ± SE (SAL + FA group: n = 7, PPE + FA group: n = 8, SAL + Diesel group: n = 11 and PPE + Diesel group: n = 10).
(A) F = 21.546; df = 1; *p = 0.001 compared with the SAL + FA and SAL + Diesel groups. F = 9.702; df = 1; **p ≤ 0.004 compared with the SAL + FA and PPE + FA groups. F = 0.114; df = 1; #p = 0.023 compared with the PPE + FA and SAL + Diesel groups. The density of positive cells for Caspase-3 (B) in the lung parenchyma is expressed as the mean ± SE (SAL + FA group: n = 10, PPE + FA group: n = 9, SAL + Diesel group: n = 13 and PPE + Diesel group: n = 12). (B)F = 18.394; df = 1; *p < 0.001 compared with the SAL + FA and SAL + Diesel groups. F = 4.655; df = 1; **p = 0.039 compared with the SAL + FA and PPE + FA groups. F = 0.0213; df = 1; #p ≤ 0.005 compared with the PPE + FA and SAL + Diesel groups. Volume proportion of collagen (C) in distal areas of the parenchyma are expressed as the mean ± SE (SAL + FA group: n = 7, PPE + FA group: n = 8, SAL + Diesel group: n = 11 and PPE + Diesel group: n = 10). (C) F = 47.997; df = 1; *p < 0.001 compared with the SAL + FA and SAL + Diesel groups. F = 140.696; df = 1; **p < 0.001 compared with the SAL + FA and PPE + FA groups. F = 0.628; df = 1; #p < 0.001 compared with the PPE + FA and SAL + Diesel groups. The volume proportion of elastic fibers (D) in distal areas of the parenchyma are expressed as the mean ± SE (SAL + FA group: n = 7, PPE + FA group: n = 8, SAL + Diesel group: n = 11 and PPE + Diesel group: n = 10). (D) F = 244.562; df = 1; *p < 0.001 compared with the SAL + FA and SAL + Diesel groups. F = 49.713; df = 1; **p < 0.001 compared with the SAL + FA and PPE + FA groups. F = 21.127; df = 1; #p < 0.001 compared with the PPE + FA and SAL + Diesel groups.
Fig 3
Fig 3. Histology photomicrographs.
A representative area is shown from the pulmonary parenchyma of the experimental groups for: Mean Linear Intercept (Lm) (A), the density of positive cells for Caspase-3 (B), the volume proportion of collagen (C), and the volume proportion of elastic fibers (D).
Fig 4
Fig 4. Protein quantification by ELISA for INF-γ (A), IL-4 (B), IL-10 (C) and IL-13 (D) is expressed as the mean ± SE (SAL + FA group: n = 10, PPE + FA group: n = 8, SAL + Diesel group: n = 9 and PPE + Diesel group: n = 8).
(A) There was no significant difference among the experimental groups. (B) F = 4.673; df = 1; *p = 0.038 compared with the SAL + FA and PPE + FA groups (SAL + FA group: n = 10, PPE + FA group: n = 9, SAL + Diesel group: n = 9 and PPE + Diesel group: n = 9). (C) F = 1.018; df = 1; *p = 0.032 compared with the SAL + FA and PPE + FA groups. F = 4.992; df = 1; #p < 0.004 compared with the PPE + FA and SAL + Diesel groups (SAL + FA group: n = 8, PPE + FA group: n = 10, SAL + Diesel group: n = 9 and PPE + Diesel group: n = 10). (D) F = 4.787; df = 1; *p = 0.036 compared with the SAL + FA and PPE + FA groups (SAL + FA group: n = 10, PPE + FA group: n = 8, SAL + Diesel group: n = 9 and PPE + Diesel group: n = 8).
Fig 5
Fig 5. Gene expression of Cxcl9 (A), Cxcl10 (B), Irf-5 (C), Irf-4 (D), and Arg-1 (E) are expressed as the mean ± SE (SAL + FA group: n = 9, PPE + FA group: n = 6, SAL + Diesel group: n = 11 and PPE + Diesel group: n = 6).
(A-C) No significant difference was observed among the experimental groups. (D) F = 5.251; df = 1; *p = 0.048 compared with the SAL + FA and SAL + Diesel groups (SAL + FA group: n = 9, PPE + FA group: n = 6, SAL + Diesel group: n = 11 and PPE + Diesel group: n = 6). (E) F = 9.348; df = 1; *p = 0.005 compared with the SAL + FA and PPE + FA groups. F = 10.401; df = 1; **p = 0.004 compared with the SAL + FA and SAL + Diesel groups. F = 1.218; df = 1; #p ≤ 0.009 compared with the PPE + FA and SAL + Diesel groups (SAL + FA group: n = 9, PPE + FA group: n = 6, SAL + Diesel group: n = 11 and PPE + Diesel group: n = 6).
Fig 6
Fig 6. Expression of TNF-α (A) and IL-10 (B) in alveolar macrophages analyzed by flow cytometry is expressed as the mean ± SE (SAL + FA group: n = 9, PPE + FA group: n = 6, SAL + Diesel group: n = 11 and PPE + Diesel group: n = 6).
No significant difference was observed among the experimental groups. (B) F = 9.056; df = 1; *p = 0.005 compared with the SAL + FA and SAL + Diesel groups. F = 6.201; df = 1; **p = 0.019 compared with the SAL + FA and PPE + FA groups. F = 1.220; df = 1; #p ≤ 0.031 compared with the PPE + FA and SAL + Diesel groups.

Similar articles

Cited by

References

    1. Dominici F, Peng RD, Bell ML, Pham L, McDermott A, Zeger SL, et al. (2006) Fine particulate air pollution and hospital admission for cardiovascular and respiratory diseases. JAMA 295: 1127–1134. 10.1001/jama.295.10.1127 - DOI - PMC - PubMed
    1. Pope CA, Hansen ML, Long RW, Nielsen KR, Eatough NL, Wilson WE, et al. (2003) Ambient Particulate Air Pollution, Heart Rate Variability, and Blood Markers of Inflammation in a Panel of Elderly Subjects. Environmental Health Perspectives 112: 339–345. - PMC - PubMed
    1. Pope CA 3rd, Burnett RT, Thurston GD, Thun MJ, Calle EE, et al. (2004) Cardiovascular mortality and long-term exposure to particulate air pollution: epidemiological evidence of general pathophysiological pathways of disease. Circulation 109: 71–77. 10.1161/01.CIR.0000108927.80044.7F - DOI - PubMed
    1. Brook RD, Franklin B, Cascio W, Hong Y, Howard G, Lipsett M, et al. (2004) Air pollution and cardiovascular disease: a statement for healthcare professionals from the Expert Panel on Population and Prevention Science of the American Heart Association. Circulation 109: 2655–2671. 10.1161/01.CIR.0000128587.30041.C8 - DOI - PubMed
    1. GOLD (2019) Global Initiative for Chronic Obstructive Lung Disease 2019 (GOLD 2019)—Global Strategy for the Diagnosis, Management and Prevention of COPD - PubMed

Publication types

LinkOut - more resources