. 2020 Feb 6;106(2):202-214.
doi: 10.1016/j.ajhg.2020.01.008. Epub 2020 Jan 30.

The Biology of Cell-free DNA Fragmentation and the Roles of DNASE1, DNASE1L3, and DFFB

Affiliations

The Biology of Cell-free DNA Fragmentation and the Roles of DNASE1, DNASE1L3, and DFFB

Diana S C Han et al. Am J Hum Genet. .

Abstract

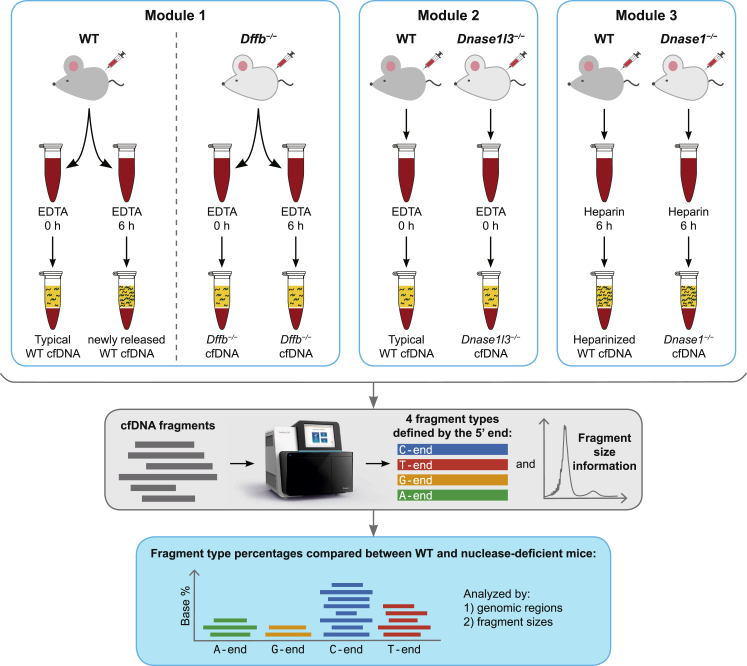
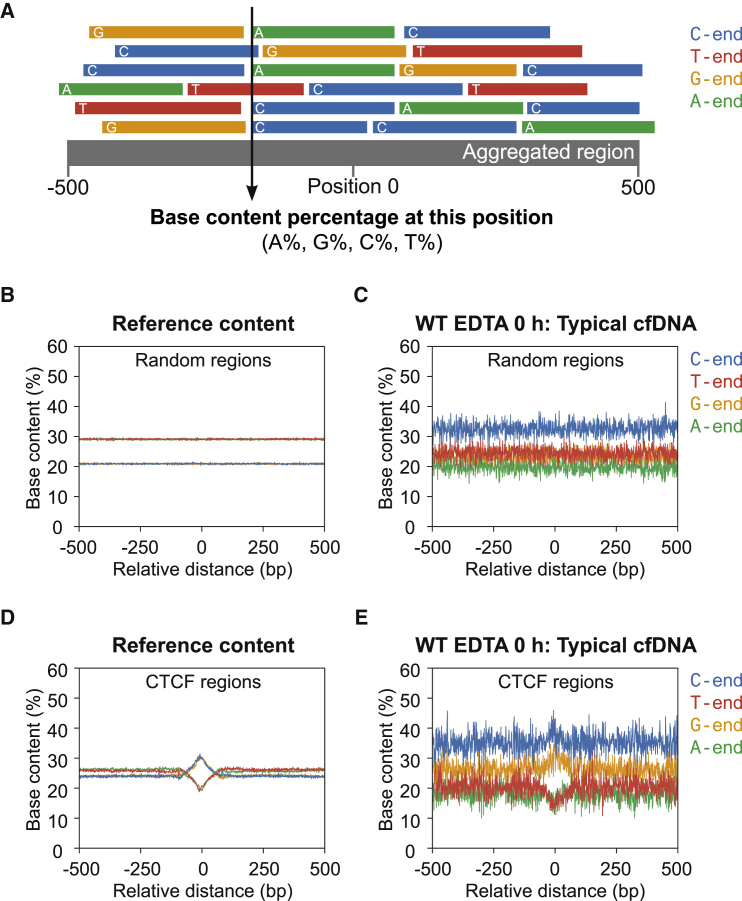
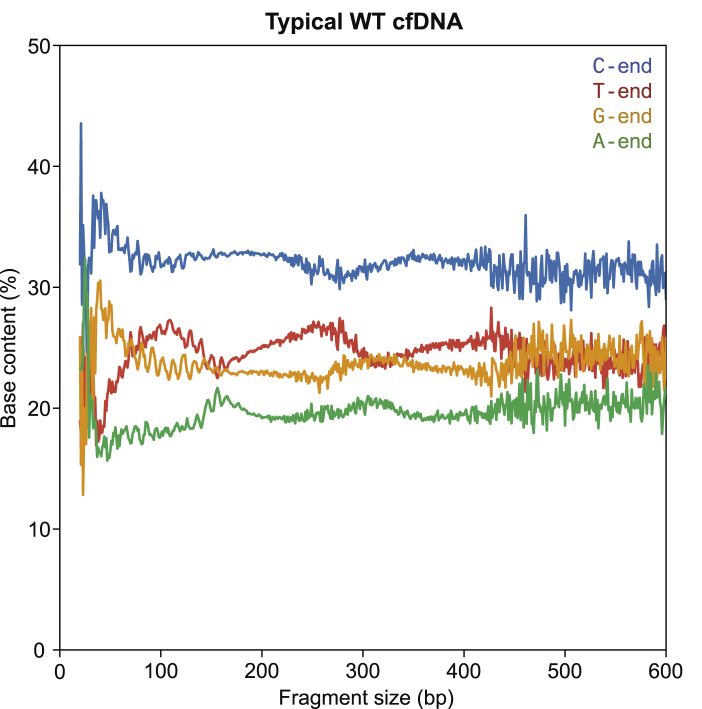
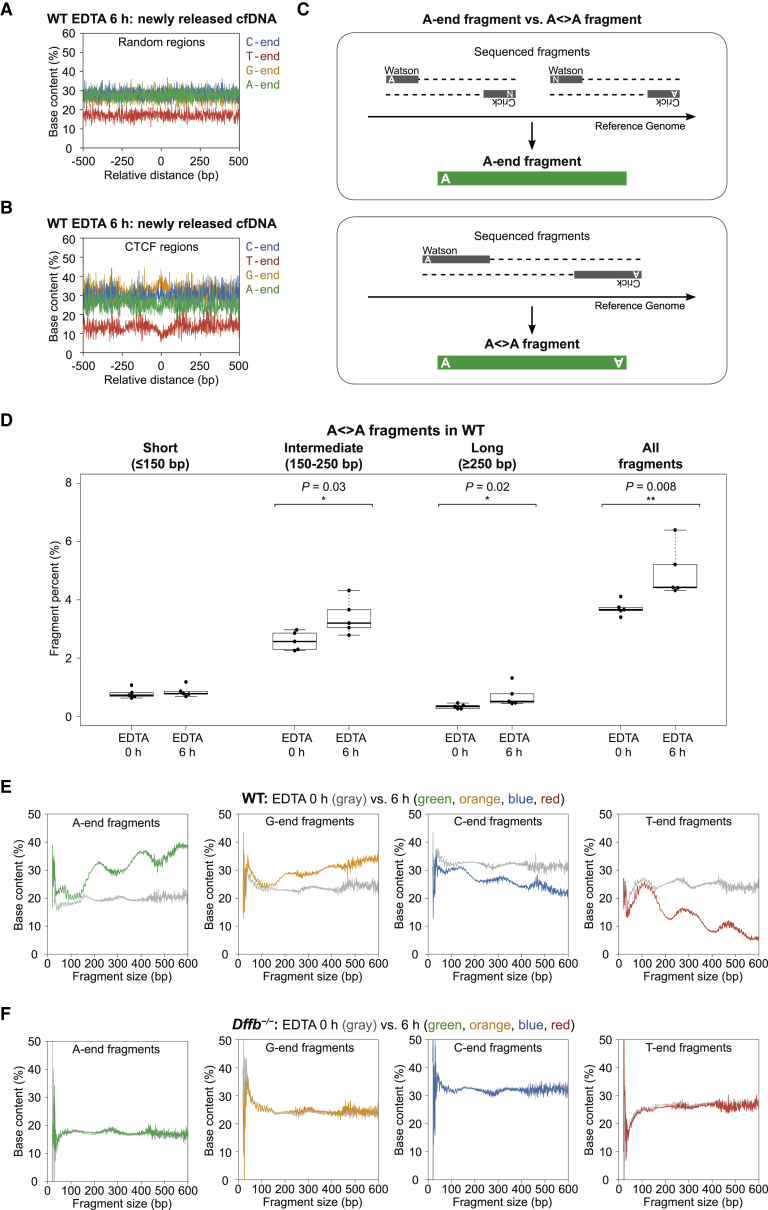
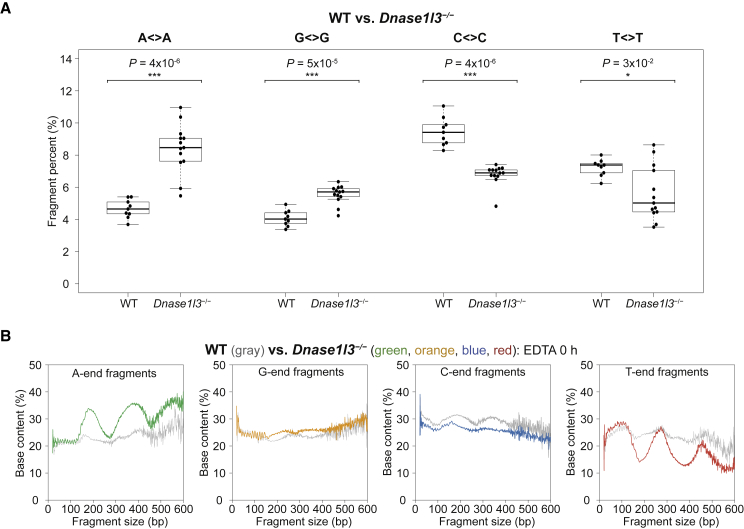
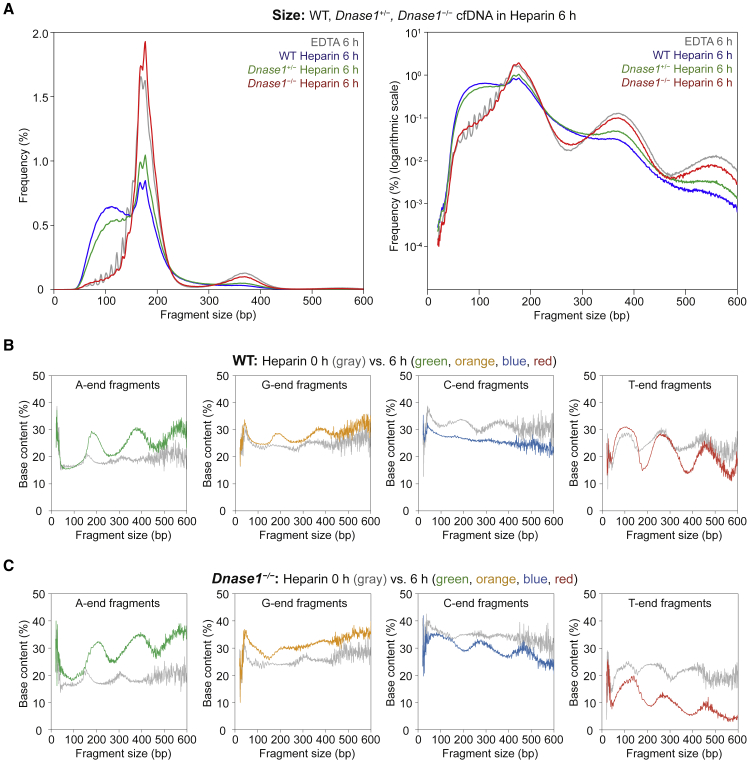
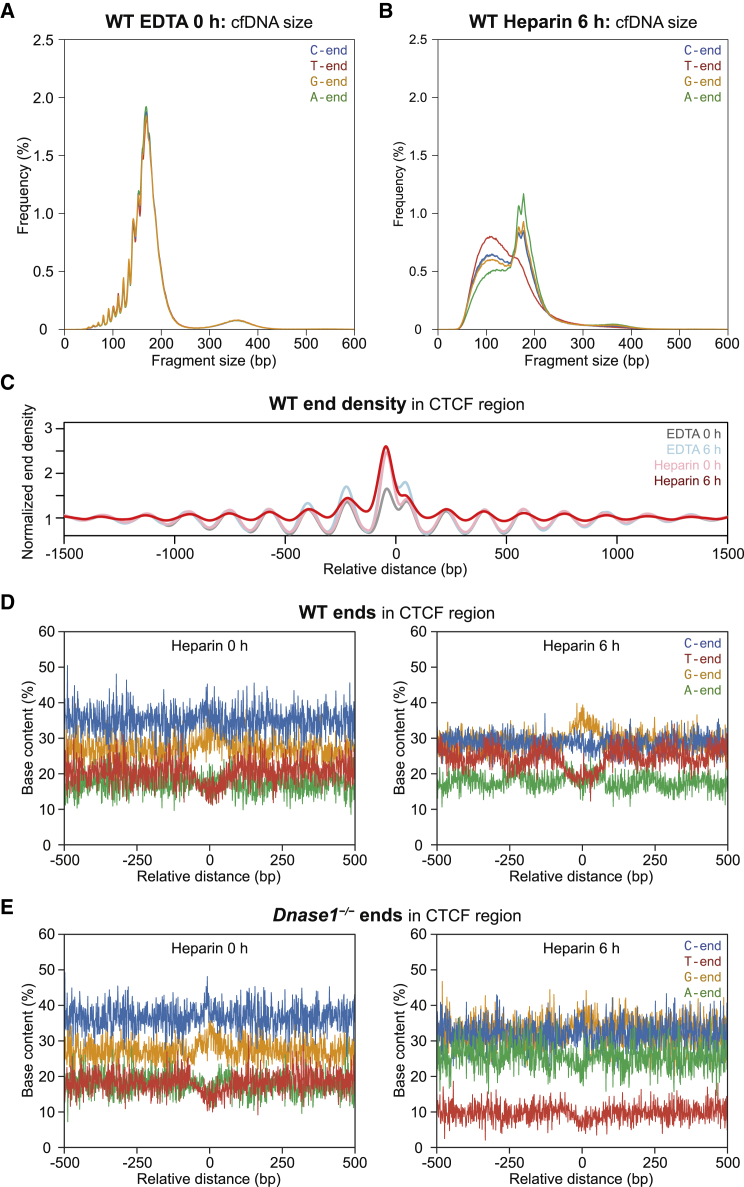
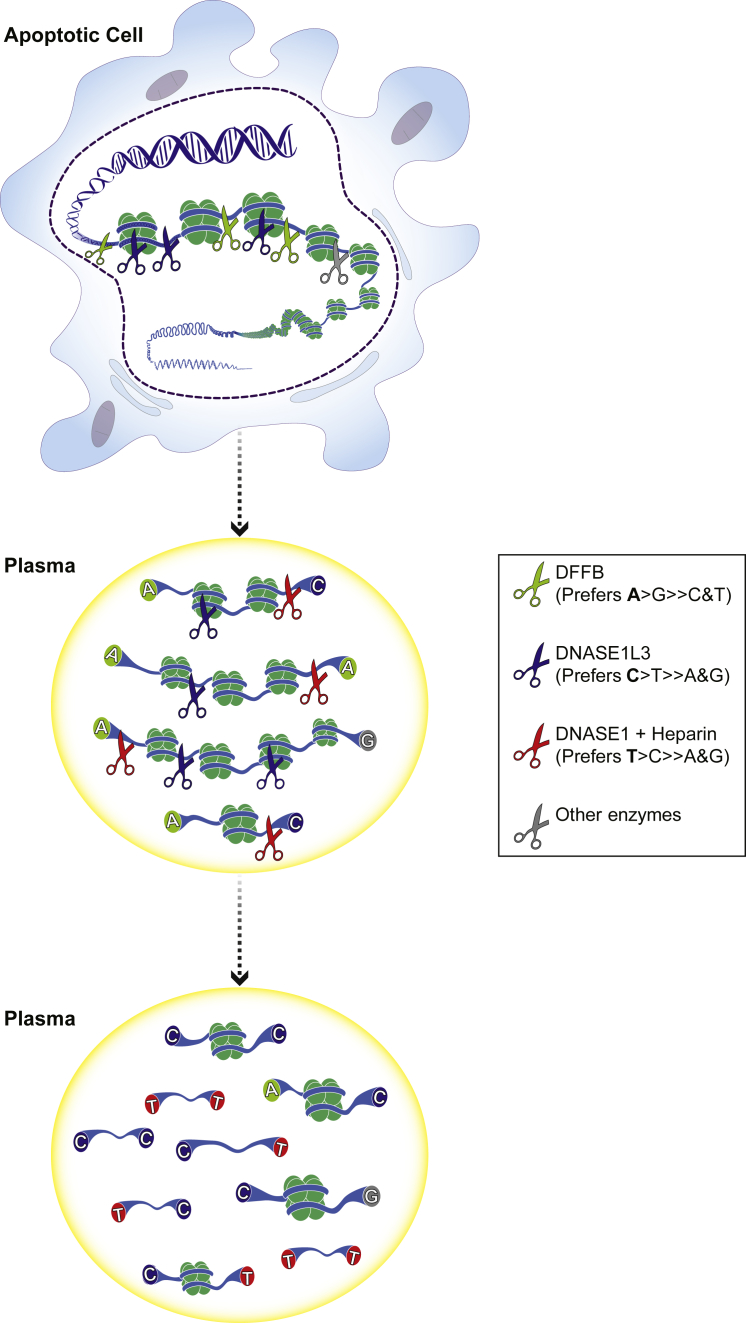
Cell-free DNA (cf.DNA) is a powerful noninvasive biomarker for cancer and prenatal testing, and it circulates in plasma as short fragments. To elucidate the biology of cf.DNA fragmentation, we explored the roles of deoxyribonuclease 1 (DNASE1), deoxyribonuclease 1 like 3 (DNASE1L3), and DNA fragmentation factor subunit beta (DFFB) with mice deficient in each of these nucleases. By analyzing the ends of cf.DNA fragments in each type of nuclease-deficient mice with those in wild-type mice, we show that each nuclease has a specific cutting preference that reveals the stepwise process of cf.DNA fragmentation. Essentially, we demonstrate that cf.DNA is generated first intracellularly with DFFB, intracellular DNASE1L3, and other nucleases. Then, cf.DNA fragmentation continues extracellularly with circulating DNASE1L3 and DNASE1. With the use of heparin to disrupt the nucleosomal structure, we also show that the 10 bp periodicity originates from the cutting of DNA within an intact nucleosomal structure. Altogether, this work establishes a model of cf.DNA fragmentation.

Keywords: DFFB; DNASE1; DNASE1L3; cf.DNA; cf.DNA biology; circulating nucleic acids; fragmentation; fragmentomics; liquid biopsy; nuclease.


Conflict of interest statement

D.S.C.H., M.N., R.W.K.C., and Y.M.D.L. have filed patent applications based on this work. Y.M.D.L. is a scientific co-founder and shareholder of Grail. Y.M.D.L. and R.W.K.C. are co-founders and shareholders of DRA Limited and Take2 Holdings Limited. Y.M.D.L. and R.W.K.C. are consultants to Grail. Y.M.D.L. is an advisor to Decheng Capital. R.W.K.C. is an advisor to Illumina. R.W.K.C. is a shareholder of Grail. Y.M.D.L. and R.W.K.C. receive royalties from Illumina, Sequenom, DRA, and Grail.

Figures

Figure 1
Figure 1
Overview of the Study Methods The data presented in this paper is divided into three modules, and each module uses cf.DNA data obtained from different nuclease-deficient mice (light gray mice) and their wild-type (WT) counterparts (dark gray mice). In module 1, blood from WT mice was subject to either 0 h or 6 h room temperature (RT) incubation in EDTA to yield typical or newly released cf.DNA, respectively. The same process was applied to blood from Dffb-deficient mice. In module 2, cf.DNA data from WT and Dnase1l3-deficient mice was analyzed. And lastly, in module 3, blood from WT and Dnase1-deficient mice underwent RT incubation in heparin for 0 h (not shown) and 6 h. The plasma cf.DNA from each condition was sequenced, and fragments were defined based on their size and the nucleotide at their 5′ end. We compared the percentages of each fragment type among the different genotypes in various genomic regions and fragment sizes in order to obtain insights into the effects of different nucleases on cf.DNA fragmentation.
Figure 2
Figure 2
C-End Preference in Typical Circulating cf.DNA in Different Regions (A) Schematic showing the calculation of the base content proportions at the 5′ end of cf.DNA fragments in an aggregated region. (B and D) The reference murine genomic content of random (B) and CCCTC-binding factor (CTCF) (D) regions. A-end and T-end fragment proportions overlap, and C-end and G-end fragment proportions overlap. (C and E) The base content proportions at the 5′ end of cf.DNA fragments of wild-type EDTA 0 h samples in random (C) and CTCF (E) regions. C and G are overrepresented and A and T are underrepresented at the 5′ ends of these typical cf.DNA fragments compared to the reference genomic content.
Figure 3
Figure 3
C-End Preference in Typical Circulating cf.DNA in All Fragment Sizes Base content proportions at the 5′ end of typical cf.DNA from wild-type EDTA 0 h samples across the range of fragment sizes.
Figure 4
Figure 4
Fragmentation Pattern in Newly Released cf.DNA in Wild-type (WT) and Dffb-deficient Mice (A and B) Base content proportions of WT EDTA 6 h samples enriched with newly released cf.DNA in random (A) and CTCF regions (B). With newly released cf.DNA enrichment, A-end and G-end fragments increased, and C-end and T-end fragments decreased compared to the baseline base proportions in typical cf.DNA. (C) A-end fragments versus A< > A fragments. A-end fragments are comprised of the fragments in which either the Watson or Crick strand starts with A. A< > A fragments are comprised of fragments in which both Watson and Crick strands start with A. (D) A< > A fragment proportions compared between baseline cf.DNA (EDTA 0 h) and samples enriched with newly released cf.DNA (EDTA 6 h) in WT mice among short, intermediate, and long fragments. 6 h samples enriched with newly released cf.DNA have a significantly higher proportion of A< > A fragments in long fragment sizes >150 bp. p value calculated by Mann-Whitney U test. (E) Percentages of cf.DNA with A-ends (green), G-ends (orange), C-ends (blue), and T-ends (red) in a WT EDTA 6 h sample enriched with newly released cf.DNA compared with the baseline representation in the EDTA 0 h sample (gray). A-end fragments and, to a lesser extent, G-end fragments have peaks ~200 bp and 400 bp. (F) Percentages of cf.DNA with A-ends (green), G-ends (orange), C-ends (blue), and T-ends (red) in a Dffb-deficient EDTA 6 h sample compared to its baseline representation in the EDTA 0 h sample (gray). No increase in A-end fragments was observed.
Figure 5
Figure 5
Effect of DNASE1L3 on Typical cf.DNA (A) A< > A, G< > G, C< > C, and T< > T fragment percentages in wild-type (WT) versus Dnase1l3-deficient mice, both from EDTA 0 h samples. p value calculated by Mann-Whitney U test. (B) Percentages of A-ends (green), G-ends (orange), C-ends (blue), and T-ends (red) in Dnase1l3-deficient EDTA 0 h cf.DNA compared with the percentages in WT EDTA 0 h cf.DNA (gray).
Figure 6
Figure 6
Effect of DNASE1 on cf.DNA (with heparin) (A) cf.DNA size profiles in wild-type (WT) (blue), Dnase1+/ (green), and Dnase1−/− (red) mice in heparin 6 h samples. Normal y axis scale (left) and logarithmic y axis scale (right). (B) Percentages of A-ends (green), G-ends (orange), C-ends (blue), and T-ends (red) of WT heparin 6 h samples compared to its baseline representation in heparin 0 h samples (gray). (C) Percentages of A-ends (green), G-ends (orange), C-ends (blue), and T-ends (red) in heparin 6 h cf.DNA of Dnase1−/− mice compared to its baseline representation in heparin 0 h (gray).
Figure 7
Figure 7
10 bp Periodicity Originates from Fragments Cut from Nucleosomes (A) cf.DNA size profile of A-end, G-end, C-end, and T-end fragments in an EDTA 0 h wild-type (WT) sample. (B) cf.DNA size profile of A-end, G-end, C-end, and T-end fragments in a heparin 6 h WT sample. (C) Fragment end density in the CCCTC-binding factor (CTCF) region in the heparin 6 h sample (red) compared to the baseline samples: EDTA 0 h (gray), EDTA 6 h (light blue), and heparin 0 h (pink). (D and E) The 5′ end base content proportions in the CTCF region of heparin 0 h (left) and 6 h (right) samples of WT (D) and Dnase1−/− (E) mice.
Figure 8
Figure 8
Model of cf.DNA Fragmentation DFFB, DNASE1L3 and other intracellular enzymes form newly released cf.DNA that is A-end enriched. In plasma, DNASE1L3 generates the predominantly C-end enriched cf.DNA seen in the typical profile via its extracellular activity. DNASE1 with the help of heparin and endogenous proteases(?) can further digest cf.DNA into T-end fragments in plasma.

References

    1. Lo Y.M.D., Corbetta N., Chamberlain P.F., Rai V., Sargent I.L., Redman C.W.G., Wainscoat J.S. Presence of fetal DNA in maternal plasma and serum. Lancet. 1997;350:485–487. - PubMed
    1. Chiu R.W.K., Chan K.C.A., Gao Y., Lau V.Y.M., Zheng W., Leung T.Y., Foo C.H.F., Xie B., Tsui N.B.Y., Lun F.M.F. Noninvasive prenatal diagnosis of fetal chromosomal aneuploidy by massively parallel genomic sequencing of DNA in maternal plasma. Proc. Natl. Acad. Sci. USA. 2008;105:20458–20463. - PMC - PubMed
    1. Chan K.C.A., Woo J.K.S., King A., Zee B.C.Y., Lam W.K.J., Chan S.L. Analysis of plasma Epstein-Barr virus DNA to screen for nasopharyngeal cancer. N. Engl. J. Med. 2017;377:513–522. - PubMed
    1. Sun K., Jiang P., Cheng S.H., Cheng T.H.T., Wong J., Wong V.W.S., Ng S.S.M., Ma B.B.Y., Leung T.Y., Chan S.L. Orientation-aware plasma cell-free DNA fragmentation analysis in open chromatin regions informs tissue of origin. Genome Res. 2019;29:418–427. - PMC - PubMed
    1. Snyder M.W., Kircher M., Hill A.J., Daza R.M., Shendure J. Cell-free DNA comprises an in vivo nucleosome footprint that informs its tissues-of-origin. Cell. 2016;164:57–68. - PMC - PubMed

Publication types

LinkOut - more resources