. 2020 Feb 24;30(4):573-588.e7.
doi: 10.1016/j.cub.2019.12.015. Epub 2020 Jan 30.

Chromatin Organization in Early Land Plants Reveals an Ancestral Association between H3K27me3, Transposons, and Constitutive Heterochromatin

Affiliations

Chromatin Organization in Early Land Plants Reveals an Ancestral Association between H3K27me3, Transposons, and Constitutive Heterochromatin

Sean A Montgomery et al. Curr Biol. .

Abstract

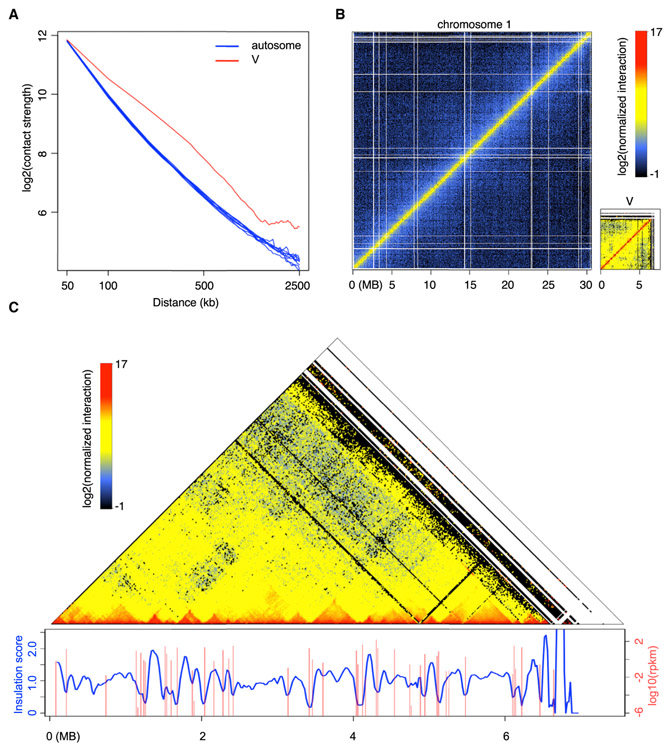
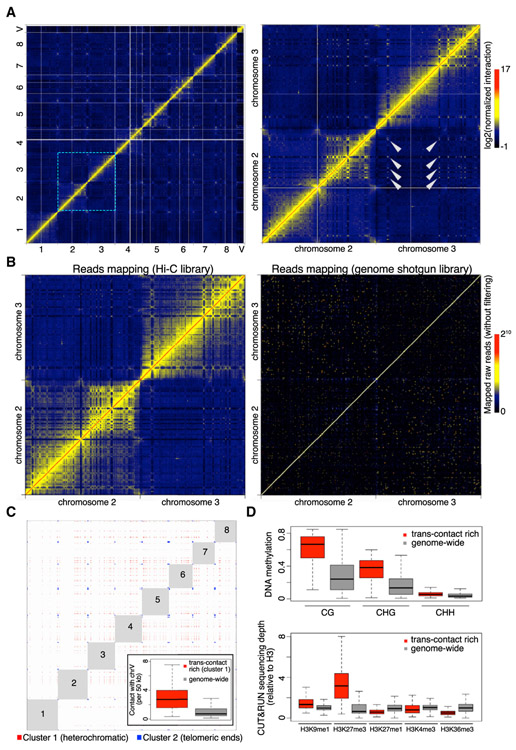
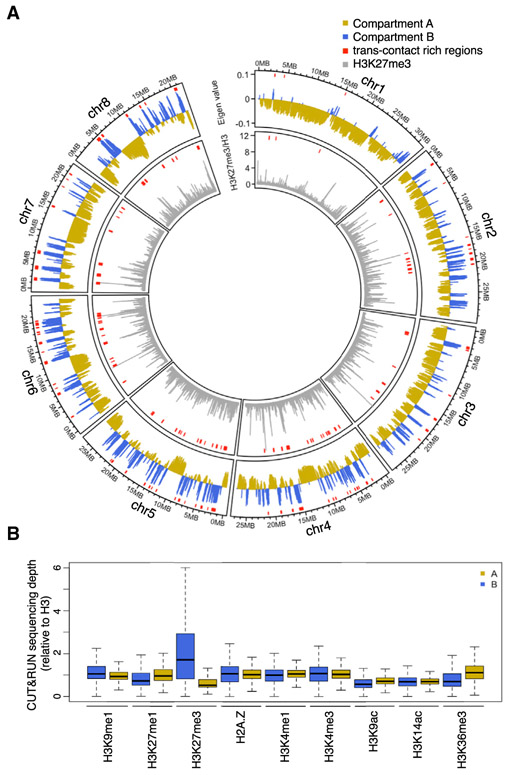
Genome packaging by nucleosomes is a hallmark of eukaryotes. Histones and the pathways that deposit, remove, and read histone modifications are deeply conserved. Yet, we lack information regarding chromatin landscapes in extant representatives of ancestors of the main groups of eukaryotes, and our knowledge of the evolution of chromatin-related processes is limited. We used the bryophyte Marchantia polymorpha, which diverged from vascular plants circa 400 mya, to obtain a whole chromosome genome assembly and explore the chromatin landscape and three-dimensional genome organization in an early diverging land plant lineage. Based on genomic profiles of ten chromatin marks, we conclude that the relationship between active marks and gene expression is conserved across land plants. In contrast, we observed distinctive features of transposons and other repetitive sequences in Marchantia compared with flowering plants. Silenced transposons and repeats did not accumulate around centromeres. Although a large fraction of constitutive heterochromatin was marked by H3K9 methylation as in flowering plants, a significant proportion of transposons were marked by H3K27me3, which is otherwise dedicated to the transcriptional repression of protein-coding genes in flowering plants. Chromatin compartmentalization analyses of Hi-C data revealed that repressed B compartments were densely decorated with H3K27me3 but not H3K9 or DNA methylation as reported in flowering plants. We conclude that, in early plants, H3K27me3 played an essential role in heterochromatin function, suggesting an ancestral role of this mark in transposon silencing.

Keywords: H3K27me3; Marchantia; bryophytes; chromatin; evolution; genome; sex chromosome; transposon.


Conflict of interest statement

Declaration of Interests The authors declare no competing interests.

Figures

Figure 1.
Figure 1.. Distribution Patterns of Centromeric Repeats and Telomeres in Marchantia
(A) Distribution of centromeric repeats in Tak-1 nuclei isolated from vegetative thalli. (B) Confirmation of telomere probes’ specificity by using chromosome spread. Probes labeled with digoxigenin were hybridized with Tak-1 chromosome spread. (C) Distribution of telomeres in Tak-1 nuclei isolated from vegetative thalli. See also Figures S3 and S4.
Figure 2.
Figure 2.. Distribution of Chromatin Marks in the Marchantia Genome
(A) Coverage of chromatin marks across chromosome 5. Reads were normalized to 1 × coverage and binned into 100-kbp windows along the chromosome and a smoothed spline was fit to the data. Position of the putative centromere is indicated at the top. (B) Circos plot of euchromatic marks and genes. Each band shows the density of annotated chromatin mark peaks per chromosome, relative to the greatest density per band. (C) Distribution of chromatin marks over genomic features. The total length of chromatin mark peaks overlapping specified genomic features was divided by the total length of peaks of chromatin marks to determine each proportion. Unknown represents repeats annotated as unknown by RepeatMasker. Simple repeats are not shown as they cover less than 0.3% of chromatin mark peaks. (D) Integrative Genomics Viewer (IGV) browser screenshot demonstrating flanking of genes by H3K9me1 and H3K27me1 marked transposons. The region shown is 26 kb in length and from the proximal arm of chromosome 1. Chromatin mark tracks are bigwig files scaled to 1 × genomic coverage in 10-bp windows. “Repeat” and “Gene” tracks are annotation files for repeats and genes, respectively. “RNA-seq” track is a bigwig of mapped RNA-seq reads from thallus tissue [33]. Scales are noted in square brackets beside each track. (E) IGV browser screenshot demonstrating large H3K27me3 islands covering both genes and transposons. The region shown is 102 kb in length and from the distal arm of chromosome 1. Chromatin mark tracks are bigwig files scaled to 1 × genomic coverage in 10-bp windows. “Repeat” and “Gene” tracks are annotation files for repeats and genes, respectively. “RNA-seq” track is a bigwig of mapped RNA-seq reads from thallus tissue [33]. Scales are noted in square brackets beside each track. See also Figure S5.
Figure 3.
Figure 3.. Association of Chromatin Marks with Genes
(A) Expression level of genes associated with profiled chromatin marks. Width is relative to the density of genes. Red dots indicate median expression values. (B) Heatmap of k-means clustering of genes based on chromatin marks. Prevalence of each mark (columns) based on its score of normalized 1 × genomic coverage per 10 bp ± 1 kb around the transcription start site per gene, with red for enrichment and blue for depletion. Each row corresponds to one gene, with multiple genes grouped into blocks that have been defined as gene clusters 1 through 5. (C) Expression level of genes per gene cluster. Width is relative to the density of genes. Red dots indicate median expression values. See also Figures S5 and S6.
Figure 4.
Figure 4.. Association of Chromatin Marks with Transposons
(A) Proportion of total repetitive elements belonging to major transposon superfamilies. Total counts of each transposon superfamily can be found in Data S2. (B) Distribution of transposons across a representative chromosome from Marchantia polymorpha, Physcomitrella patens, and Arabidopsis thaliana. The number of repeats occurring in 100-kbp bins across each chromosome are shown. (C) Circos plot of heterochromatic marks, the four most abundant transposon superfamilies in Marchantia and all repeats. Each band shows the density of annotated repetitive elements or chromatin mark peaks per chromosome, relative to the greatest density per band. (D) Heatmap of k-means clustering of transposons based on chromatin marks. Prevalence of each mark (columns) based on its score of normalized 1 × genomic coverage per 10 bp ± 1 kb around the transcription start site per gene, with red for enrichment and blue for depletion. Each row corresponds to one transposon, with multiple transposons grouped into blocks that have been defined as repeat clusters 1 through 5. (E) Boxplot of distances between each transposon and the nearest gene per gene cluster. Briefly each transposon is compared to all genes belonging to a gene cluster to find its nearest neighbor. Transposons are divided based on the repeat cluster they belong to. Distances are in kilobases (kbp). Colored boxes represent interquartile range, and lines represent median values. Outliers are not shown. See also Figures S5 and S7 and Data S2.
Figure 5.
Figure 5.. Marchantia Chromosome V Has Distinct Chromatin Packing Patterns Compared with Autosomes
(A) Comparison of interaction decay exponents among autosomes and V chromosome. The average interaction strengths of each chromosome at various distances were calculated based on a whole-genome Hi-C map normalized at 50 kb resolution. (B) Hi-C maps of Tak-1 chromosome 1 and chromosome V. (C) Association between V chromosome Hi-C map (normalized at 20 kb resolution) and local gene expression. Insulation scores were calculated according to [38] with minor modifications, in which a sliding square of 100 kb × 100 kb along the matrix diagonal was used, and the ratio of observed over expected interaction strengths of this sliding square was plotted as insulation score. Genomic regions with local minima of insulation scores have strong chromatin insulation. Data of gene expression in Tak-1 thalli were from [10]. See also Figure S2.
Figure 6.
Figure 6.. Marchantia Genome Shows Extensive Inter-chromosomal Interactions
(A) Normalized Hi-C map at 50 kb resolution. The right panel shows the zoom-in image of an area containing chromosomes 2 and 3, in which selected trans-contacts among interstitial regions in different chromosomes are highlighted with arrowheads. (B) Comparison of chromatin interaction maps (50-kb bin) generated with comparable amounts of mapped reads in Hi-C and genome shotgun libraries (110 versus 130 million), respectively. The pair-end genome shotgun library is a combination of SRA: SRR396657 and SRR396658 [10] and was mapped to the assembled TAK-1 genome as Hi-C reads. Note that the diagonal of the plot shown on the right has values larger than the maximum defined in the color bar. (C) Genomic regions showing strong and extensive trans-interactions. Bins having at least one top 0.5% inter-chromosomal contacts in the normalized Hi-C map shown in (A) were subjected to k-means clustering based on their genome-wide inter-chromosomal contact patterns. The optimal number of clusters was determined as 3 based on the Elbow method. For the first two clusters, virtual interactions among members of each cluster are shown as red and blue dots, respectively, representing an ideal situation in which all possible contacts happen within each cluster and are visible on a Hi-C map. Numbers depict autosome names. The inset shows inter-chromosomal contacts between autosomes and the V chromosome. (D) DNA methylation (top panel) and histone modifications (bottom panel) in genomic regions annotated as “cluster 1” in (C) and the whole genome (V chromosome not included). The DNA methylation data of Tak-1 thalli was from [32]. See also Data S3 and Table S1.
Figure 7.
Figure 7.. A/B Compartments and Their Associated Epigenetic Marks
(A) A/B compartments and H3K27me3 chromatin marks in individual Tak-1 autosomes plotted in 50-kb windows. For each autosome, the compartment bearing the estimated centromere is labeled as “Compartment B.” Red segments shown on top of each track denote trans-contact rich regions that display strong inter-chromosomal interactions. (B) Epigenetic features associated with A/B compartments.

Comment in

References

    1. Talbert PB, Ahmad K, Almouzni G, Ausió J, Berger F, Bhalla PL, Bonner WM, Cande WZ, Chadwick BP, Chan SW, et al. (2012). A unified phylogeny-based nomenclature for histone variants. Epigenetics Chromatin 5, 7. - PMC - PubMed
    1. Talbert PB, Meers MP, and Henikoff S (2019). Old cogs, new tricks: the evolution of gene expression in a chromatin context. Nat. Rev. Genet 20, 283–297. - PubMed
    1. Kouzarides T (2007). Chromatin modifications and their function. Cell 128, 693–705. - PubMed
    1. Sequeira-Mendes J, Aragüez I, Peiró R, Mendez-Giraldez R, Zhang X, Jacobsen SE, Bastolla U, and Gutierrez C (2014). The Functional Topography of the Arabidopsis Genome Is Organized in a Reduced Number of Linear Motifs of Chromatin States. Plant Cell 26, 2351–2366. - PMC - PubMed
    1. Lieberman-Aiden E, van Berkum NL, Williams L, Imakaev M, Ragoczy T, Telling A, Amit I, Lajoie BR, Sabo PJ, Dorschner MO, et al. (2009). Comprehensive mapping of long-range interactions reveals folding principles of the human genome. Science 326, 289–293. - PMC - PubMed

Publication types

MeSH terms

LinkOut - more resources