. 2020 Feb 6;180(3):454-470.e18.
doi: 10.1016/j.cell.2020.01.006. Epub 2020 Jan 30.

Host-Specific Evolutionary and Transmission Dynamics Shape the Functional Diversification of Staphylococcus epidermidis in Human Skin

Affiliations

Host-Specific Evolutionary and Transmission Dynamics Shape the Functional Diversification of Staphylococcus epidermidis in Human Skin

Wei Zhou et al. Cell. .

Abstract

Metagenomic inferences of bacterial strain diversity and infectious disease transmission studies largely assume a dominant, within-individual haplotype. We hypothesize that within-individual bacterial population diversity is critical for homeostasis of a healthy microbiome and infection risk. We characterized the evolutionary trajectory and functional distribution of Staphylococcus epidermidis-a keystone skin microbe and opportunistic pathogen. Analyzing 1,482 S. epidermidis genomes from 5 healthy individuals, we found that skin S. epidermidis isolates coalesce into multiple founder lineages rather than a single colonizer. Transmission events, natural selection, and pervasive horizontal gene transfer result in population admixture within skin sites and dissemination of antibiotic resistance genes within-individual. We provide experimental evidence for how admixture can modulate virulence and metabolism. Leveraging data on the contextual microbiome, we assess how interspecies interactions can shape genetic diversity and mobile gene elements. Our study provides insights into how within-individual evolution of human skin microbes shapes their functional diversification.

Keywords: Staphylococcus epidermidis; genomic variation; metagenomics; microevolution; skin microbiome; strain diversity.


Conflict of interest statement

Declaration of Interests The authors declare no competing interests.

Figures
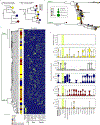
Figure 1.
Figure 1.
Phylogenetic variation of the individualized S. epidermidis isolates. A, two alternative scenarios of within-individual evolution. Each circle represents a cluster of isolates diverged from a single founder lineage colonizing a given host. In the first scenario (left), all isolates from a given host diverged from a single founder lineage; in the second scenario (right), isolates from each host diverged from multiple distinct founder lineages. B, core-genome phylogeny (midpoint rooted) based on 58498 core-genome SNP loci for the 1482 isolates sampled in this study and 50 previously sequenced isolates from multiple diseased and healthy individuals. Skin site of each isolate is indicated in green. C, individualized S. epidermidis isolates evolved from multiple founder lineages. Each founder lineage is represented by a circle and is defined as the highest node from which at least 95% of the derived isolates (i.e. tip nodes) were either found in the same subject or public strains. The size of the circle represents the number of isolates derived from that lineage. D, pairwise cophenetic distances of the 1482 isolates. Note that the distribution of ‘between-subject’ distances depends on the sample size per subject, with p0, who had the most isolates cultivated, having the largest contribution. The toeweb is highlighted to illustrate its unusual between-subject similarity.
Figure 2.
Figure 2.
Subject-specific transmission patterns of S. epidermidis isolates. A, proportion of sister isolates shared between two skin sites. B, transmission map summarizing the BEAST analysis. Colors of the lines connecting skin sites show the posterior probability that the transmission rate between the two sites was not 0. Lines with posterior probabilities < 0.3 were removed for better visualization. See also Figure S2.
Figure 3.
Figure 3.
Gene content diversity of the subject isolates. A, gene accumulation curves for the subject-specific pan-genomes (5476–6436 gene clusters) and core-genomes (954–1325 gene clusters), or that of the 50 public isolates, as a function of the number of sequenced isolates. Error bars show the standard deviation for 10 simulations. B, shared vs. unique subject-specific pan- and core-genes in the subject isolates and public strains. C, diversity of the subject isolates based on presence and absence of accessory genes. Leaf nodes are colored by the skin site of origin; the background color indicates the subject. A cluster containing toeweb isolates from all five subjects is highlighted in purple. D, the distribution of S. epidermidis genes in p0 with respect to their variability across skin sites (see Figure S3D for other subjects). An example cluster of genes with high variability is highlighted with a red box (boundaries arbitrarily selected), and their prevalence shown in the heatmap. Each row in the heatmap represents a unique S. epidermidis gene, and the row and column hierarchical clusters were generated based on Euclidean distances. E, the COG functional categories of representative toeweb genes (i.e. present in >40% of the toeweb isolates but <10% in any of the other skin sites, n=28). See also Figure S3 and Table S3.
Figure 4.
Figure 4.
Diversification of sister isolates driven by potential HGT events. A, gene content heterogeneity – the proportion of genes that are only found in one isolate of a pair of isolates – as a function of pairwise core-genome nucleotide differences. For visualization, the plot includes only 10000 randomly sampled data points. Gene content heterogeneity between sister isolates are highlighted with a blue box. B, functional annotation of the differential genes. All differential genes were mapped to KEGG orthologs (the annotations of the KEGG orthologs were shown when available) and their prevalence within sister isolate groups is shown. The p-value shows the probability of observing the differential prevalence solely due to genome incompleteness. The error bars show the standard deviation across sister isolate groups. C, presence of differential genes in the 20 unique mobile-element-like contigs identified using PlasFlow. The heatmap shows the fraction of nucleotides in the mobile-element-like contigs that was aligned to the 25 chromosome-like contigs identified containing differential genes. The error bars show the standard deviation across sister isolate groups. Two predicted phage sequences (nearly 100% alignment over contig length) are indicated by arrows. D, gene content of the predicted phage sequences indicated in Figure 4C. Note that the sequences are visualized in a circular layout but are not necessarily circular DNAs. See also Figure S4 and Table S4.
Figure 5.
Figure 5.
ABR genes encoded by predicted S. epidermidis plasmids. A, prevalence of predicted plasmid segments (i.e., the proportion of isolates carrying the predicted plasmid segments) across subjects and skin sites. The row and column hierarchical clusters were generated based on Euclidean distances. This panel is related to Figure S5B, which uses a different plasmid prediction method. B, prevalence of predicted plasmid-encoded ABR. The heatmap shows the number of predicted plasmid segments that conferred resistance to both the row and the column antibiotics. C, host-specific distribution of predicted MDR plasmid segments. The ABR genes (and the respective antibiotics they confer resistance to) encoded by two predicted MDR plasmid segments are shown. Note that sequences are visualized in a circular layout but were not gap-closed. D, MIC50 and MIC90 of selected antibiotics and their association with predicted plasmid-encoded ABR genes. Two isolates (0995 and 1085) that conferred resistance to all six tested antibiotics were indicated by purple arrows. See also Figure S5 and Table S5.
Figure 6.
Figure 6.
Variability at the agr locus and variation in predicted virulence expression. A, novel sequence types of the agrABCD operon and prevalence across the relevant subjects and skin sites. Amino acid sequences of the two novel agrD genes, verified with Pacbio sequencing, are shown. B, quorum sensing interference of agr Type I-III isolates by Type IV supernatant. ddCt values were obtained by subtracting dCT values measured at zero hours from dCT values measured at four hours. *: Welch’s t-test on ddCt values p < .05. **: Welch’s t-test on ddCt values p < 0.01. At least 3 biological replicates were performed for each experiment. C, quorum sensing interference of an agr Type IV isolate by Type I-III supernatant, as in B. D, distribution and dominance type frequency of the three canonical agr types (Type I-III) across subjects and skin sites. E, quorum sensing interference of agr Type I-III isolates by population supernatant generated by mixed cultures, as in B. F, S. epidermidis operons showing significantly lower expression levels with the presence of population supernatant.*: Welch’s t-test on ddCt values p < .05. **: Welch’s t-test on ddCt values p < 0.01. See also Figure S6 and Table S6.
Figure 7.
Figure 7.
Association of S. epidermidis gene prevalence with contextual environment. A, S. epidermidis genes whose prevalences were significantly associated with at least one of the principal components that described microbiome composition. B, function and plasmid association of the microbiome-dependent S. epidermidis genes. The COG functional categories (upper) of the top 20 genes that had the greatest increase in predictability when including skin site specification or microbiome features are shown, as well as their presence in predicted (via PlasFlow) and known (via PLSDB) plasmids (lower). See also Figure S7 and Table S7.

Similar articles

Cited by

References

    1. Altschul SF, Gish W, Miller W, Myers EW, and Lipman DJ (1990). Basic local alignment search tool. J. Mol. Biol 215, 403–410. - PubMed
    1. Archer GL, and Johnston JL (1983). Self-transmissible plasmids in staphylococci that encode resistance to aminoglycosides. Antimicrob. Agents and Chemother 24, 70–77. - PMC - PubMed
    1. Arndt D, Grant JR, Marcu A, Sajed T, Pon A, Liang Y, and Wishart DS (2016). PHASTER: a better, faster version of the PHAST phage search tool. Nucleic Acids Res. 44, W16–21. - PMC - PubMed
    1. Asnicar F, Manara S, Zolfo M, Truong DT, Scholz M, Armanini F, Ferretti P, Gorfer V, Pedrotti A, Tett A, et al. (2017). Studying Vertical Microbiome Transmission from Mothers to Infants by Strain-Level Metagenomic Profiling. MSystems 2, e00164–16. - PMC - PubMed
    1. Bankevich A, Nurk S, Antipov D, Gurevich AA, Dvorkin M, Kulikov AS, Lesin VM, Nikolenko SI, Pham S, Prjibelski AD, et al. (2012). SPAdes: A New Genome Assembly Algorithm and Its Applications to Single-Cell Sequencing. J. Comput. Biol 19, 455–477. - PMC - PubMed

Publication types

MeSH terms

LinkOut - more resources