. 2020 Feb 6;180(3):471-489.e22.
doi: 10.1016/j.cell.2020.01.010. Epub 2020 Jan 30.

Restriction of HIV-1 Escape by a Highly Broad and Potent Neutralizing Antibody

Affiliations

Restriction of HIV-1 Escape by a Highly Broad and Potent Neutralizing Antibody

Philipp Schommers et al. Cell. .

Abstract

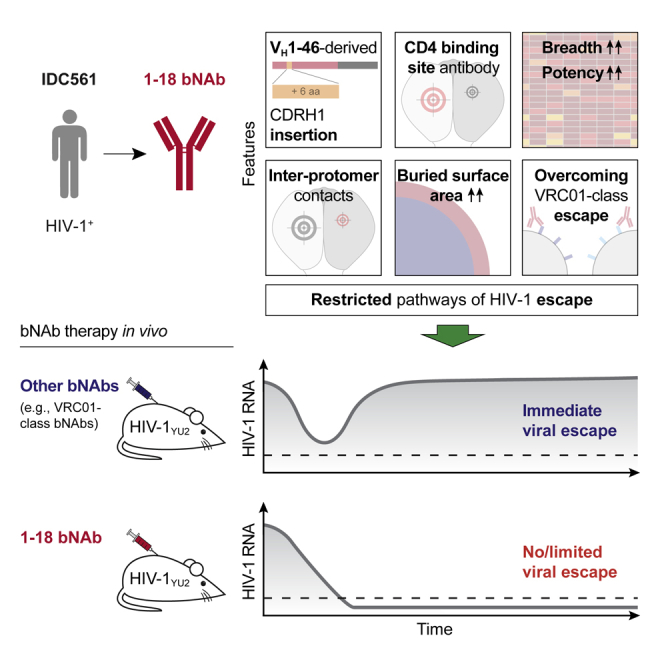
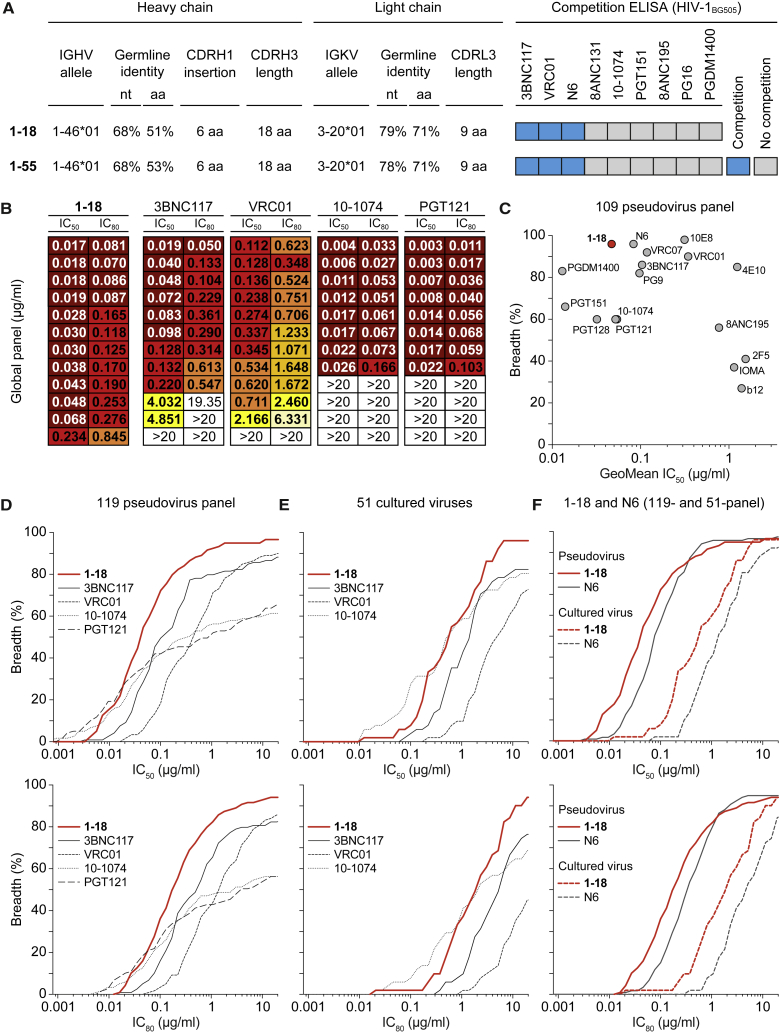
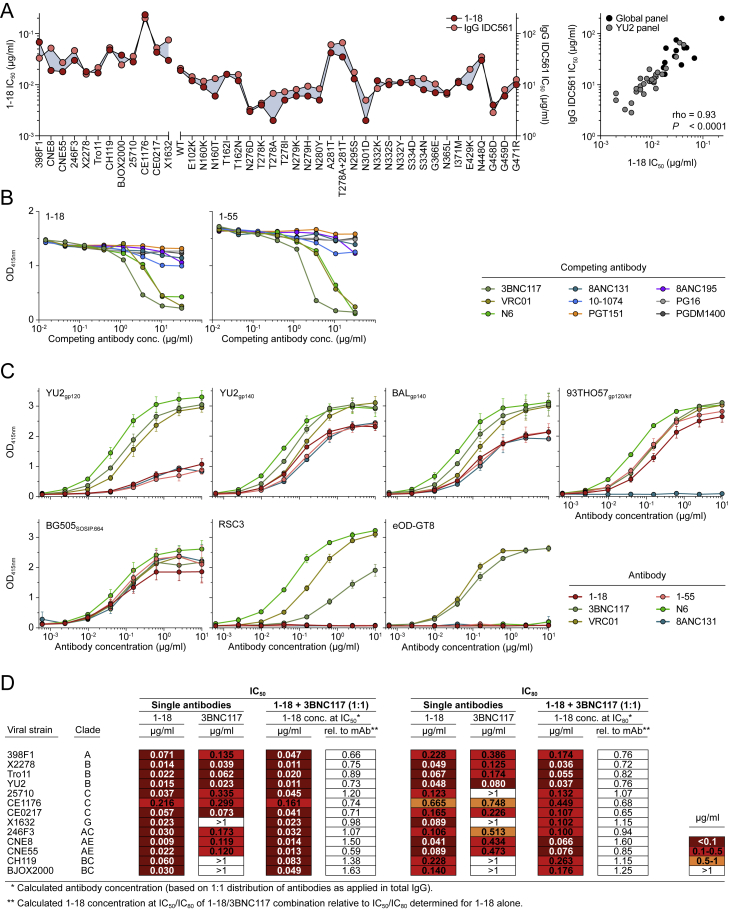
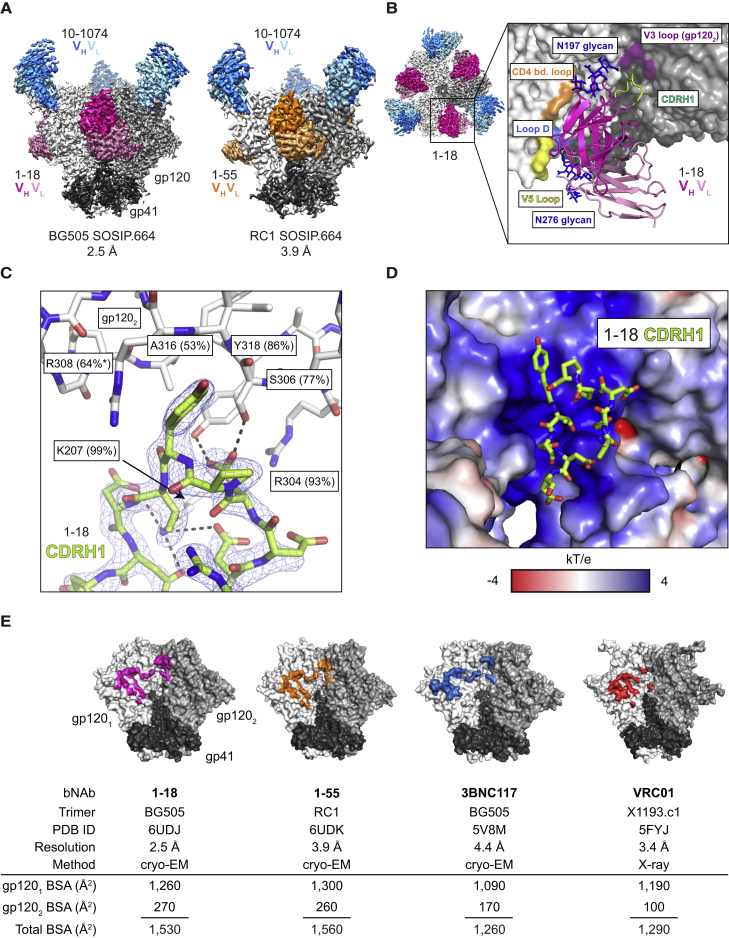
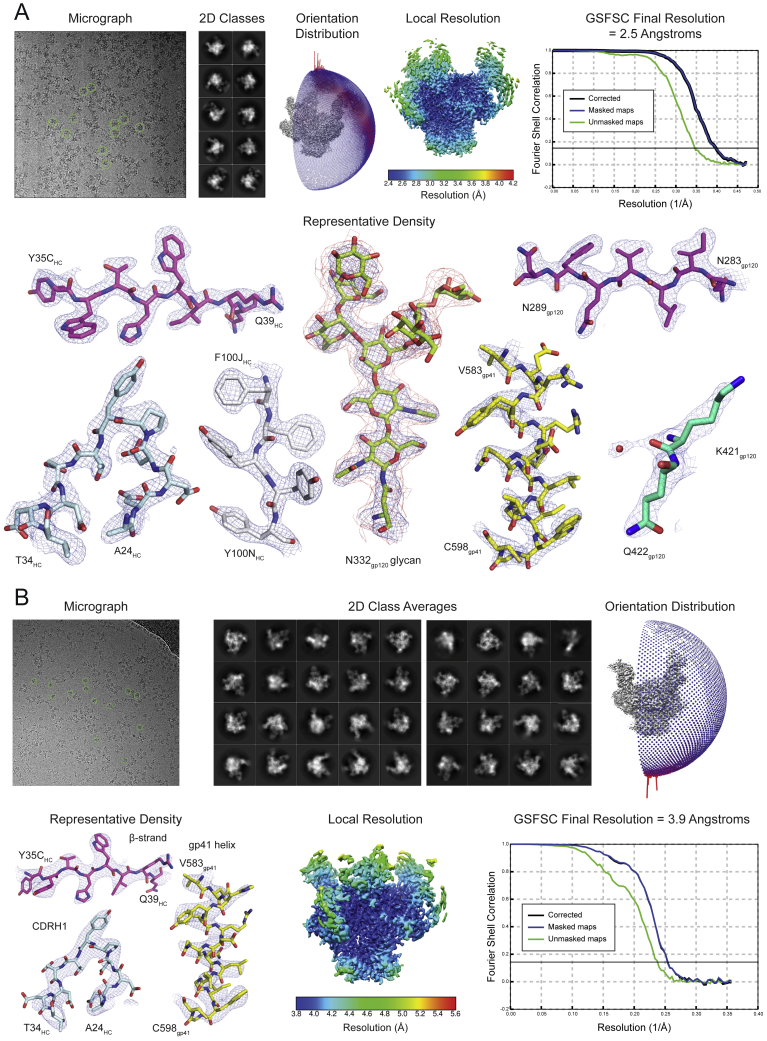
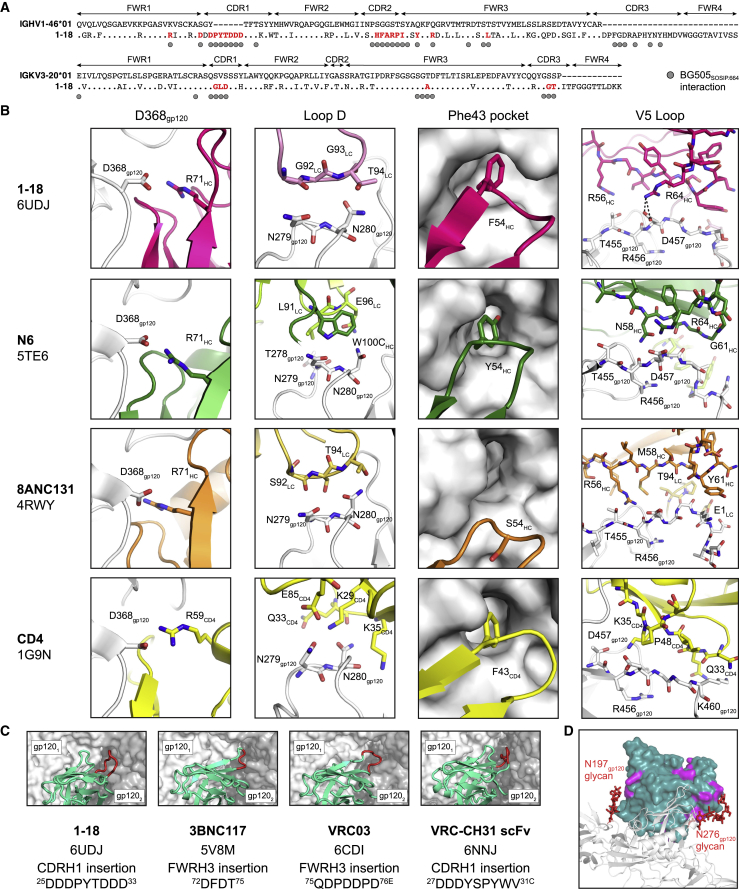
Broadly neutralizing antibodies (bNAbs) represent a promising approach to prevent and treat HIV-1 infection. However, viral escape through mutation of the HIV-1 envelope glycoprotein (Env) limits clinical applications. Here we describe 1-18, a new VH1-46-encoded CD4 binding site (CD4bs) bNAb with outstanding breadth (97%) and potency (GeoMean IC50 = 0.048 μg/mL). Notably, 1-18 is not susceptible to typical CD4bs escape mutations and effectively overcomes HIV-1 resistance to other CD4bs bNAbs. Moreover, mutational antigenic profiling uncovered restricted pathways of HIV-1 escape. Of most promise for therapeutic use, even 1-18 alone fully suppressed viremia in HIV-1-infected humanized mice without selecting for resistant viral variants. A 2.5-Å cryo-EM structure of a 1-18-BG505SOSIP.664 Env complex revealed that these characteristics are likely facilitated by a heavy-chain insertion and increased inter-protomer contacts. The ability of 1-18 to effectively restrict HIV-1 escape pathways provides a new option to successfully prevent and treat HIV-1 infection.

Keywords: CD4 binding site; HIV-1; HIV-1 escape restriction; broadly neutralizing antibodies; cryogenic electron microscopy; deep mutational scanning; escape mutations; humanized mice; immunotherapy; mutational antigenic profiling.


Conflict of interest statement

Declaration of Interests A patent application encompassing aspects of this work has been filed by the University of Cologne, listing P.S., H.G., and F.K. as inventors.

Figures

None
Graphical abstract
Figure 1
Figure 1
Identification of Broad and Potent Antibodies in Donor IDC561 (A) Identification of the elite neutralizer IDC561. (B) Single BG505SOSIP.664- (top) or YU2gp140-reactive (bottom) B cells were sorted, and antibody sequences were amplified using OPT5/oPR primers. Left pie charts showing the numbers of heavy-chain sequences identified, with clonal sequences indicated in light blue; right pie charts showing the numbers of clonal heavy-chain sequences, with individual clones represented by slices. Antibodies of members of clones in dark blue and green were tested. A black line indicates clones identified by both HIV-1 Env-sorting strategies. (C) Monoclonal antibodies were produced from members of 33 clones (clone 4 comprised subclones 4.1–4.4) (left). Boxes in the middle and on the right correspond to the left panel and show antibodies binding to YU2gp140 or BG505SOSIP.664 or neutralizing more than 90% of the global panel HIV-1 strains, respectively. (D) Phylogenetic tree of clone 4 members. Boxes indicate GeoMean IC50 and breadth against the global panel. aa, amino acids. Black, gray, and green asterisks indicate antibodies 1-18, 1-55, and 2-12, respectively. See also Figures S1 and S2 and Tables S1, S2, S3, and S4.
Figure S1
Figure S1
Clinical Characteristics, Neutralizing IgG Activity, and B Cell Repertoire of Individual IDC561, Related to Figure 1 (A) Clinical characteristics of IDC561 at the time of leukapheresis from which monoclonal antibodies were isolated. (B) Plasma HIV-1 RNA copies (left y axis) and CD4+ T cell counts (right y axis). Arrows indicate sample collections. Monoclonal antibodies were isolated from the last indicated sampling time point. Dashed line indicates HIV-1 RNA quantification limit. (C) Neutralizing activity of IDC561 serum IgG against global panel. (D) Neutralizing activity of IDC561 serum IgG against f61 fingerprinting panel and BG505T332N (left, colors as in C). Right panels show delineation scores of f61 panel-based computational epitope mapping. (E) Neutralizing activity of IDC561 serum IgG and monoclonal bNAbs against outgrowth culture-derived viruses from bulk CD4+ T cells obtained at indicated time points (colors as in C). (F–H) Comparison of total B cell repertoire of IDC561 and Env-reactive B cells, indicating (F) CDRH3 lengths, (G) VH gene germline identity, and (H) VH allele distribution. Dashed lines indicate medians.
Figure 2
Figure 2
bNAb 1-18 Demonstrates Highly Potent and Near-Pan HIV-1-Neutralizing Activity (A) Characteristics of antibodies 1-18 and 1-55. (B) Activity of 1-18 against the global panel compared with bNAbs in advanced stages of clinical testing, individually sorted by increasing IC50 values for each bNAb. Data for 3BNC117, VRC01, 10-1074, and PGT121 were derived from CATNAP (Yoon et al., 2015). (C) Activity of 1-18 compared with a selection of bNAbs against an identical set of 109 pseudovirus strains (Yoon et al., 2015). For N6, neutralization data were determined in the same laboratory as for 1-18. (D) Activity against the 119-pseudovirus multiclade panel. Data for 3BNC117, VRC01, 10-1074, and PGT121 were derived from CATNAP (Yoon et al., 2015). (E) Activity against patient-derived bulk culture outgrowth virus. (F) Activity of 1-18 compared with N6 against the 119-pseudovirus multiclade panel and patient-derived bulk culture outgrowth viruses. In (D)–(F), IC50 values are shown at the top and IC80 values at the bottom. See also Figure S2 and Tables S3 and S5.
Figure S2
Figure S2
Neutralization and ELISA Binding Profiles, Related to Figures 1 and 2 (A) Left panel indicates neutralizing activity of 1-18 (left y axis) compared to serum IgG of donor IDC561 (right y axis) against the global pseudovirus panel (left x axis) and a 30-strain YU2 pseudovirus mutant panel (right x axis), with pseudoviruses indicated on the x axis. Right panel indicates correlation and calculated Spearman’s rho. (B) Competition ELISAs indicating binding of 1-18 (left) and 1-55 (right) to BG505SOSIP.664 following an incubation with increasing concentrations of the indicated competing antibodies. (C) ELISAs of 1-18, 1-55, and additional CD4bs antibodies against the indicated HIV-1 Env antigens. Circles show means and error bars indicate standard deviation. (D) Neutralizing activity of 1-18, 3BNC117, and the combination of both (mixed at a 1:1 ratio) against the global pseudovirus panel and YU2. Single antibodies were tested up to a concentration of 1 μg/ml, the combination up to a concentration of 2 μg/ml (total IgG amount).
Figure 3
Figure 3
Cryo-EM Structures of 1-18 and 1-55 Fab Complexes with Env Trimers (A) EM densities for side views of Env trimers complexed with 1-18 or 1-55 Fabs and 10-1074 bNAb Fabs. 1-55 Fabs were based on sequence variants that contained primer-induced mutations at the start and end of the V genes (total of 2 aa [VH] and 4 aa [Vκ] mutations). (B) Top view of 1-18-BG505-10-1074 complex density. The inset shows a close up of the interactions between the 1-18 VH-VL domains (cartoon representation) and Env, with primary gp120 shown in light gray and secondary gp120 (gp1202) shown in dark gray. Protein regions that are contacted by 1-18 are shown as colored surfaces, and glycans are shown as sticks. (C) Close up of interactions of 1-18 CDRH1 residues with residues on secondary gp120. Hydrogen bonds and electrostatic contacts are shown as dotted lines. The percent conservation among Env sequences of gp1202 residues contacted by CDRH1 is indicated in parentheses (West et al., 2013). denotes the conservation percentage in the 500 viruses that have residue 308. (D) Electrostatic surface representation of the Env region contacted by the 1-18 CDRH1. (E) Buried surface areas from CD4bs bNAb contacts on the primary (gp1201) and secondary (gp1202) protomers. Env trimer structures are SOSIP.664 versions of the indicated Env strains. See also Figures S3 and S4 and Table S6.
Figure S3
Figure S3
Cryo-EM Data Collection and Processing, Related to Figure 3 (A–B) A micrograph with examples of picked particles, selected two-dimensional class averages, an orientation distribution image, a local resolution graphic, a GSFSC resolution plot, and representative densities for protein and N-linked glycan regions are shown for the (A) 1-18–BG505–10-1074 and (B) 1-55–RC1–10-1074 complexes.
Figure S4
Figure S4
Structural Interaction Details of 1-18- and 1-55-Env Complexes, Related to Figure 3 (A) Alignment of 1-18 heavy (top) and light (bottom) chain sequences to germline. Residues interacting with BG505SOSIP.664 are indicated by circles. Interacting residues mutated from the germline sequences are indicated in red. (B) Comparison of Env-interactions of 1-18, the CD4bs bNAbs N6 and 8ANC131, and CD4 at four sites: D368gp120, Loop D, the ‘Phe43 pocket’, and the V5 loop. Heavy chains are shown in darker colors than light chains. PDB codes are indicated on the left. (C) Comparison of Env-interactions of bNAbs with Asp-rich insertions in CDRH1 or FWRH3 contacting the adjacent gp120 protomer. Each SOSIP.664 trimer is shown as semi-transparent surface with the primary gp120 protomer in white and the adjacent gp120 in gray. VHVL regions are shown in teal with insertions in red. PDB code, insertion location, and insertion sequence are listed. (D) Differences between Fabs of 1-18 and 1-55. One 1-18 VHVL (dark green surface) is shown bound to one gp120 (gray cartoon). Locations of residues varying between 1-18 and 1-55 are highlighted in magenta. Glycans at positions N197gp120 and N276gp120 are shown as red sticks. 1-55 Fabs were based on earlier sequence variants and contained primer-induced mutations at the start and end of the V genes (for a total of 2 aa [VH] and 4 aa [VΚ] mutations).
Figure 4
Figure 4
1-18 Overcomes Typical bNAb Escape Mutations In Vitro The top row shows bNAb IC50 values against the YU2 wild-type pseudovirus. The panels show the change in bNAb sensitivity (fold change of IC50) for YU2 pseudovirus mutants compared with the wild type.
Figure S5
Figure S5
Mutational Antigenic Profiling: Fractions Surviving, Correlation between Replicates, and Determination of Sites of Significant Escape, Related to Figure 5 (A) Antibody concentration during selection, batch of mutant virus library, and fraction of library surviving antibody selection for each biological replicate. (B–D) Correlation between biological replicate selections of average excess fraction surviving at each site in the presence of (B) 1-18, (C) VRC01, and (D) 3BNC117. (E) Distribution of average fraction surviving at each site for each antibody (blue bars). The yellow line overlays the gamma distribution fit using robust regression to site fraction surviving data. Dotted lines mark sites that fall beyond this distribution at a false discovery rate of 0.01. Number of sites beyond this cutoff is labeled in green and individual sites are listed at the bottom. Data for 3BNC117 and VRC01 are from Dingens et al. (2019).
Figure 5
Figure 5
Restricted Pathways of Escape from 1-18 Identified by Mutational Antigenic Profiling (A) Line plots indicate the HIV-1BG505 library excess fraction surviving antibody neutralization, averaged across all mutations at each site. Data for antibodies other than 1-18 in all panels are from Dingens et al. (2019). Regions in gray are detailed in (B). (B) HIV-1BG505 escape profiles, with letter heights indicating the excess fraction surviving for each mutation. Circles indicate HIV-1BG505 residues interacting with 1-18 (cryo-EM). Asterisks indicate residues with statistically significant antibody escape. (C) The BG505SOSIP.664 trimer, colored according to the maximum excess fraction surviving 1-18 at each site, with 1-18 shown in blue. In the inset, structurally defined contacts are shown as spheres, and the CDRH1 is highlighted by the rectangle. Interactions of the CDRH1 with the adjacent gp120 protomer are indicated on the right. (D) The top row indicates IC50 of 1-18 against the BG505T332N pseudovirus, and the panels show fold change in IC50 for BG505T332N pseudovirus variants with mutations in the six residues showing the highest excess fraction surviving 1-18 neutralization. Circles indicate interactions as in (B). (E) Excess fraction surviving for the 40 mutations with the largest effect sizes for each antibody. Circles indicate the number of nucleotide changes required for the respective amino acid mutation. See also Figure S5.
Figure S6
Figure S6
1-18 and 1-55 Antiviral Activity in HIV-1YU2-Infected Humanized Mice, Pharmacokinetics, and Autoreactive Properties, Related to Figures 6 and 7 (A) Absolute HIV-1 RNA copies (top) and log10 viral load changes (bottom) in untreated HIV-1YU2-infected humanized mice. Red line shows average log10 viral load change compared to baseline. Dashed line in top panel indicates quantitation limit of accuracy (384 copies/ml). (B) Absolute HIV-1 RNA copies (top) and log10 viral load changes (bottom) in HIV-1YU2-infected humanized mice treated with 1-55 (left) or 1-18 (right). Grey shading indicates duration of bNAb therapy. Dashed lines in top panels indicate quantitation limit of accuracy (384 copies/ml). Data points in white indicate viral loads < 384 copies/ml. Red lines show average log10 viral load change compared to baseline. (C) Alignment of plasma SGS-derived env sequences from mouse 1730 obtained on day 0 (top) and day 28 (bottom) based on nucleotide sequences. Indicated changes are amino acid mutations (black bars), mutations resulting in frameshifts (red hash), and nucleotide deletions (black horizontal lines) compared to YU2 wild-type sequence. Amino acid numbering on top is based on HIV-1YU2, and indicated mutations are numbered based on HIV-1HXB2. (D) Serum human IgG levels in NRG mice after intravenous injection of 0.5 mg of antibody on day 0 (left). Data are represented as mean ± standard deviation, respectively. (E) HEp-2 cell reactivity using the indicated monoclonal antibodies at a concentration of 100 μg/ml.
Figure 6
Figure 6
Full Suppression of Viremia by 1-18 Monotherapy In Vivo (A) HIV-1 RNA plasma copies (top) and log10 viral load changes compared with baseline (day -1) (bottom). Dashed lines in the top panels indicate the quantitation limit of accuracy (384 copies/mL), and data points in white indicate viral loads of less than 384 copies/mL. Red lines show average log10 viral load changes compared with baseline. (B) Env sequences obtained from day 28 plasma RNA of indicated mice by SGS. Letters indicate amino acid mutations compared with wild-type YU2 shown on top. Residues are numbered according to HIV-1HXB2. See also Figure S6 and Table S7.
Figure 7
Figure 7
bNAb 1-18 Overcomes VRC01-Class Escape In Vivo (A) Pie charts indicate the number of plasma env sequences obtained from HIV-1YU2-infected humanized mice on day 28 of treatment with 3BNC117, VRC01, or 3BNC117+VRC01. Icons are as in Figure 6A. Outer bars indicate mutations in loop D and/or the β23 strand/V5 loop. + G471E mutation. ∗∗+ ΔT462 & ΔN463 mutations. (B) IC50s of 1-18 SGS-derived day 28 env sequence pseudoviruses with mutations as indicated in (A). (C) Addition of 1-18 treatment on day 28 to HIV-1YU2-infected humanized mice that showed viral rebound during 3BNC117, VRC01, or 3BNC117+VRC01 therapy (Figure 6A). The previous treatment regimen was continued. HIV-1 RNA plasma copies are shown at the top and log10 viral load changes compared with baseline (day 28) at the bottom. Dashed lines in the top panels indicate the quantitation limit of accuracy (384 copies/mL), and data points in white indicate viral loads of less than 384 copies/mL. Red lines show average log10 viral load changes compared with baseline (day 28). (D) HIV-1 RNA plasma copies (left y axis) and plasma bNAb levels determined by BG505SOSIP.664-ELISA (right y axis) after interruption of bNAb therapy on day 56 as indicated in (C). Only mice that could be followed for 58 days are included. Dashed lines indicate the HIV-1 RNA quantitation limit of accuracy (384 copies/mL). White circles show viral loads of less than 384 copies/mL, and gray circles indicate antibody levels of less than 1 μg/mL. (E) Plasma SGS-derived env sequences obtained on day 114. Black bars indicate amino acid mutations compared with the YU2 wild-type found previously; red bars indicate mutations only found on day 114 within individual mice. Numbering is according to HIV-1YU2. Boxes indicate IC50 values of 1-18 against the corresponding pseudoviruses (right). See also Table S7.
Figure S7
Figure S7
Plasma SGS-Derived env Sequences Obtained from Donor IDC561, Related to Figures 1 and S1 (A) Letter heights indicate amino acid frequency among 2,351 clade B sequences obtained from the Los Alamos National Laboratory (LANL) database (top). Bottom panels show selected sites of plasma SGS-derived env sequences obtained from IDC561 from the leukapheresis sample from which 1-18 and 1-55 were isolated. Boxes indicate amino acids for which IDC561 consensus sequence is represented in ≤ 1% (red) or 1%–5% (blue) of the LANL clade B sequences. Numbering relative to HIV-1HXB2 reference strain. (B) Neutralization sensitivity of pseudoviruses based on IDC561 sequences indicated in (A). Maximum percent inhibition (MPI) determined when tested at maximum concentrations of 500 μg/ml (purified IgG) or 25 μg/ml (monoclonal antibodies). Plasma IgG was obtained at the time of leukapheresis from which 1-18 was isolated.

References

    1. Adams P.D., Afonine P.V., Bunkóczi G., Chen V.B., Davis I.W., Echols N., Headd J.J., Hung L.W., Kapral G.J., Grosse-Kunstleve R.W. PHENIX: a comprehensive Python-based system for macromolecular structure solution. Acta Crystallogr. D Biol. Crystallogr. 2010;66:213–221. - PMC - PubMed
    1. Anderson J.P., Rodrigo A.G., Learn G.H., Madan A., Delahunty C., Coon M., Girard M., Osmanov S., Hood L., Mullins J.I. Testing the hypothesis of a recombinant origin of human immunodeficiency virus type 1 subtype E. J. Virol. 2000;74:10752–10765. - PMC - PubMed
    1. Balazs A.B., Chen J., Hong C.M., Rao D.S., Yang L., Baltimore D. Antibody-based protection against HIV infection by vectored immunoprophylaxis. Nature. 2011;481:81–84. - PMC - PubMed
    1. Bar K.J., Sneller M.C., Harrison L.J., Justement J.S., Overton E.T., Petrone M.E., Salantes D.B., Seamon C.A., Scheinfeld B., Kwan R.W. Effect of HIV Antibody VRC01 on Viral Rebound after Treatment Interruption. N. Engl. J. Med. 2016;375:2037–2050. - PMC - PubMed
    1. Bar-On Y., Gruell H., Schoofs T., Pai J.A., Nogueira L., Butler A.L., Millard K., Lehmann C., Suárez I., Oliveira T.Y. Safety and antiviral activity of combination HIV-1 broadly neutralizing antibodies in viremic individuals. Nat. Med. 2018;24:1701–1707. - PMC - PubMed

Publication types

MeSH terms