. 2020 Feb:139:176-189.
doi: 10.1016/j.yjmcc.2020.01.010. Epub 2020 Jan 29.

Global knockout of ROMK potassium channel worsens cardiac ischemia-reperfusion injury but cardiomyocyte-specific knockout does not: Implications for the identity of mitoKATP

Affiliations

Global knockout of ROMK potassium channel worsens cardiac ischemia-reperfusion injury but cardiomyocyte-specific knockout does not: Implications for the identity of mitoKATP

Kyriakos N Papanicolaou et al. J Mol Cell Cardiol. 2020 Feb.

Abstract

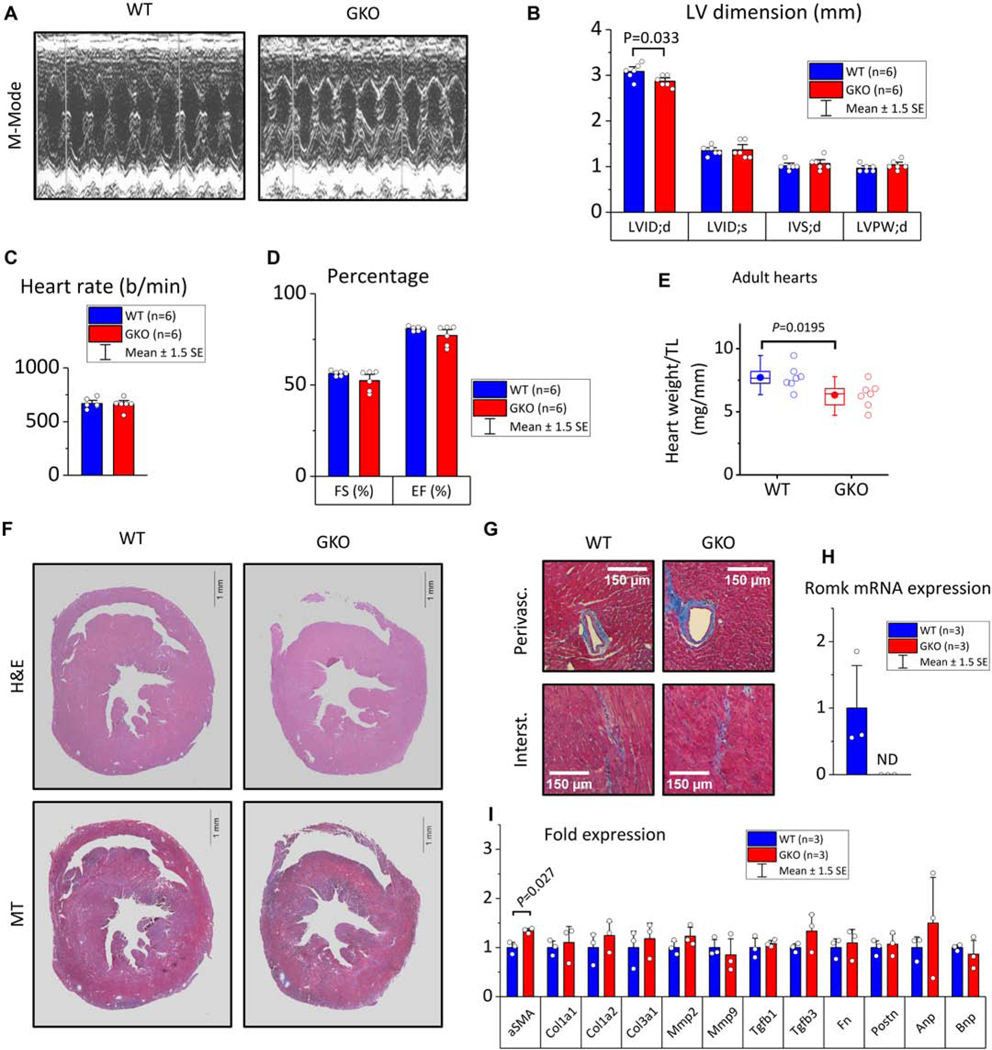
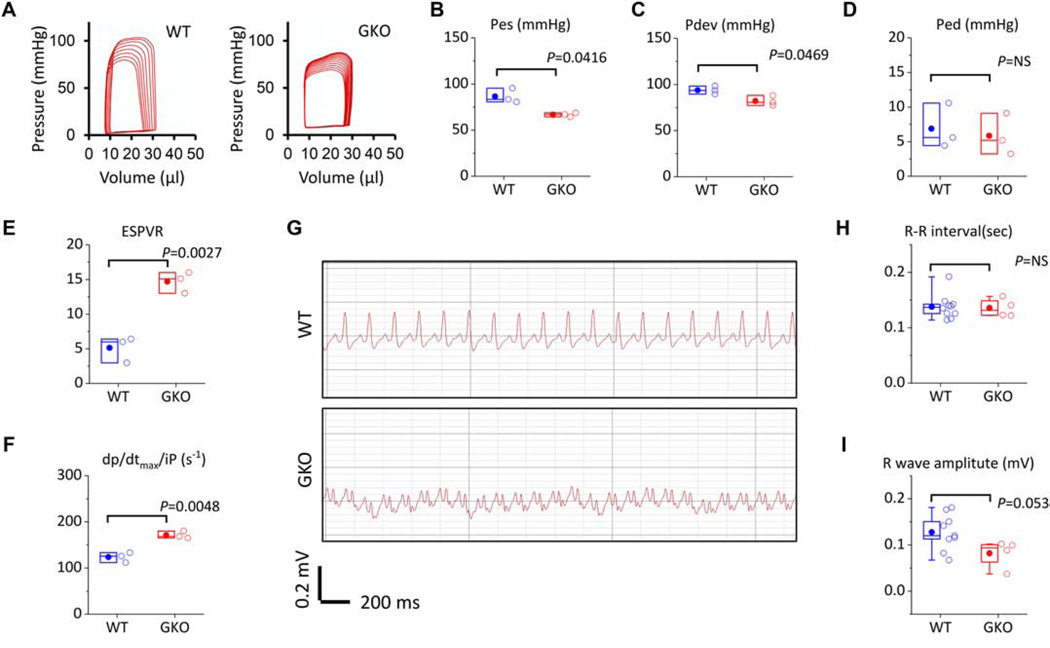
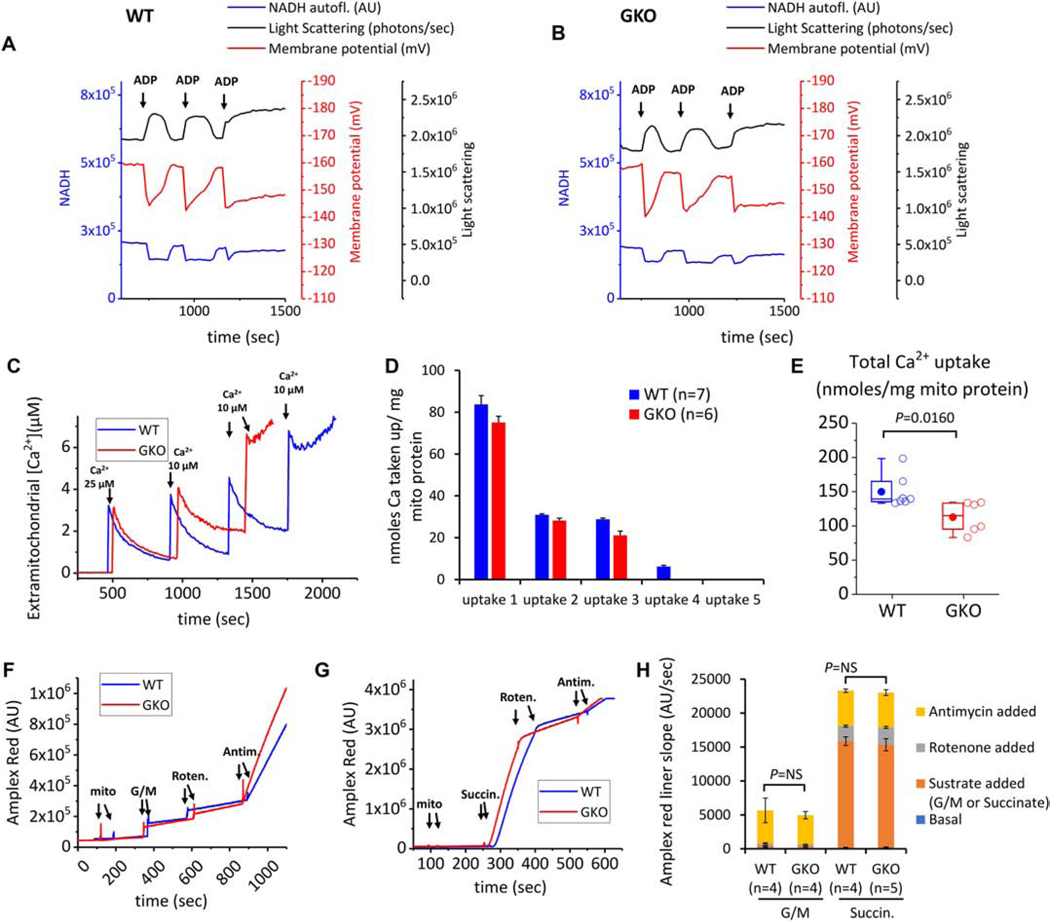
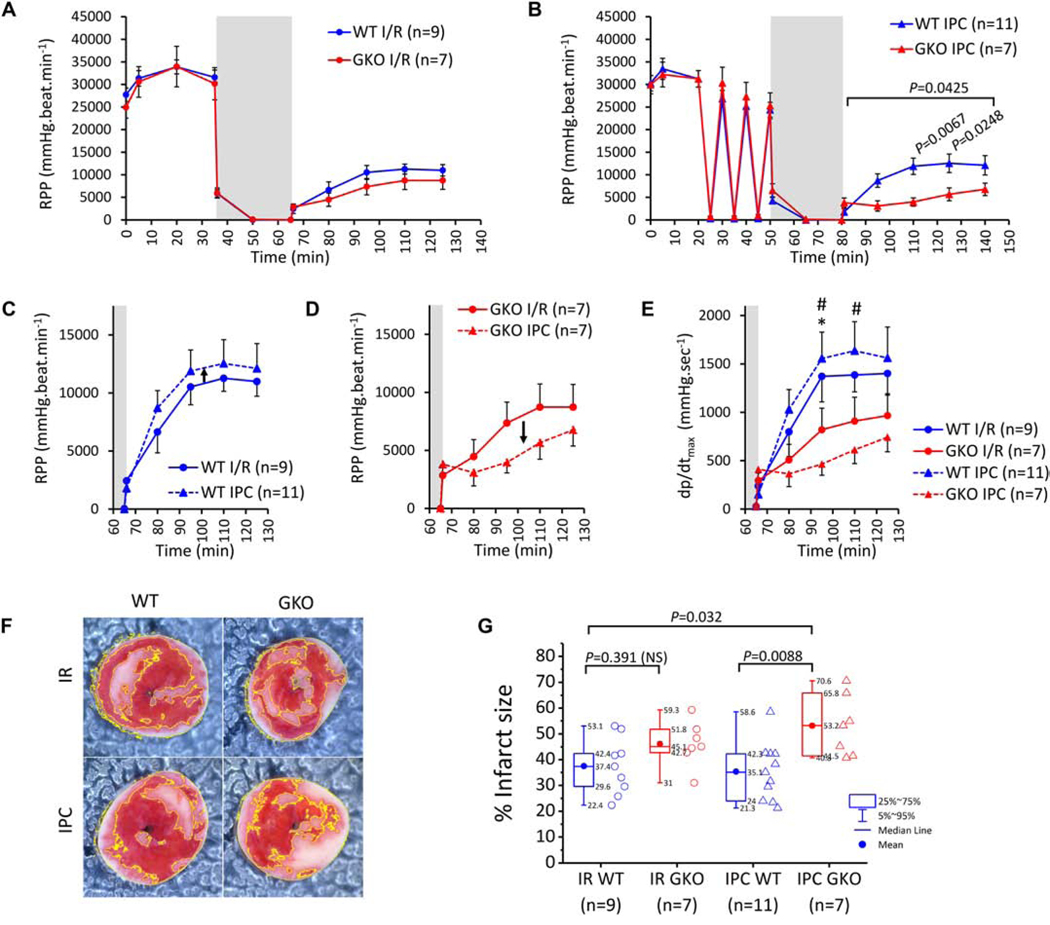
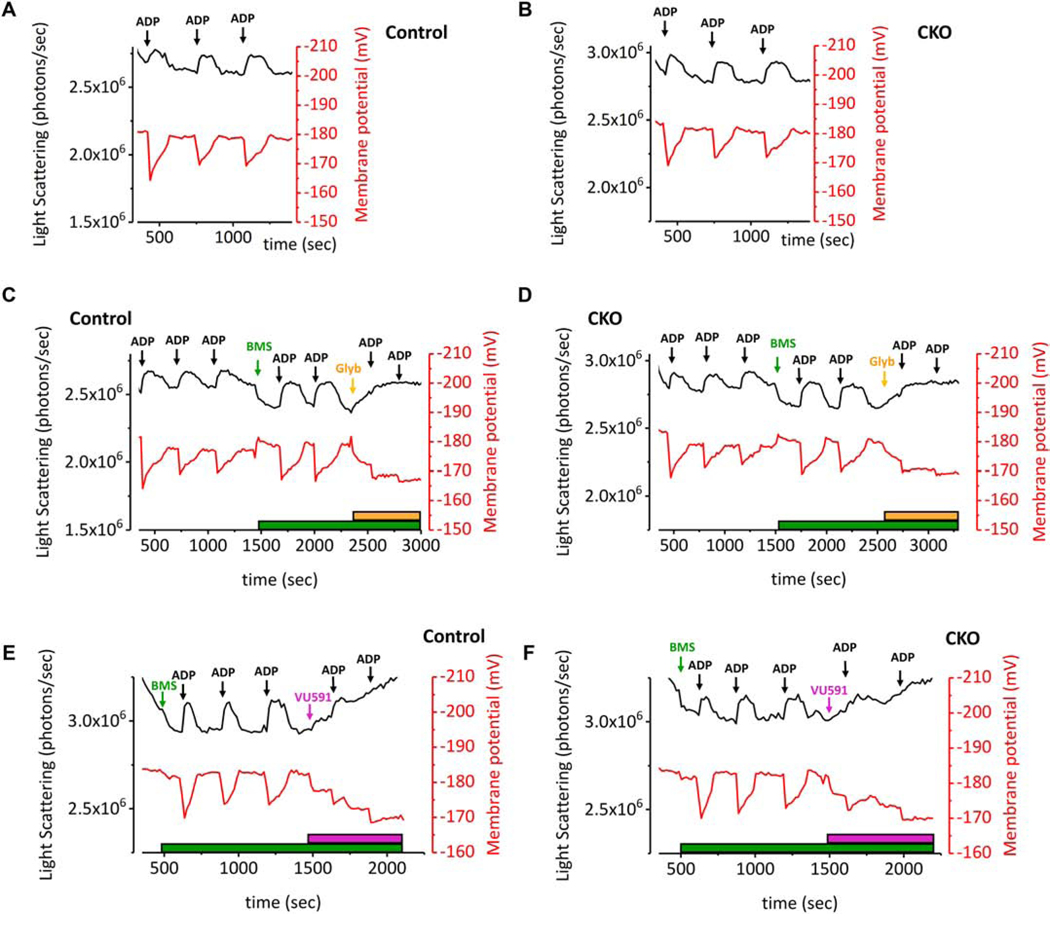
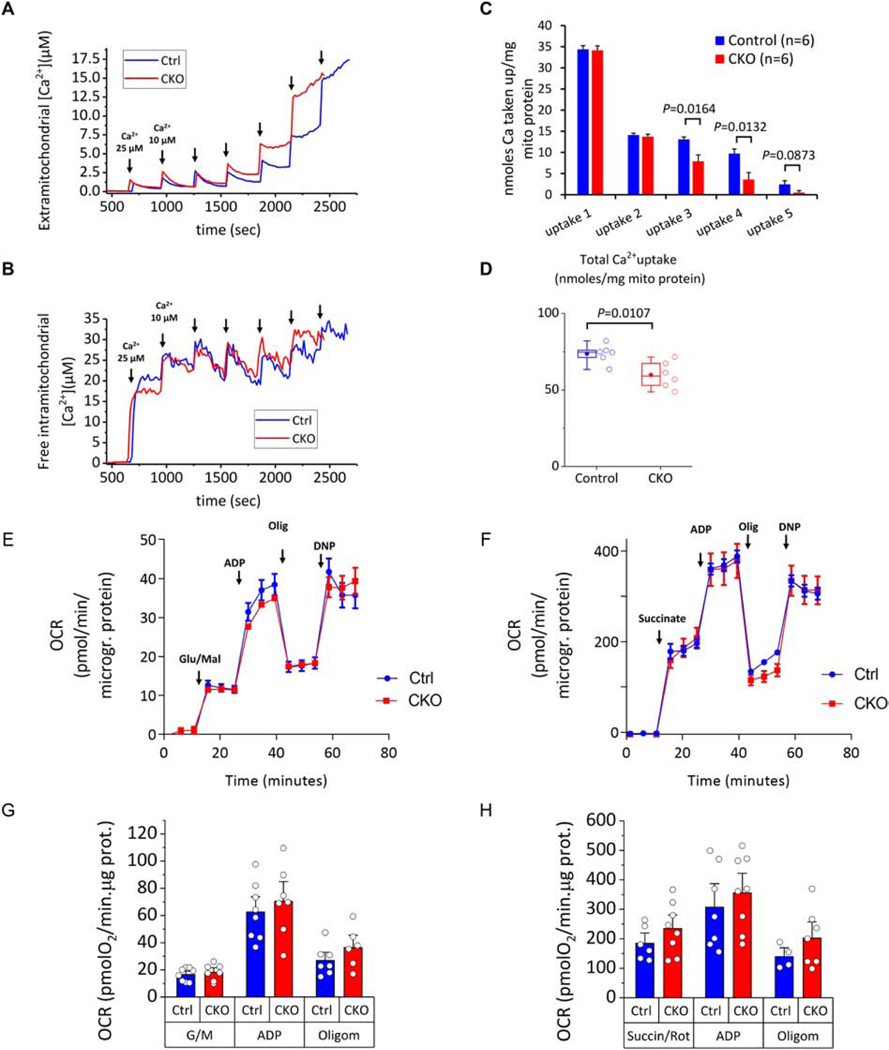
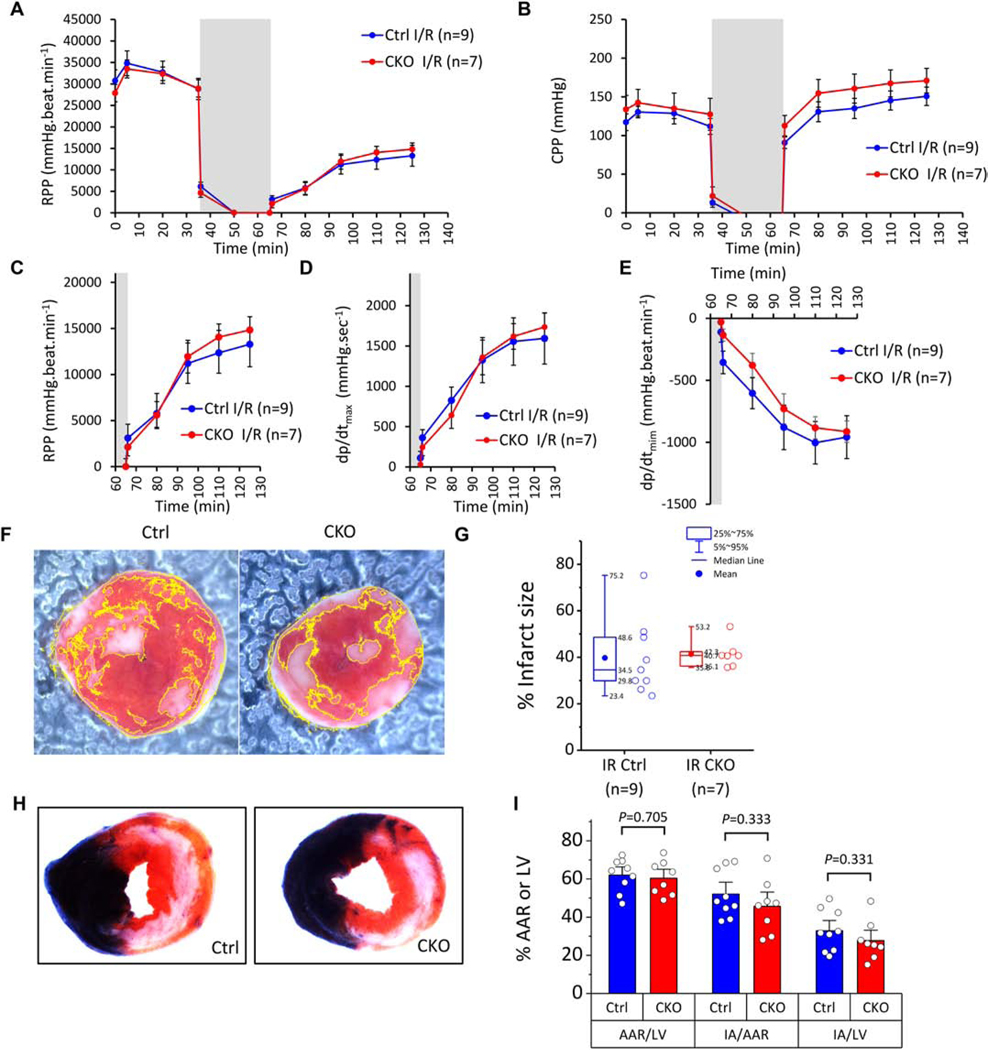
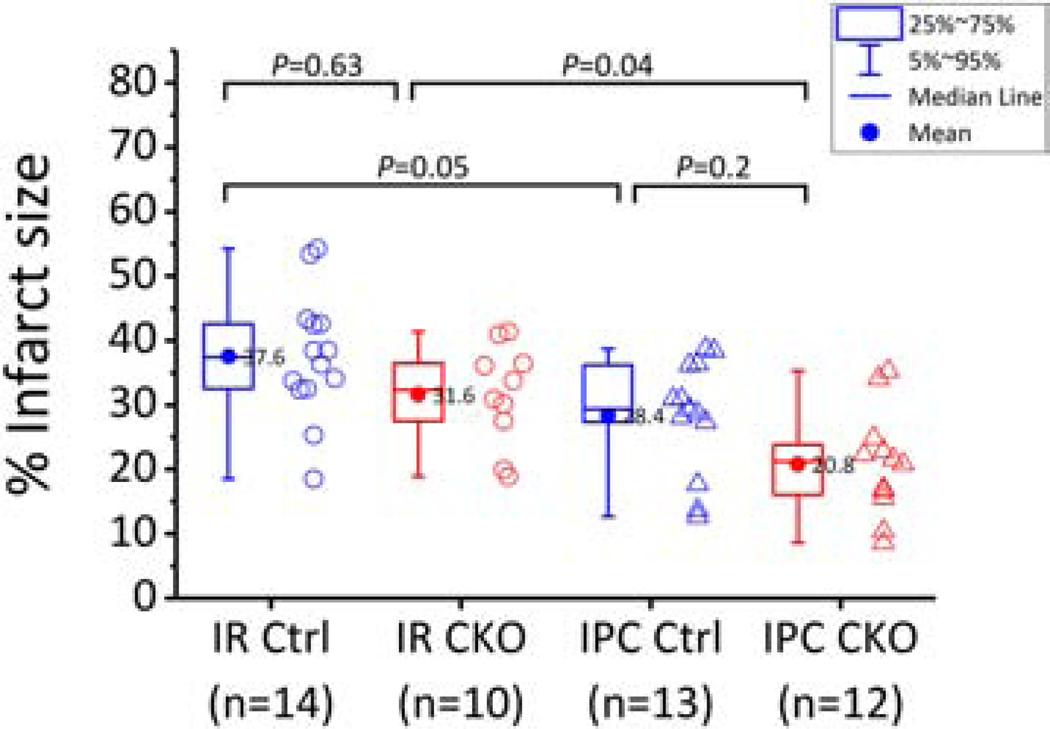
The renal-outer-medullary‑potassium (ROMK) channel, mutated in Bartter's syndrome, regulates ion exchange in kidney, but its extra-renal functions remain unknown. Additionally, ROMK was postulated to be the pore-forming subunit of the mitochondrial ATP-sensitive K+ channel (mitoKATP), a mediator of cardioprotection. Using global and cardiomyocyte-specific knockout mice (ROMK-GKO and ROMK-CKO respectively), we characterize the effects of ROMK knockout on mitochondrial ion handling, the response to pharmacological KATP channel modulators, and ischemia/reperfusion (I/R) injury. Mitochondria from ROMK-GKO hearts exhibited a lower threshold for Ca2+-triggered permeability transition pore (mPTP) opening but normal matrix volume changes during oxidative phosphorylation. Isolated perfused ROMK-GKO hearts exhibited impaired functional recovery and increased infarct size when I/R was preceded by an ischemic preconditioning (IPC) protocol. Because ROMK-GKO mice exhibited severe renal defects and cardiac remodeling, we further characterized ROMK-CKO hearts to avoid confounding systemic effects. Mitochondria from ROMK-CKO hearts had unchanged matrix volume responses during oxidative phosphorylation and still swelled upon addition of a mitoKATP opener, but exhibited a lower threshold for mPTP opening, similar to GKO mitochondria. Nevertheless, I/R induced damage was not exacerbated in ROMK-CKO hearts, either ex vivo or in vivo. Lastly, we examined the response of ROMK-CKO hearts to ex vivo I/R injury with or without IPC and found that IPC still protected these hearts, suggesting that cardiomyocyte ROMK does not participate significantly in the cardioprotective pathway elicited by IPC. Collectively, our findings from these novel strains of mice suggest that cardiomyocyte ROMK is not a central mediator of mitoKATP function, although it can affect mPTP activation threshold.

Keywords: Bartter's syndrome; Ischemic preconditioning; Kcnj1 or Kir1.1 or ROMK; Mitochondrial ATP-sensitive potassium channel; Mitochondrial permeability transition pore; Renal potassium channel.


Conflict of interest statement

Declaration of Competing Interest The authors declare no competing interests.

Figures

Figure 1.
Figure 1.. Baseline cardiac phenotype characterization in adult WT and ROMK-GKO mice.
(A) Representative M-mode echocardiograms at the papillary muscle level, (B) Left-ventricle cavity dimensions and wall thickness in diastole (d) and systole (s). Starting from left: LVID;d left ventricle inner dimension in diastole, LVID;s left ventricle inner dimension in systole, IVS;d inter ventricular septum (thickness) in diastole, LVPW;d left ventricle posterior wall (thickness) in diastole. (C-D) Heart rate and the contractility indexes fractional shortening (FS) and ejection fraction (EF), (E) Morphometric assessment of cardiac mass in adult WT and GKO mice. HW; heart weight, TL; tibia length, n=7 mice per group. Boxes cover the 25–75% range of data, the mean is shown as a solid dot and the median as a line. Whiskers cover the 5–95% range, (F) Macroscopic appearance of WT and GKO hearts at the short axis. H&E, hematoxylin and eosin staining to visualize nuclei and cytoplasm, scale bar is 1 mm (G) Detailed microscopic appearance of WT and GKO myocardium stained with Masson’s trichrome to visualize perivascular (upper two panels) or interstitial (lower two panels) collagen deposition. Scale bars represent 150 μm. (H) Quantification of Romk expression in whole heart homogenate with real-time quantitative PCR in WT and GKO hearts. ND: not determined due to sub-detection amount, (I) qPCR analysis in WT and GKO hearts to assess expression across a panel of genes implicated in cardiac hypertrophy, remodeling and fibrosis (n=3 samples per genotype, two tailed t-tests used to assess statistical significance at P<0.05).
Figure 2.
Figure 2.. Hemodynamics and electrophysiology in adult WT and ROMK-GKO mice (GKO).
(A) Representative pressure-volume (PV) loops obtained by in situ LV catherization and vena cava occlusion for progressively decreased preload. (B-D) Preload-dependent parameters of contractility in WT vs. GKO animals (E-F) Preload-independent parameters of contractility. Pes; pressure at end-systole, Ped; pressure at end-diastole, Pdev; developed pressure, Espvr; end-systolic pressure-volume relationship (preload independent), dp/dtmax/iP; dp/dt max normalized by instantaneous pressure (preload independent). n=3 for WT and GKO mice, Indicated P values are from two tailed t-tests (G) Representative electrocardiograms (ECG) obtained with a configuration-II surface lead placed on lightly anesthetized mice. The ECG in GKO animals appears strikingly different from WT presenting similarities to a right bundle branch block. (H-I) R-R interval and R wave amplitude in WT vs. GKO animals, n=9 WT and n=4 for GKO mice, P values are from two tailed t-tests. In the scatter box plots, boxes cover the 25–75% range of data, the mean is shown as a solid dot and the median as a line. Whiskers cover the 5–95% range.
Figure 3.
Figure 3.. Multiparametric analysis of mitochondrial function in isolated mitochondria from WT and GKO hearts.
(A-B) Representative results of mitochondria matrix contraction and recovery in respiring mitochondria from WT and GKO mitochondria (left panel and right panel respectively). Changes in matrix volume are monitored by light scattering (absorbance at 540 nm, black trace). Additionally recorded is mitochondrial membrane potential (determined from ratiometric measures of TMRM at ex./emm. 546/590 and 573/590, red trace) and NADH oxidation/reduction (ex./emm. 340/450 nm, blue trace). The incubation medium contains 0.5 mg mitochondria and 5 mM each of the substrates glutamate, malate and succinate. The medium also contains ~150 mM K+. At the indicated times (arrows), 200 μM ADP are added to the incubation medium and changes in mitochondrial light scattering are recorded along with the other two bioenergetic parameters. (C) Aliquots of mouse heart mitochondria (0.5 mg) were added to 2.0 ml assay buffer containing 100 nM Calcium Green 5N, 300 nM TMRM, and 5 mM each of glutamate and malate (G/M). The first calcium addition is 25 μM and each subsequent addition is 10 μM. Calcium green fluorescence units were converted to free [Ca2+] using a calibration curve constructed from separate experiments using identical incubation and acquisition conditions in the presence of depolarized mitochondria. Multiple known calcium additions were performed and free extramitochondrial [Ca2+] was calculated using MaxChelator to account for the presence of EGTA in the buffer. The curve was fitted to the equation [Ca2+]=kd(F-Fmin)/(Fmax-F), where F is fluorescence intensity of Calcium Green 5N (ex./emm. 505/535 nm). From this equation the apparent dissociation constant of calcium green for Ca was found to be kd = 27.03. Representative Calcium Green traces from 7 and 6 runs for WT and GKO mitochondria are shown. The end of the experiment is determined by the onset of mitochondrial permeability transition evident by rapid efflux of calcium into the incubation medium. (D-E) Per addition and total Ca taken up by energized mitochondria. Results are reported as nanomoles of taken up Calcium normalized to 1 mg mitochondrial protein. (F-G) Representative traces of Amplex Red fluorescence (ex./emm. 530/590 nm) to monitor mitochondrial H2O2 production in the presence of substrates (added to a final concentration 5 mM) and the inhibitors Rotenone and Antimycin A (final concentration 500 nM each). The reaction contained contains 100 μg mitochondria and rates of H2O2 production were determined from the linear part of each stage of the experiment (H) Summary of H2O2 production in WT and GKO mitochondria energized with substrates and inhibitors to manipulate ROS production from complex I or complex III.
Figure 4.
Figure 4.. Responses of WT and GKO to ex vivo IR with or without IPC.
(A) Across-protocol monitoring of rate pressure product (RPP) in the LV of hearts subjected to 35 min baseline perfusion and followed by 30 min. global ischemia (grey area) and 1 hr. of reperfusion (I/R protocol). (B) Across-protocol monitoring of RPP in perfused hearts subjected to 20 min baseline perfusion and followed by 3 cycles of 5min. ischemia and 5 min. of reperfusion (IPC protocol). The heart was then subjected to 30 min. global ischemia and 1 hr. of reperfusion. Dots represent within-group means and whiskers are standard errors of the mean. n indicates a different heart preparation randomly assigned to either the IR and IPC protocol. Comparisons of post-ischemic RPP recovery between WT and GKO groups were performed using 2way repeated measures ANOVA followed by Bonferroni’s multiple comparisons test (significance threshold at P< 0.05). (C-D) Re-plotting data from A and B to examine the effects of IPC on post-ischemic RPP recovery within each genotype. The x axis is shortened to show only the post-ischemic phase and the maximum for the y axis is changed to 17500 mmHg.beats.min-1. (E) Post-ischemic recovery of cardiac contractility assessed by dp/dtmax in the four experimental groups. * P<0.05 for WT IR vs GKO IPC and # P<0.05 for WT IPC vs GKO IPC by 2way repeated measures ANOVA and Bonferroni’s multiple comparisons test. (F) Representative photos of heart slices stained with TTC at the end of reperfusion. Infarct areas are shown delineated with yellow line. (G) Infarct size (%) across the four experimental groups. Boxes cover the 25–75% range of data, the mean is shown as a solid circle and the median as a line. Whiskers cover the 5–95% range. Data outside the range of 1.5-fold the interquartile range (1.5 IQR) were considered outliers and removed from the analysis. Means comparisons were performed with 2way ANOVA followed by Bonferroni’s post hoc tests and considered significant at the P<0.05 threshold.
Figure 5.
Figure 5.. Genetic and pharmacological analysis of mitochondrial matrix contraction and recovery in isolated Control and CKO mitochondria.
(A-B) Matrix contraction and recovery and concomitant monitoring of ΔΨm during mitochondrial respiration in Control and CKO mitochondria. Respiration is driven by sequential additions of ADP (200 μM). The reaction contained 1.0 mg mitochondria protein, 5 mM each of the substrates glutamate and malate and 300 nM TMRM. The K+- based incubation medium consists of 120 mM KCl, 10 mM NaCl, 2 mM MgCl2.6H2O, 2 mM KH2PO4, 20 mM MOPS, 0.7 mM CaCl2.2H2O and 1 mM EGTA, pH adjusted to 7.2 with 6 M KOH. Matrix contraction and recovery in response to ADP addition is closely similar between Control and CKO mitochondria. (C-D) Matrix contraction assay first with sequential additions of ADP followed by pharmacological activation and inhibition of mitoKATP with BMS-191095 and glibenclamide respectively. Treatment with the mitoKATP opener BMS (5 μM, green arrow) causes matrix swelling that is similar between Control and CKO mitochondria and reversible by ADP. Subsequent changes in matrix volume are abolished by the addition of the mitoKATP inhibitor glibenclamide (10 μM, orange arrow) in both groups. Representative traces from three independent observations are shown. (E-F) Matrix contraction assay starting with the addition of BMS-191095, followed by sequential additions of ADP followed by addition of the ROMK-specific inhibitor VU591 (5 μM, purple arrow and bar). The addition of VU591 abolishes matrix recovery in subsequent additions of ADP but it does so similarly in both Control and CKO mitochondria.
Figure 6.
Figure 6.. Analysis of Ca2+–induced permeability transition pore (PTP) opening, intramitochondrial Ca2+ handling and respiratory capacity in Control and CKO mitochondria.
Isolated heart mitochondria (1.0 mg mitochondrial protein) were added to a stirred cuvette containing 100 nM Calcium Green 5N, 300 nM TMRM, and 5 mM each of glutamate and malate (G/M) and succinate in 2.0 ml assay buffer. The first calcium addition is 25 μM and each subsequent addition is 10 μM. Calcium green fluorescence units (ex./emm. 505/535 nm) were converted to free [Ca2+] using a calibration curve as described previously. For monitoring intramitochondrial calcium, mitochondria were preloaded with [20 μM] of the ratiometric calcium probe Fura-FF-AM for 25 min. Ratios (R) of Fura-FF fluorescence (ex./emm. 340/510 nm and 380/510 nm for calcium-bound and calcium-free probe respectively) were calculated and results applied to the equation [Ca2+]=kd(R-Rmin)/(Rmax-R) to convert fluorescence to free intramitochondrial [Ca2+]. The kd was calculated by fitting the equation to a calibration curve constructed with multiple pulses of 5mM CaCl2 added to a reaction identical to the one above and also in the presence of 2 μM of the ionophore A23187, 5 μg/ml Oligomycin and 5 μM FCCP. From this experiment we determined the Kd = 16.34 μM. (A) Representative Calcium Green traces converted to extramitochondrial [Ca2+] from Control and CKO mitochondria (blue and red traces respectively). The corresponding effects in intramitochondrial free calcium recorded simultaneously are shown below in panel D. The TMRM signal monitoring ΔΨm was omitted from these graphs for simplicity. The end of the experiment is determined when there is no more mitochondrial uptake and calcium is released into the medium. (B) Representative Fura-FF ratio traces converted to free (unbuffered) intramitochondrial [Ca2+] from Control and CKO mitochondria. The increases in free intramitochondrial calcium correspond to the additions of external calcium shown in A above. (C-D) Per addition and total Ca uptake in Control and CKO mitochondria. Results are reported as nanomoles calcium/mg mitochondrial protein. Each n represents a different mitochondrial preparation obtained from a pool of 3 hearts of the same group. P values indicated above the brackets represent assessment by two tailed t-tests. (E-F) Representative traces of oxygen consumption rate (OCR) normalized to mitochondrial protein concentration. Arrows indicate the sequential additions of substrates (Glutamate/Malate 5 mM each in E, Succinate/Rotenone 5 mM and 1 μM respectively in F), followed by ADP (1 mM), oligomycin (1 μg/ml) and the uncoupler dinitrophenol (DNP, 75 μM). Each datapoint represents the average of 16–24 wells within each group (± SEM) and three time points are collected for each stage of the experiment. Each run is conducted with mitochondria isolated from a combined pool of three hearts of the same genotype group. (G-H) Summarized results of OCR in Control and CKO mitochondria energized by Glutamate/Malate (G) or Succinate/Rotenone (H). Bars represent means ± SEM and each datapoint (open circle) indicates a separate mitochondrial prep obtained from a pool of three hearts of the same genotype (n ranges from 4–8 in the various conditions/groups). No significant differences are observed between the two groups within a given respiratory state.
Figure 7.
Figure 7.. Response of ROMK Control and CKO hearts subjected to IR injury.
(A) Monitoring of rate pressure product (RPP) in Control and CKO hearts undergoing 35 min baseline perfusion followed by 30 min. global ischemia (grey area) and 1 hr. of reperfusion (I/R protocol). (B) Monitoring of coronary perfusion pressure (CPP). Dots represent within-group means and whiskers are standard errors of the mean. (C) Re-plotting data from A to examine post-ischemic RPP recovery within each genotype. (D-E) Post-ischemic recovery of systolic and diastolic function assessed by dp/dtmax and dp/dtmin respectively. Means comparisons between Control and CKO hearts for the three indexes (RPP, dp/dtmax and dp/dtmin) were performed with 2way repeated measures ANOVA. (F) Representative photos of heart slices stained with TTC at the end of reperfusion. Infarct areas (white) are delineated. (G) Infarct size (%) in Control and CKO hearts. Boxes cover the 25–75% range of data, the mean is shown as a solid circle and the median as a line. Whiskers cover the 5–95% range (see also inset legend). The n values used in the analysis are indicated below each group. Means comparisons were performed with unpaired student’s t-test. (H) Representative photos of heart slices stained with Evans blue and TTC at the end of 24 hrs of in vivo reperfusion (ischemic injury induced by 45 min. of LAD occlusion and reopening in vivo). (I) Area percentages (%) for the two experimental groups. Bars show the mean and whiskers cover the SEM (1.5 coeff.). Unpaired t-tests assuming unequal variance were applied within each category to evaluate differences in means between Ctrl and CKO and P values are indicated. N=9 Ctrl and 8 CKO mice.
Figure 8.
Figure 8.. Responses of ROMK Control and CKO hearts subjected to ex vivo IR injury with or without IPC.
Infarct size (%) across the four experimental groups of hearts perfused in the constant pressure mode. The I/R perfusion protocol is 20 min baseline perfusion followed by 20 min ischemia and 1.5 hr of reperfusion whereas the IPC + I/R protocol is 20 min baseline followed by 4 cycles of occlusion/reperfusion (5 min each) and then index ischemia and reperfusion as above. Means comparisons were performed with 2way ANOVA followed by Bonferroni’s post hoc tests to detect significant differences between groups as indicated on the graph. Box plots signify the 25–75% range of data and whiskers the 5–95% range of data. The horizonal line inside the box indicates the median and the dot the mean. The mean values are also indicated next to the dot. Data outside the 1.5 IQR were considered outliers and were removed from the analysis.

Similar articles

Cited by

References

    1. Nichols CG. KATP channels as molecular sensors of cellular metabolism. Nature. 2006;440(7083):470–6. - PubMed
    1. Miki T, Nagashima K, Tashiro F, Kotake K, Yoshitomi H, Tamamoto A, et al. Defective insulin secretion and enhanced insulin action in KATP channel-deficient mice. Proceedings of the National Academy of Sciences. 1998;95(18):10402–6. - PMC - PubMed
    1. Flagg TP, Enkvetchakul D, Koster JC, Nichols CG. Muscle KATP channels: recent insights to energy sensing and myoprotection. Physiological reviews. 2010;90(3):799–829. - PMC - PubMed
    1. Garlid KD, Paucek P, Yarov-Yarovoy V, Sun X, Schindler PA. The mitochondrial K channel as a receptor for potassium channel openers. Journal of Biological Chemistry. 1996;271(15):8796–9. - PubMed
    1. Liu Y, Sato T, O’Rourke B, Marban E. Mitochondrial ATP-dependent potassium channels: novel effectors of cardioprotection? Circulation. 1998;97(24):2463–9. - PubMed

Publication types

MeSH terms