

Spatiotemporal variability in case fatality ratios for the 2013-2016 Ebola epidemic in West Africa
- PMID: 32004692
- PMCID: PMC7191269
- DOI: 10.1016/j.ijid.2020.01.046
Spatiotemporal variability in case fatality ratios for the 2013-2016 Ebola epidemic in West Africa
Abstract
Background: For the 2013-2016 Ebola epidemic in West Africa, the largest Ebola virus disease (EVD) epidemic to date, we aim to analyse the patient mix in detail to characterise key sources of spatiotemporal heterogeneity in the case fatality ratios (CFR).
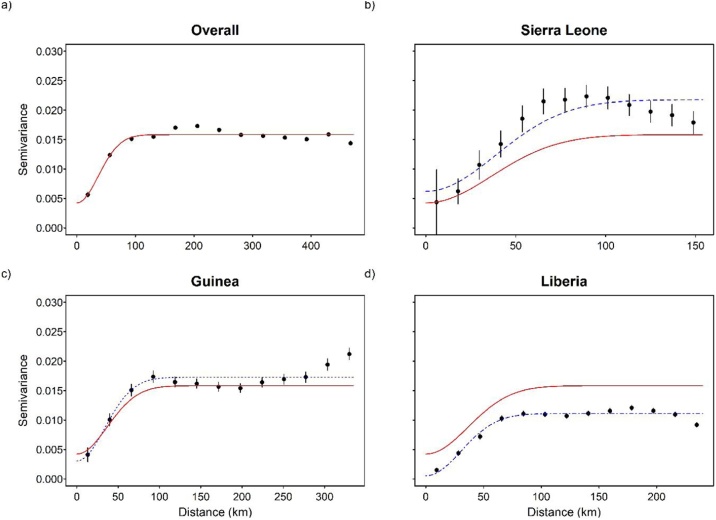
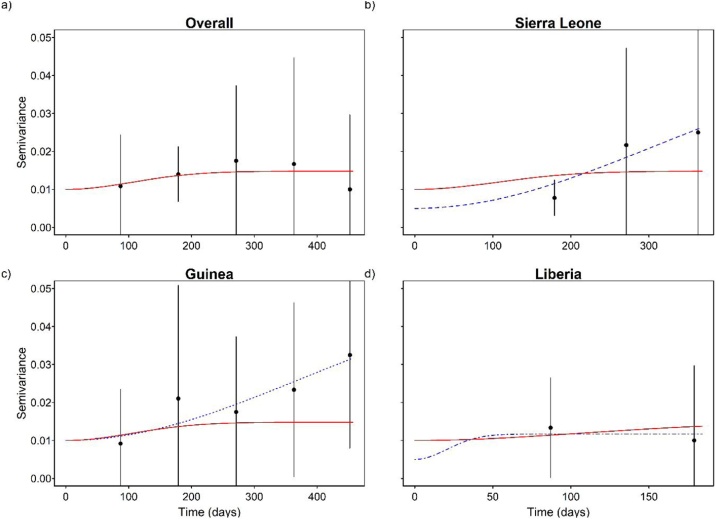
Methods: We applied a non-parametric Boosted Regression Trees (BRT) imputation approach for patients with missing survival outcomes and adjusted for model imperfection. Semivariogram analysis and kriging were used to investigate spatiotemporal heterogeneities.
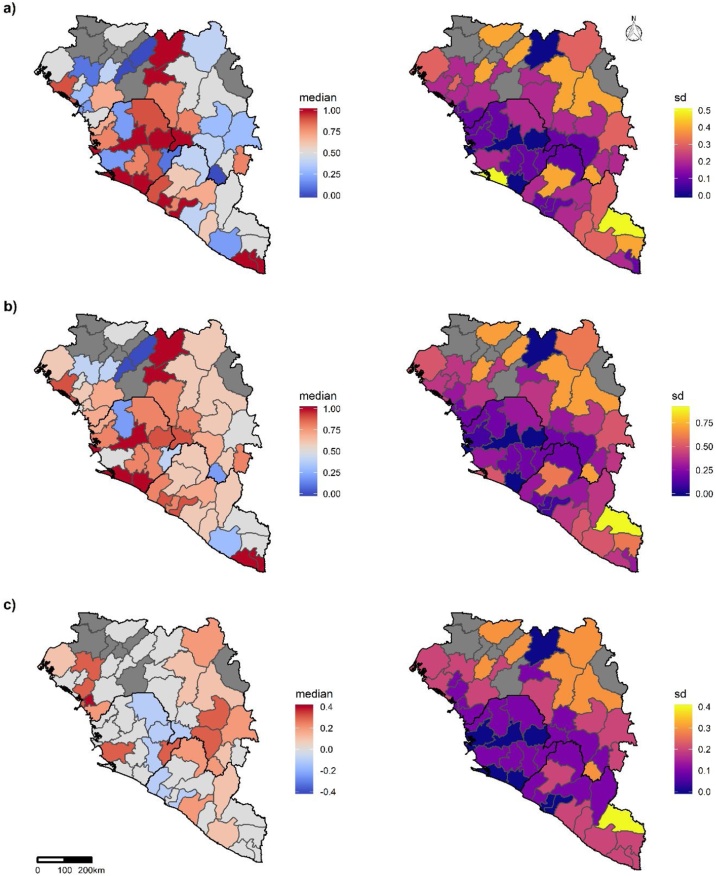
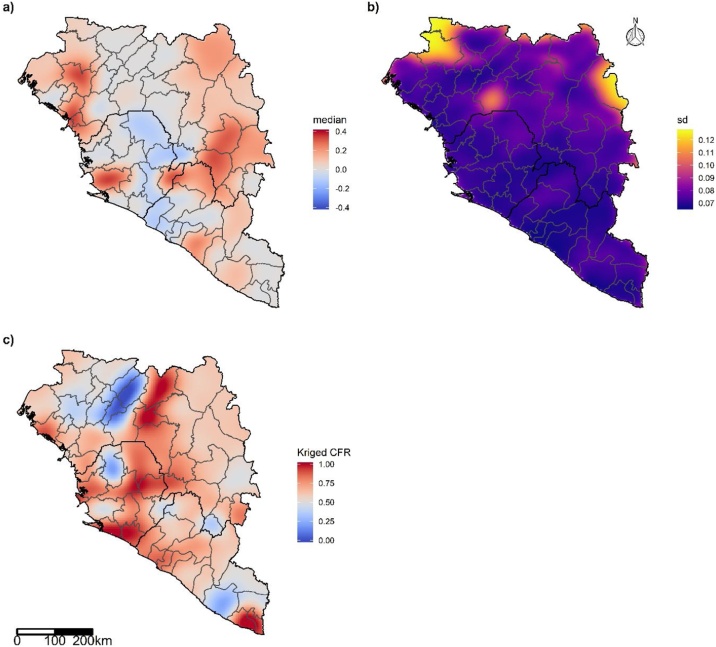
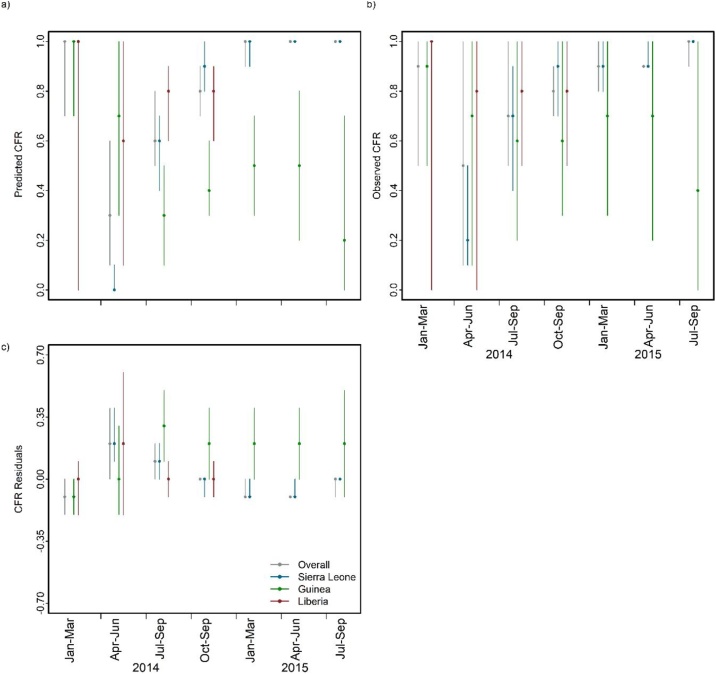
Results: CFR estimates varied significantly between districts and over time over the course of the epidemic. BRT modelling accounted for most of the spatiotemporal variation and interactions in CFR, but moderate spatial autocorrelation remained for distances up to approximately 90 km. Combining district-level CFR estimates and kriged district-level residuals provided the best linear unbiased predicted map of CFR accounting for the both explained and unexplained spatial variation. Temporal autocorrelation was not observed in the district-level residuals from the BRT estimates.
Conclusions: This study provides new insight into the epidemiology of the 2013-2016 West African Ebola epidemic with a view of informing future public health contingency planning, resource allocation and impact assessment. The analytical framework developed in this analysis, coupled with key domain knowledge, could be deployed in real time to support the response to ongoing and future outbreaks.
Keywords: Case fatality ratio; Ebola; Spatiotemporal analysis; Variogram; West Africa.
Copyright © 2020 The Author(s). Published by Elsevier Ltd.. All rights reserved.
Figures
References
-
- Abdulhafedh A. How to detect and remove temporal autocorrelation in vehicular crash data. J Transp Technol. 2017;7(02):133.
-
- Anselin L. Local indicators of spatial association—LISA. Geog Anal. 1995;27(2):93–115.
-
- Barry A., Ahuka-Mundeke S., Ahmed Y.A., Allarangar Y., Anoko J., Archer B.N. Outbreak of Ebola virus disease in the Democratic Republic of the Congo, April–May, 2018: an epidemiological study. The Lancet. 2018;392(10143):213–221. - PubMed
-
- Bivand R.S., Wong D.W. Comparing implementations of global and local indicators of spatial association. Test. 2018;27(3):716–748.
MeSH terms
Grants and funding
LinkOut - more resources
Full Text Sources
Medical
