

Transcriptomic response to three osmotic stresses in gills of hybrid tilapia (Oreochromis mossambicus female × O. urolepis hornorum male)
- PMID: 32005144
- PMCID: PMC6995152
- DOI: 10.1186/s12864-020-6512-5
Transcriptomic response to three osmotic stresses in gills of hybrid tilapia (Oreochromis mossambicus female × O. urolepis hornorum male)
Abstract
Background: Osmotic stress is a widespread phenomenon in aquatic animal. The ability to cope with salinity stress and alkaline stress is quite important for the survival of aquatic species under natural conditions. Tilapia is an important commercial euryhaline fish species. What's more tilapia is a good experimental material for osmotic stress regulation research, but the molecular regulation mechanism underlying different osmotic pressure of tilapia is still unexplored.
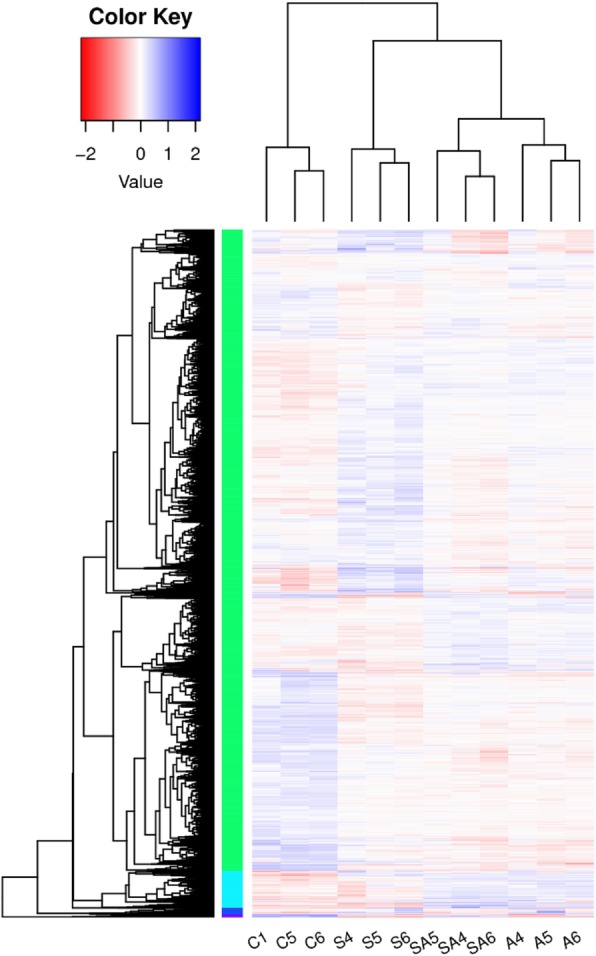
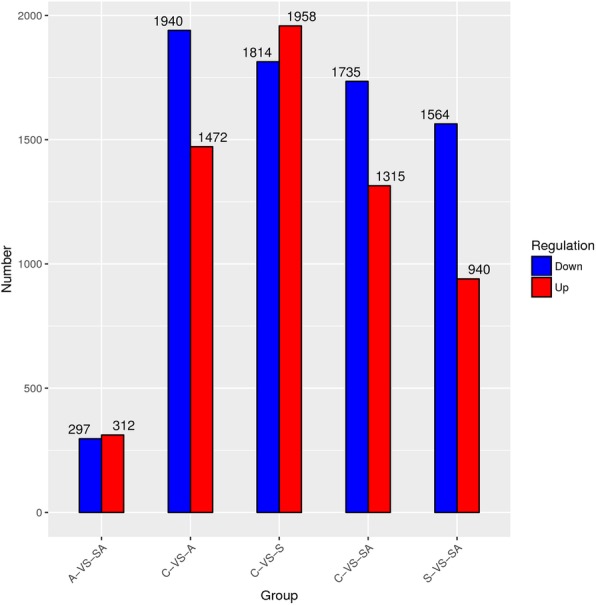
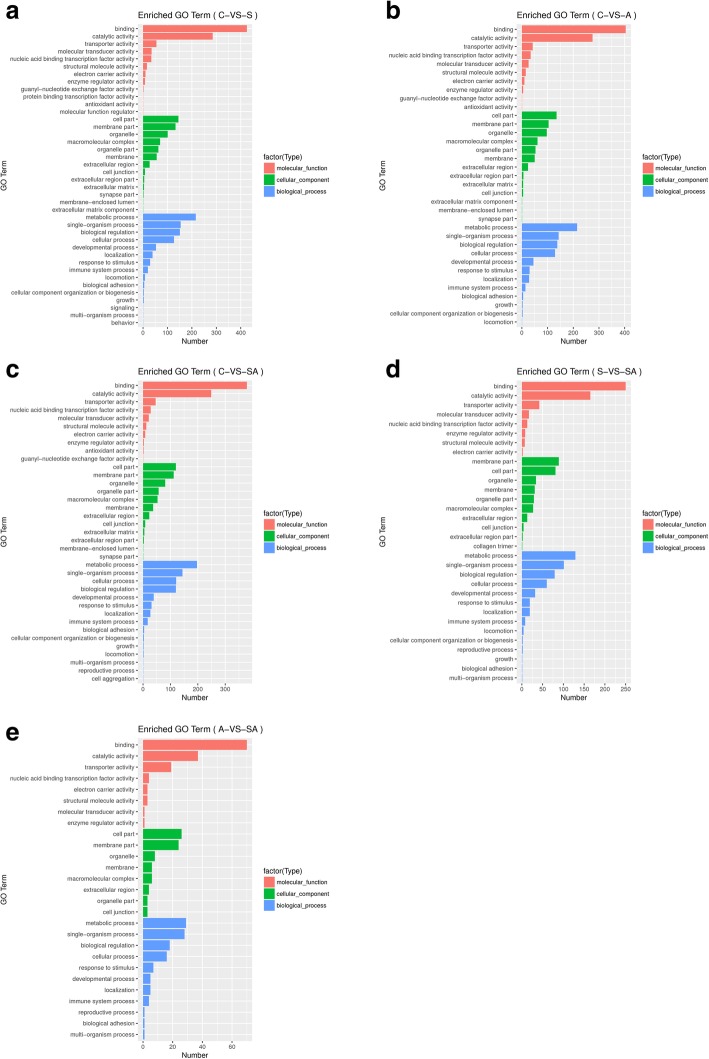
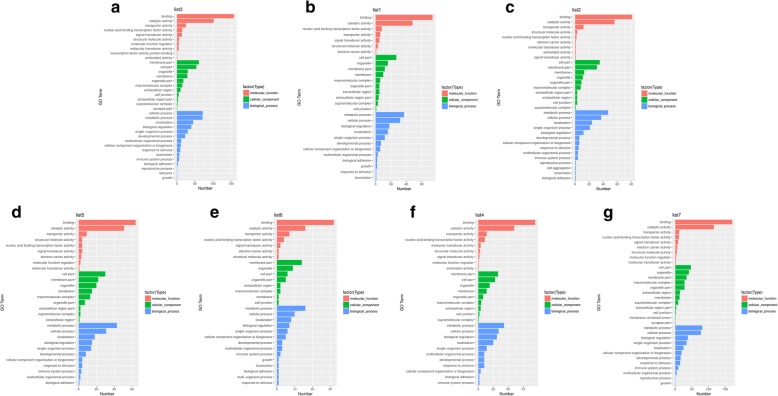
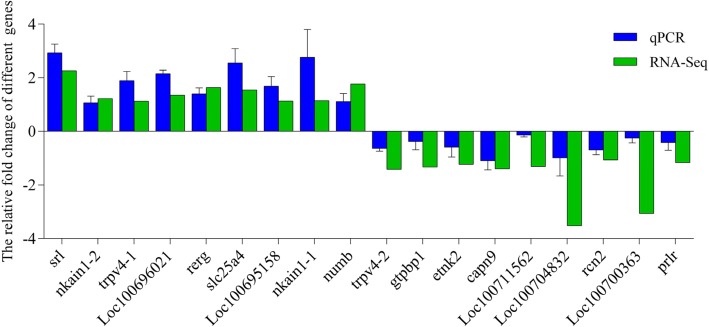
Results: To elucidate the osmoregulation strategy behind its hyper salinity, alkalinity and salinity-alkalinity stress of tilapia, the transcriptomes of gills in hybrid tilapia (Oreochromis mossambicus ♀ × O. urolepis hornorum ♂) under salinity stress (S: 25‰), alkalinity stress(A: 4‰) and salinity-alkalinity stress (SA: S: 15‰, A: 4‰) were sequenced using deep-sequencing platform Illumina/HiSeq-2000 and differential expression genes (DEGs) were identified. A total of 1958, 1472 and 1315 upregulated and 1824, 1940 and 1735 downregulated genes (P-value < 0.05) were identified in the salt stress, alkali stress and saline-alkali stress groups, respectively, compared with those in the control group. Furthermore, Kyoto Encyclopedia of Genes and Genomes pathway analyses were conducted in the significant different expression genes. In all significant DEGs, some of the typical genes involved in osmoregulation, including carbonic anhydrase (CA), calcium/calmodulin-dependent protein kinase (CaM kinase) II (CAMK2), aquaporin-1(AQP1), sodium bicarbonate cotransporter (SLC4A4/NBC1), chloride channel 2(CLCN2), sodium/potassium/chloride transporter (SLC12A2 / NKCC1) and other osmoregulation genes were also identified. RNA-seq results were validated with quantitative real-time PCR (qPCR), the 17 random selected genes showed a consistent direction in both RNA-Seq and qPCR analysis, demonstrated that the results of RNA-seq were reliable.
Conclusions: The present results would be helpful to elucidate the osmoregulation mechanism of aquatic animals adapting to saline-alkali challenge. This study provides a global overview of gene expression patterns and pathways that related to osmoregulation in hybrid tilapia, and could contribute to a better understanding of the molecular regulation mechanism in different osmotic stresses.
Keywords: Osmoregulation; Osmotic stress; Tilapia; Transcriptome.
Conflict of interest statement
The authors declare that they have no competing interests.
Figures
References
-
- De Lisle PF, Roberts MH., Jr The effect of salinity on cadmium toxicity to the estuarine mysid Mysidopsis bahia: role of chemical speciation. Aquat Toxicol. 1998;12(4):357–370. doi: 10.1016/0166-445X(88)90062-8. - DOI
-
- McFarland K, Ludovic D, Aswani KV. Effect of acute salinity changes on hemolymph osmolality and clearance rate of the nonnative mussel, Perna viridis, and the native oyster, Crassostrea virginica, in Southwest Florida. Aquat Invasions. 2013;8(3):299–310. doi: 10.3391/ai.2013.8.3.06. - DOI
-
- Chong-Robles J, Charmantier G, Boulo V, Lizárraga-Valdéz J, Enríquez-Paredes L, Giffard-Mena I. Osmoregulation pattern and salinity tolerance of the white shrimp Litopenaeus vannamei (Boone, 1931) during post-embryonic development. Aquaculture. 2014;422(423):261–267. doi: 10.1016/j.aquaculture.2013.11.034. - DOI
MeSH terms
Substances
Grants and funding
- 201803020034/Guangzhou Science and Technology Program key projects
- 2019KQ - 003/Central Public-interest Scientific Institution Basal Research Fund, CAFS
- 2019KJ150/the Guangdong Provincial Special Fund For Modern Agriculture Industry Technology Innovation Teams
- 31001108/National Natural Science Foundation of China
- 2019DKA30470/National Freshwater Genetic Resource Center
LinkOut - more resources
Full Text Sources
