. 2020 Jan 31;21(1):109.
doi: 10.1186/s12864-020-6525-0.

Transcriptome analyses of liver in newly-hatched chicks during the metabolic perturbation of fasting and re-feeding reveals THRSPA as the key lipogenic transcription factor

Affiliations

Transcriptome analyses of liver in newly-hatched chicks during the metabolic perturbation of fasting and re-feeding reveals THRSPA as the key lipogenic transcription factor

Larry A Cogburn et al. BMC Genomics. .

Abstract

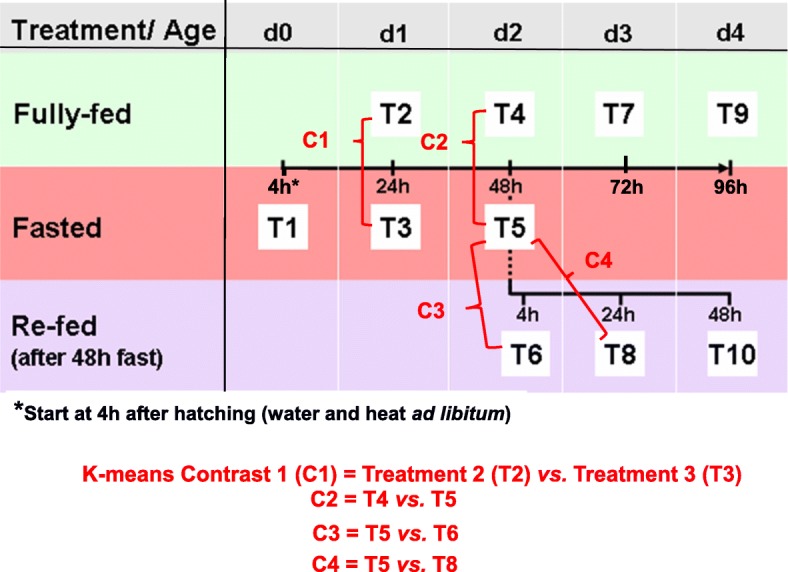
Background: The fasting-refeeding perturbation has been used extensively to reveal specific genes and metabolic pathways that control energy metabolism in the chicken. Most global transcriptional scans of the fasting-refeeding response in liver have focused on juvenile chickens that were 1, 2 or 4 weeks old. The present study was aimed at the immediate post-hatch period, in which newly-hatched chicks were subjected to fasting for 4, 24 or 48 h, then refed for 4, 24 or 48 h, and compared with a fully-fed control group at each age (D1-D4).

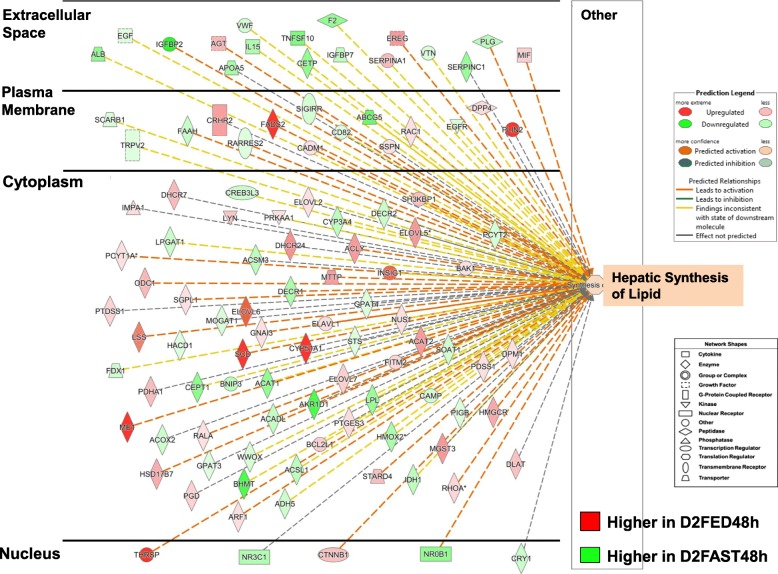
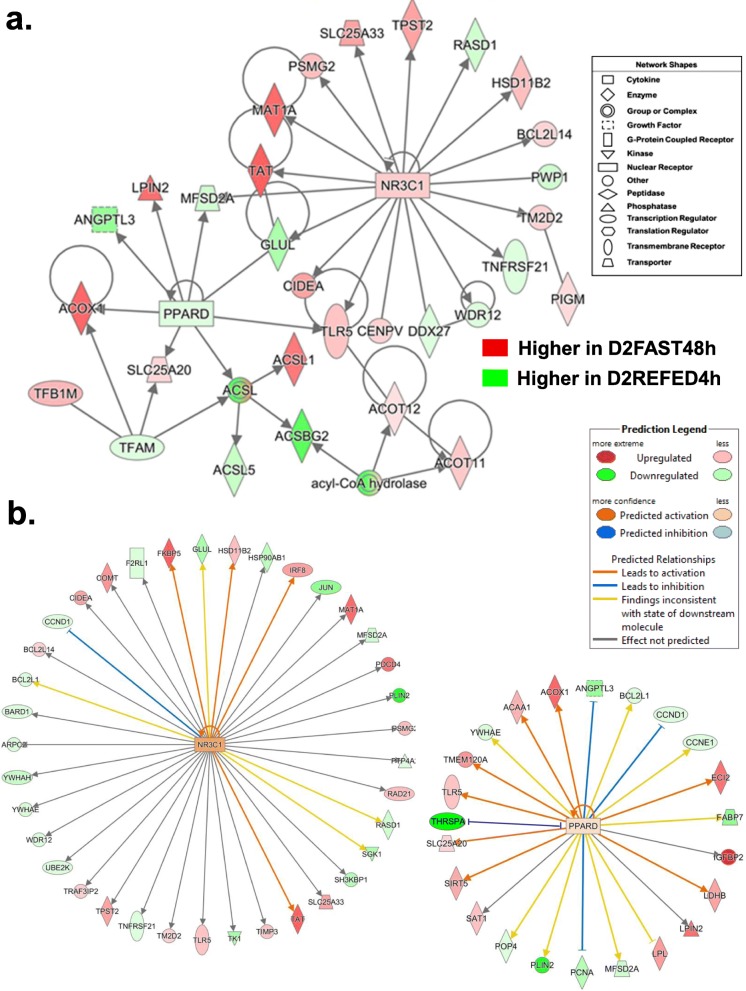
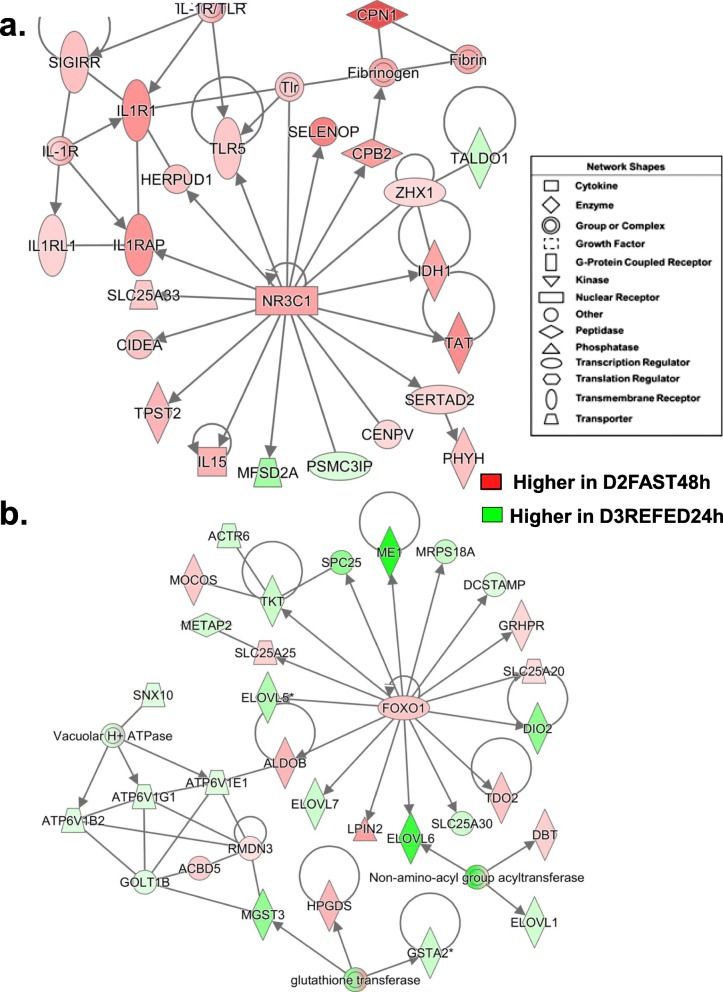
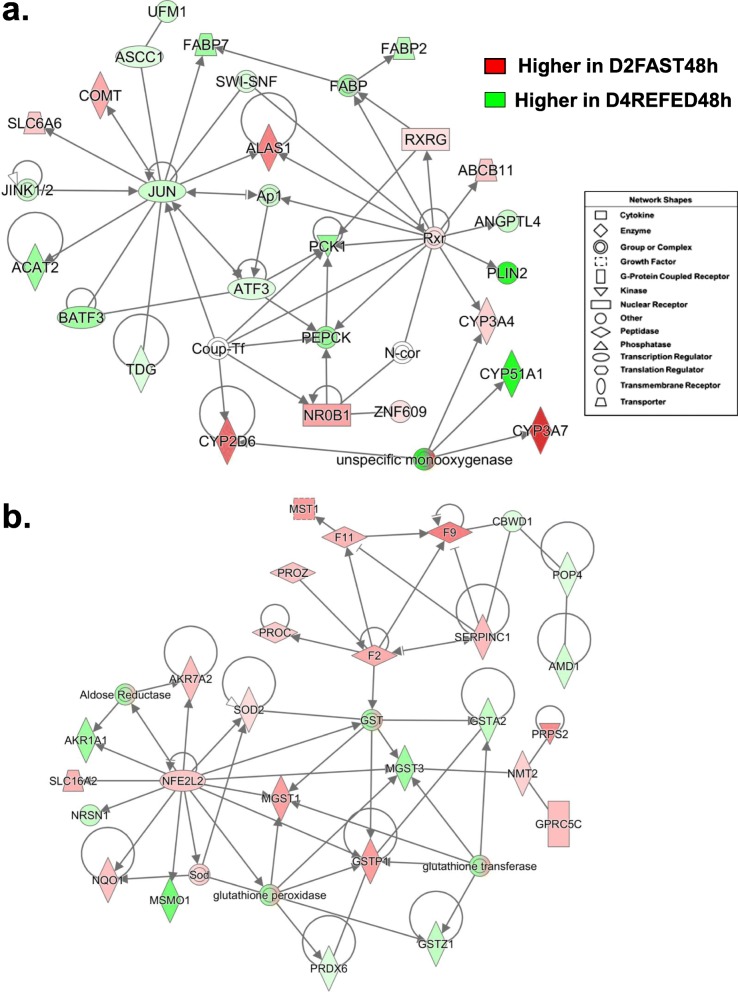
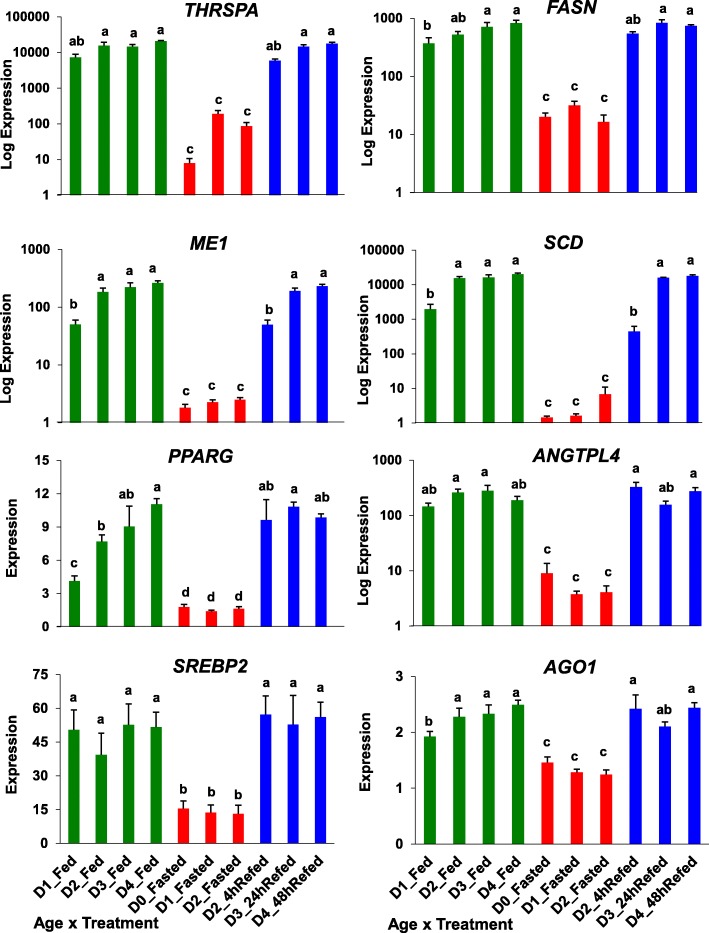
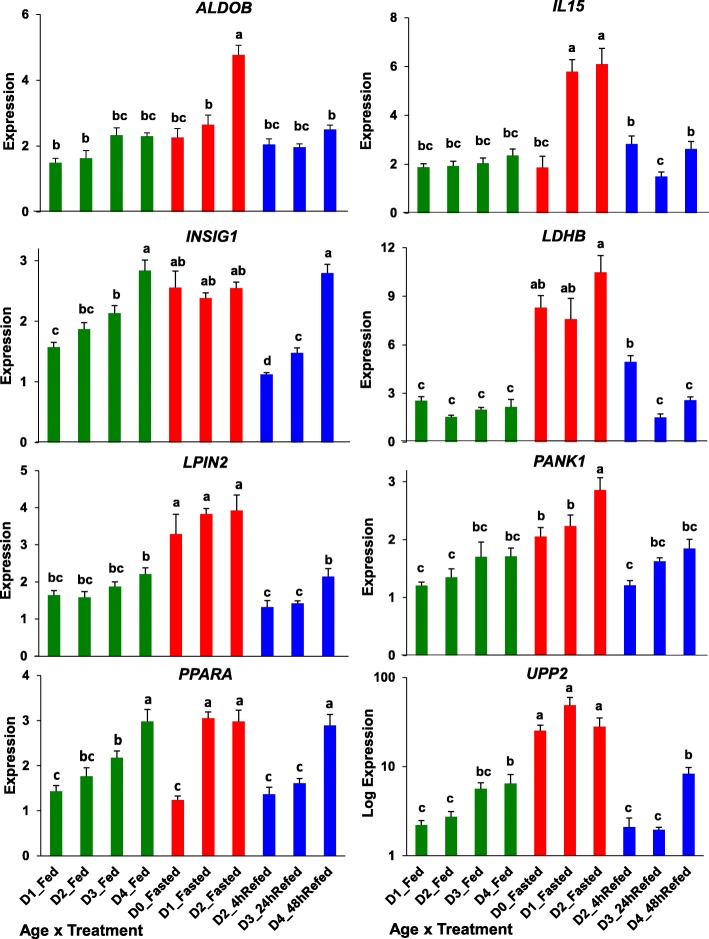
Results: Visual analysis of hepatic gene expression profiles using hierarchical and K-means clustering showed two distinct patterns, genes with higher expression during fasting and depressed expression upon refeeding and those with an opposing pattern of expression, which exhibit very low expression during fasting and more abundant expression with refeeding. Differentially-expressed genes (DEGs), identified from five prominent pair-wise contrasts of fed, fasted and refed conditions, were subjected to Ingenuity Pathway Analysis. This enabled mapping of analysis-ready (AR)-DEGs to canonical and metabolic pathways controlled by distinct gene interaction networks. The largest number of hepatic DEGs was identified by two contrasts: D2FED48h/D2FAST48h (968 genes) and D2FAST48h/D3REFED24h (1198 genes). The major genes acutely depressed by fasting and elevated upon refeeding included ANGTPL, ATPCL, DIO2, FASN, ME1, SCD, PPARG, SREBP2 and THRSPA-a primary lipogenic transcription factor. In contrast, major lipolytic genes were up-regulated by fasting or down-regulated after refeeding, including ALDOB, IL-15, LDHB, LPIN2, NFE2L2, NR3C1, NR0B1, PANK1, PPARA, SERTAD2 and UPP2.

Conclusions: Transcriptional profiling of liver during fasting/re-feeding of newly-hatched chicks revealed several highly-expressed upstream regulators, which enable the metabolic switch from fasted (lipolytic/gluconeogenic) to fed or refed (lipogenic/thermogenic) states. This rapid homeorhetic shift of whole-body metabolism from a catabolic-fasting state to an anabolic-fed state appears precisely orchestrated by a small number of ligand-activated transcription factors that provide either a fasting-lipolytic state (PPARA, NR3C1, NFE2L2, SERTAD2, FOX01, NR0B1, RXR) or a fully-fed and refed lipogenic/thermogenic state (THRSPA, SREBF2, PPARG, PPARD, JUN, ATF3, CTNNB1). THRSPA has emerged as the key transcriptional regulator that drives lipogenesis and thermogenesis in hatchling chicks, as shown here in fed and re-fed states.

Keywords: Gene interaction networks; Homeorhesis; Lipid metabolism; Lipogenesis; Lipolysis; Metabolic switch; Reciprocal inhibition/activation; Spot 14 (THRSPA); THRSP paralogs; Target genes; Thermogenesis; Up-stream regulators; ying-yang metabolic regulation.


Conflict of interest statement

The authors declare that they have no competing interests.

Figures

Fig. 1
Fig. 1
Body weight (a) and plasma metabolite [glucose (b), triglycerides (c) and (d) non-esterified fatty acids (NEFA)] responses of hatchling chicks. Each value represents the least square mean (LSM) and error (LSE) of five cockerels. The first three data points represent fasting treatment levels (D0FAST4h; D1FAST24h and D2FAST48h), while the last three data points (shaded area) represent refeeding treatment levels (D2REFED4h, D3REFED24h and D4REFED48h). The analysis of variance (ANOVA), using Type III error, indicates overall level of significance (*P ≤ 0.05; ***P ≤ 0.0001) for the main effects of fasting-refeeding treatments (T) and age (A), and their interaction (T x A) [shown in shaded area]. A single asterisk, below or above treatment points, indicates a significant difference (P ≤ 0.05) for each pairwise contrast between a fully-fed (FED) control group and a fasting-refeeding treatment. Note that the D2FED control group was used for both the D2FAST48h and D2REFED4h contrast
Fig. 2
Fig. 2
Initial hierarchical clustering analysis of differentially-expressed genes (DEGs) (P ≤ 0.05) identified in liver of newly-hatchling chicks during the fasting-refeeding perturbation (Panel a). This heat map, representing two-way hierarchical clustering of 1170 DEGs (Y-axis) across 10 treatment groups (X-axis), shows two major clusters of DE genes that are either up-regulated (Cluster A) or down-regulated (Cluster B) by fasting (4, 24 and 48 h) after hatch. In contrast, Cluster A genes are down-regulated in the fully-fed (FED) and refed (REFED) groups on day 3(D3) and D4, whereas Cluster B genes are up-regulated after refeeding and in FED groups on D2, D3 and D4. Panel b. K-means cluster plots of DEGs (log2 FC) identified in four contrasts of fasting [C1 = D1FED vs. D1FAST24h; and C2 = D2FED vs. D2FAST48h) and refeeding (C3 = D2FAST48h vs. D3REFED4h; and C4 = D2FAST48 vs. D3REFED24h). K-means analysis revealed two distinct gene expression patterns, each composed of four clusters of DEGs identified by microarray and statistical analysis. Four distinct K-means clusters of lipogenic genes were down-regulated by fasting and sharply rebounded at 4 h or 24 h after refeeding. In contrast, four other clusters represent lipolytic genes whose expression was up-regulated by fasting and sharply down-regulated after refeeding. The original responses showed positive or negative log2 FC values which represent down-regulation or up-regulation by fasting, respectively. Further, positive or negative log2 FC means indicates either down-regulation or up-regulation caused by re-feeding for either 4 h or 24 h after a 48 h fast, respectively. However, the log2 FC values shown here were multiplied by − 1 to make the relative expression (log2 fold-change) either positive for up-regulation or negative for down-regulation of gene expression. Several examples of major metabolic DEGs are provided for each cluster. An annotated list of DEGs identified in each K-means cluster is provided in Additional file 1, which also includes a composite graph of all K-means clusters including the low-amplitude changes in Clusters 4 and 8, both of which were down-regulated with fasting and sharply up-regulated with refeeding
Fig. 3
Fig. 3
Stacked-bar graph of seven pairwise treatment contrasts showing the highest numbers of up-regulated and down-regulated “Analysis Ready” (AR)-DEGs among the 45 possible pairwise contrasts of 10 treatment conditions (Panel a). The Venn diagrams provide the numbers of unique and commonly shared AR-DEGs found within the meaningful contrasts. The Venn diagram in Panel b compared three contrasts of AR-DEGs in chicks that were either fasted for 4 h immediately after hatching (D0FAST4h), fasted for 24 h (D1FAST24h) or fasted for 48 h (D2FAST48h) versus chicks that were either fully-fed for 24 h (D1FED24h) or 48 h (D2FED48h). Likewise, the recovery from prolonged fasting (D2FAST48h) was examined by three refeeding contrasts (D2REFED4h, D3REFED24h or D4REFED48h) (Panel c). The number of AR-DEGs found in each contrast is shown in brackets, while numbers within arcs represents genes shared between or among contrasts. Annotated lists of AR-DEGs found in the five contrasts are provided by multiple worksheets in Additional file 3
Fig. 4
Fig. 4
A gene interaction network (Panel a) of lipogenic (green symbols) and lipolytic (red symbols) AR-DEGS found in the D1FED24h vs. D1FAST24h contrast. This gene network was functionally annotated by IPA as “Lipid Metabolism/Molecular Transport”. These genes are differentially regulated by two transcription factors [catenin beta 1 (CTNNB1) and activating transcription factor 4 (ATF4)]. Ingenuity® Upstream Regulator Analysis identified additional direct targets for each transcription factor (Panel b) and predicts that CTNNB1 should be inhibited due to down-regulation of its eight direct target genes (EGFR, EPCAM, EPHB2, IGFBP2, IRF8, LY6E, SESN1 and CYB5A), although the expression of CTNNB1 and seven direct target genes were up-regulated (i.e., higher in D1FED24h). Ingenuity correctly predicted activation of ATF4 and up-regulation of four direct target genes including CTNNB1 and another transcription factor, Jun proto-oncogene, AP-1 transcription factor subunit (JUN)
Fig. 5
Fig. 5
Subcellular distribution of 107 AR-DEGs functionally annotated by IPA as “Concentration of Lipids” from the D2FED48h vs. D2FAST48h contrast. This figure provides an overview of the transcriptional hierarchy of hepatic genes that control the concentration of lipids. Genes with red symbols are expressed higher in liver of D2FED48h cockerels, while green symbols indicate higher hepatic expression in the D2FAST48h treatment. A group of five upstream regulators control transcription of numerous metabolic enzymes, transporters, kinases and phosphatases in the cytoplasm, several transmembrane receptors, G-protein-coupled receptors, peptidases and enzymes in the plasma membrane, and even fewer growth factors, transporters and enzymes found in extracellular space. IPA predicts that the concentration of lipid in liver would be inhibited by the eight up-regulated transcription factors as indicated by the dashed blue lines, while yellow dashed lines represent inconsistence between the expected state and observed state of downstream genes. An annotated list of these 107 AR-DEGs controlling concentration of lipid is provided in Additional file 4
Fig. 6
Fig. 6
This gene network, identified in the D2FAST48h vs. D2REFED4h contrast, shows interactions between two transcription factors [nuclear receptor subfamily 3 group C member 1 (NR3C1) and peroxisome proliferator activated receptor delta (PPARD)] and their respective direct target genes (Panel a). This network was functionally annotated by IPA as “Endocrine Function” and “Lipid Metabolism”. Ingenuity Upstream Analysis predicts activation of NR3C1 (glucocorticoid receptor, GCR; Panel b), based on 18 up-regulated and 20 down-regulated AR-DEGs and slightly activated PPARD, based on the up-regulated state of 12 direct targets (red gene symbols) compared to 11 down-regulated genes (green gene symbols). Actually, the green gene symbols indicate higher expression in liver of D2REFED4h cockerels, while red gene symbols indicate higher expression in the D2FAST48h treatment group
Fig. 7
Fig. 7
This “Lipid Metabolism” network (Panel a) is centered on interactions of three transcription factors, thyroid hormone-responsive Spot14 protein (THRSP), sterol response element binding factor 2 (SREBF2) and nuclear factor, erythroid 2-like 2 (NFE2L2) and their direct target genes from the D2FAST48h vs. D2REFED4h contrast. IPA predicted activation (orange lines and arrows) or inhibition (blue lines) of direct targets of SREBF2 identified in the D2FAST48h vs. D2REFED4h contrast (Panel b). Of the 22 direct target genes identified, only six AR-DEGs were expressed at higher levels in liver of D2FAST48h chicks. As such, Ingenuity predicts that SREBF2 should be inhibited (blue symbol), which would lead to inhibition (blue arrows/edges) of 16 DEGs (green symbols) that control lipogenesis under the direction of the most highly-expressed gene in liver of fed or refed cockerels— the lipogenic transcription factor THRSPA
Fig. 8
Fig. 8
A gene interaction network was identified in the D2FAST48h vs. D3RERFED24h contrast and functionally annotated by IPA as related to “Nutritional Disease” (Panel a). This gene network was centered on the interaction of the glucocorticoid receptor (NR3C1) and 16 direct target genes, including several components of the innate immune response/ inflammation (IL15, IL1RAP, TLR5 and HERPUD1) and regulators of lipolysis (SERTAD2 and CIDEA); all of which were highly expressed in liver of D2FAST48h chicks. Panel b shows another gene network related to “Lipid Metabolism” that involves the transcription factor forkhead 1 (FOX01) and its 16 direct targets that interact, via ALDOB, with three ATPases and glutathione transferases (GSTA2, MGST3 and HPGDS). The majority of the genes in this network are expressed higher in liver of D3REFED24h chicks, except FOX01, GRHPR, SLC25A20, IDO2, ALDOB and SLC25A25, which are up-regulated by the D2FAST48h treatment
Fig. 9
Fig. 9
Subcellular distribution of 97 AR-DEGs functionally annotated by IPA as “Concentration of Lipids” from the D2FED48h vs. D4REFED48h contrast. This figure provides an overview of the transcriptional hierarchy of hepatic genes that control the concentration of lipids, which was revealed by the D2FAST48h vs. D4REFED48h contrast. Genes with red symbols are expressed higher in liver of D2FAST48h cockerels, while green symbols indicate higher hepatic expression in the D4REFED48h treatment. A relatively small group of 15 upstream regulators control transcription of numerous metabolic enzymes, transporters, kinases and phosphatases in the cytoplasm, several transmembrane receptors, G-protein-coupled receptors, peptidases and enzymes in the plasma membrane, and even fewer numbers of growth factors, transporters and enzymes in extracellular space. IPA predicts that the concentration of lipid in liver would be inhibited by the eight up-regulated transcription factors as indicated by the dashed blue lines, while yellow dashed lines represent inconsistence between the expected state and observed of the downstream genes. The annotated list of these 97 AR-DEGs controlling concentration of lipid is provided in Additional file 6
Fig. 10
Fig. 10
A gene network depicting interactions among six transcription factors (JUN, RXR, NR0B1, AFT3, BATF3 and ASCC1) and their target genes identified from the D2FAST48h vs. D4REFED48h contrast (Panel a). Nine genes in this network, annotated by IPA as “Lipid Metabolism/Molecular Transport”, were expressed higher in liver of chicks under the D2FAST48h treatment, while 15 genes were expressed at higher levels in the D4REFED48h chicks. Ingenuity Up-stream Regulator Analysis (Panel b) predicts that Jun proto-oncogene, AP-1 transcription factor subunit (JUN) would be inhibited (blue gene symbol) and that seven of the 33 direct targets of JUN would be inhibited (blue arrows and green gene symbols), whereas only two target genes [5′-aminolevulinate synthase 1 (ALAS1) and myelin basic protein (MBP)] were predicted to be actively inhibited by JUN (blunt orange line). Another ligand-activated transcription factor, thyroid hormone-receptor beta (THRB), forms heterodimers with retinoid X receptor gamma (RXRG). Although not an AR-DEG itself, Ingenuity predicts that THRB would be inhibited which would lead to inhibition of six direct target genes (CTNNB1, ME1, PCK1, PPPCA, THRSPA and YWHAE), while two target genes (EGFR and EHHADH) would be actively blocked (blunt orange edge)
Fig. 11
Fig. 11
Verification of differential expression of eight lipogenic genes using qRT-PCR analysis. Nutritional state is indicated by bar color, where green = fed state, red = fasted, and blue = refed conditions. Values represent least-square means (LSM) and their standard error (LSE) of normalized expression levels of five cockerels (biological replicates) and two technical replicates. Expression levels, determined by qRT-PCR analysis, were normalized using the geNorm procedure in qBase software [59]. Values possessing different superscripts are significantly different as determined by analysis of variance (ANOVA) using the general linear models (GLM) procedure in Statistical Analysis System (SAS) software and with mean separation using Tukey’s Studentized Range Test
Fig. 12
Fig. 12
Verification of differential expression of eight lipolytic genes using qRT-PCR analysis. Nutritional state is indicated by bar color, where green = fed, red = fasted and blue = refed condition. Values represent least-square means (LSM) and their standard error (LSE) of normalized expression of five cockerels (biological replicates) analyzed in duplicate. Expression levels, determined by qRT-PCR analysis, were normalized using the geNorm procedure in qBase software [59]. Values possessing different superscripts are significantly different as determined by analysis of variance (ANOVA) using the general linear models (GLM) procedure in Statistical Analysis System (SAS) software and with mean separation using Tukey’s Studentized Range Test
Fig. 13
Fig. 13
Experimental design of the fasting and re-feeding perturbation in newly-hatched broiler chicks. Five newly-hatched male chicks were randomly assigned to 10 treatment groups (T1-T10). The chicks assigned to control fully-fed groups (D1FED24h or T2, D2FED48h or T4, D3FED72h or T7, and D4FED96h or T9) were provided with a commercial starter ration and water ad libitum from hatching (D0) until the time of tissue sampling. Fasting groups (D0FAST4h or T1, D1FAST24h or T3, and D2FAST48h or T5) of chicks were brooded with no access to feed (start after hatchling) for 4, 24 and 48 h, respectively. Chicks in the REFED groups (D2REFED4h or T6, D3REFED24h or T8 and D4REFED48h or T10) were fasted for 48 h and subsequently re-fed for 4, 24 and 48 h, respectively, prior to the time of tissue sampling

Similar articles

Cited by

References

    1. Cogburn LA, Wang X, Carré W, Rejto L, Porter TE, Aggrey SE, Simon J. Systems-wide chicken DNA microarrays, gene expression profiling and discovery of functional genes. Poult Sci. 2003;82:939–951. doi: 10.1093/ps/82.6.939. - DOI - PubMed
    1. Cogburn LA, Morgan R, Burnside J. Expressed sequence tags, DNA chip technology and gene expression profiling. In: Muir WM, Aggrey SE, editors. Poultry Genetics, Breeding and Biotechnology. Wallingford: CABI Publishing; 2003. pp. 629–646.
    1. Cogburn LA, Wang X, Carré W, Rejto L, Aggrey SE, Duclos MJ, Simon J, Porter TE. Functional genomics in chickens: development of integrated-systems microarrays for transcriptional profiling and discovery of regulatory pathways. Comp Funct Genom. 2004;5:253–261. doi: 10.1002/cfg.402. - DOI - PMC - PubMed
    1. Cogburn LA, Porter TE, Duclos MJ, Simon J, Burgess SC, Zhu JJ, Cheng HH, Dodgson JB, Burnside J. Functional genomics of the chicken--a model organism. Poult Sci. 2007;86:2059–2094. doi: 10.1093/ps/86.10.2059. - DOI - PubMed
    1. Cogburn LA, Trakooljul N, Chen C, Huang H, Wu CH, Carré W, Wang X, White HB. Transcriptional profiling of liver during the critical embryo-to-hatchling transition period in the chicken (Gallus gallus) BMC Genomics. 2018;19:695. doi: 10.1186/s12864-018-5080-4. - DOI - PMC - PubMed

Substances