. 2020 Jan 31;21(1):111.
doi: 10.1186/s12864-020-6530-3.

A systemic approach to screening high-throughput RT-qPCR data for a suitable set of reference circulating miRNAs

Affiliations

A systemic approach to screening high-throughput RT-qPCR data for a suitable set of reference circulating miRNAs

Konrad Pagacz et al. BMC Genomics. .

Abstract

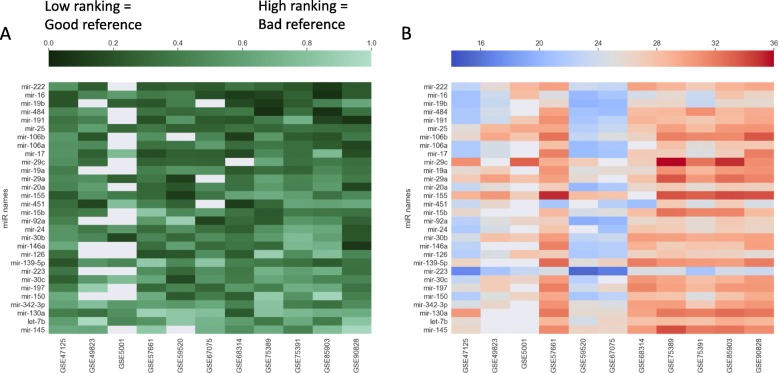
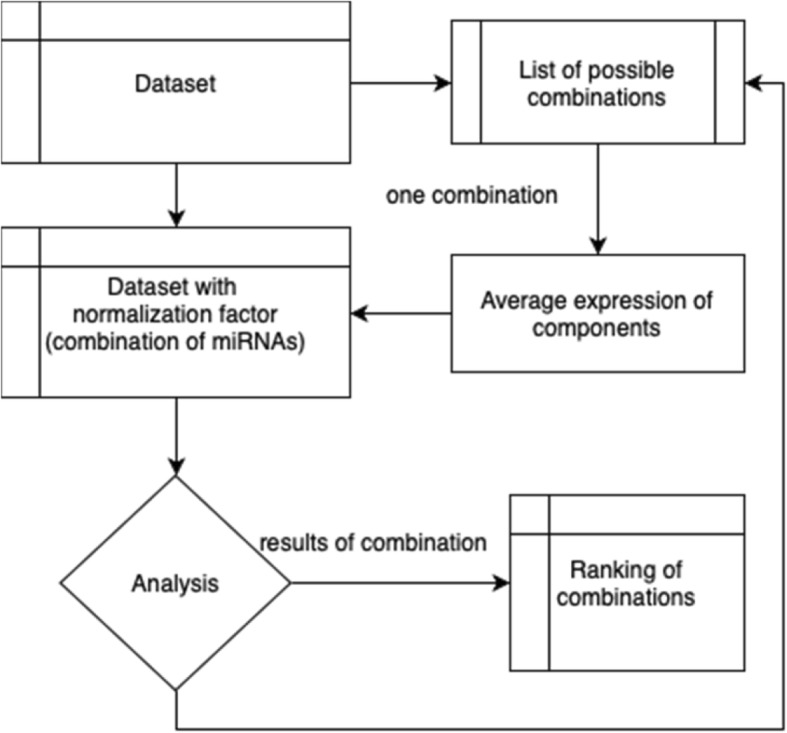
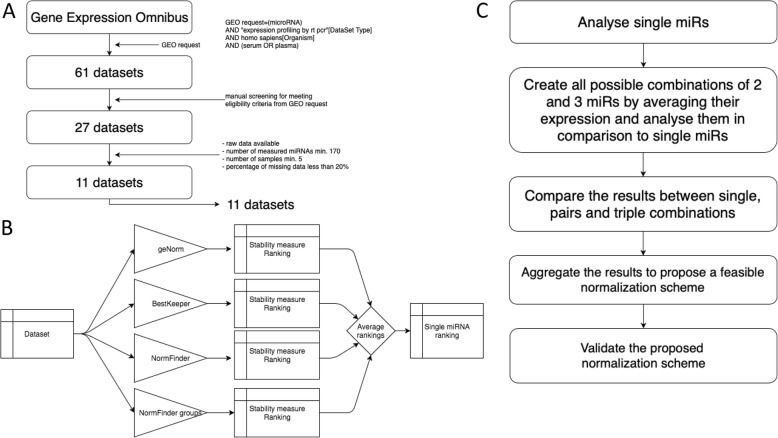
Background: The consensus on how to choose a reference gene for serum or plasma miRNA expression qPCR studies has not been reached and none of the potential candidates have yet been convincingly validated. We proposed a new in silico approach of finding a suitable reference for human, circulating miRNAs and identified a new set of endogenous reference miRNA based on miRNA profiling experiments from Gene Expression Omnibus. We used 3 known normalization algorithms (NormFinder, BestKeeper, GeNorm) to calculate a new normalization score. We searched for a universal set of endogenous miRNAs and validated our findings on 2 new datasets using our approach.

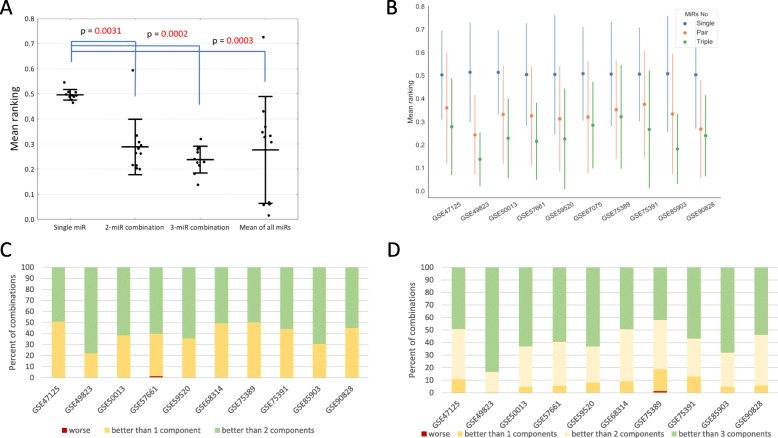
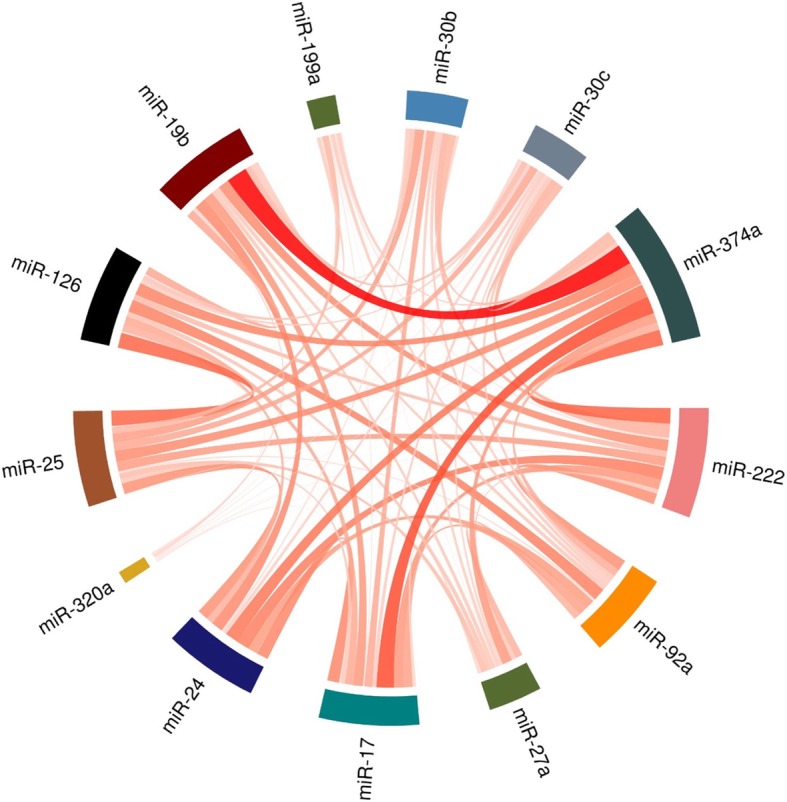
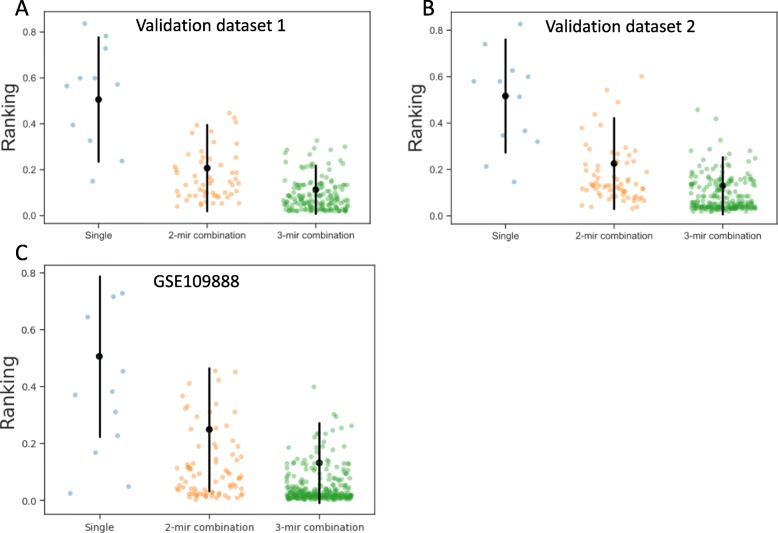
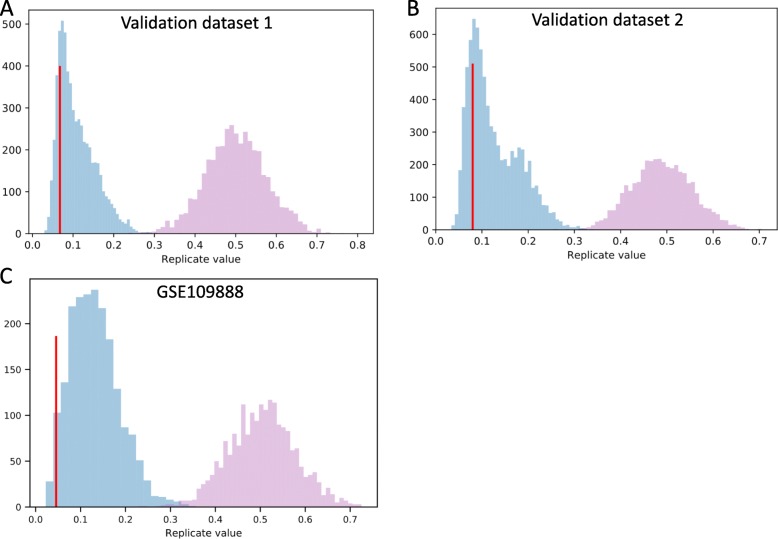
Results: We discovered and validated a set of 13 miRNAs (miR-222, miR-92a, miR-27a, miR-17, miR-24, miR-320a, miR-25, miR-126, miR-19b, miR-199a-3p, miR-30b, miR-30c, miR-374a) that can be used to create a reliable reference combination of 3 miRNAs. We showed that on average the mean of 3 miRNAs (p = 0.0002) and 2 miRNAs (p = 0.0031) were a better reference than single miRNA. The arithmetic means of 3 miRNAs: miR-24, miR-222 and miR-27a was shown to be the most stable combination of 3 miRNAs in validation sets.

Conclusions: No single miRNA was suitable as a universal reference in serum miRNA qPCR profiling, but it was possible to designate a set of miRNAs, which consistently contributed to most stable combinations.


Conflict of interest statement

The authors declare that they have no competing interests.

Figures

Fig. 1
Fig. 1
a A heatmap of ranking values for the top 30 single miRNA references identified by averaging ranking across datasets. The miRNA shown have the lowest ranking value averaged from all datasets. Color intensity represents the ranking value in a dataset, averaged from the four stability measurement algorithms. The lower the stability value, the better the reference miRNA. MiRNAs at the top were considered the best single normalizers. MiRNAs with missing expression values in more than 20% of datasets were filtered out. Values were not standardized. b A heatmap of average raw expression values of miRNAs in each dataset. It suggests that raw expression values of top reference single miRNAs are heterogeneous, thus implying that a combination of them might be a good reference. Expression values were not standardized
Fig. 2
Fig. 2
Method of analyzing the stability of miRNA combinations. We decided to analyze combinations of miRNA from a dataset in a context of a dataset. For all possible combinations of miRNAs from a dataset, we sequentially appended an average of expressions of component miRNAs to a dataset (each sample had an additional entry with an average of expression of component miRNAs). Next step was to run the analysis in the same manner as for single miRNAs (as in Fig. 1b), which allowed to identify the average ranking value of a combination in a dataset. Then we removed the combination from the dataset and added another one to ensure that only one combination was present in the dataset at all time. This approach allowed us to aggregate the results from single and combinations of miRNAs without disrupting the workings of the stability measurement tools
Fig. 3
Fig. 3
a Figure represents the mean and standard deviation of the average ranking of single miRNAs and combinations of 2 and 3 miRNAs as well as mean of all miRNAs in each dataset. Each dot represents the average ranking in a single dataset. P values in post-hoc testing > = 0.05 were not shown in the figure. Lower mean ranking represents higher stability. b Figure represents the mean and standard deviation of rankings of single miRNAs and combinations of 2 and 3 miRNAs in each dataset. The lower the mean ranking the more suitable the reference candidate. c Figure represents the percent of 2-miRNA combinations that were less stable than all of their component miRNAs (red), were more stable than 1 component miRNA (yellow) and better than all of their component miRNAs (green). d Figure represents the percent of 3-miRNA combinations that were less stable than all of their component miRNAs (red), were more stable than 1 component miRNA (yellow), were more stable than 2 components (light yellow) and better than all of their component miRNAs (green)
Fig. 4
Fig. 4
We counted the number of times two miRNAs occurred in all combinations of 3 miRNAs, which placed 1st in the 11 dataset rankings. We divided each singular count by the number of combinations in a dataset containing the counted combination and summed the counts from all occurrences of a pair. miR-374a, miR-222, miR-25, miR-126, miR-24 had the highest contribution to creation of the best normalizing combinations of 3 miRNAs
Fig. 5
Fig. 5
The mean and the standard deviation of ranking of all normalizing factors in two unpublished validation sets - panels a and b - and a publicly available dataset GSE109888 - panel c (black point and lines; description of the validation datasets experiments in the Additional files 1, 2, 3, 4 and 5). Colored dots represent ranking values of combinations of miRNAs from our chosen set. Our candidate normalization factors clustered towards the lower values of ranking (better stability)
Fig. 6
Fig. 6
We performed the validation of the chosen set of 13 miRNAs as suitable reference genes. Figures represent histograms of distributions of mean ranking of randomly selected 13 miRNAs (blue). Panels a and b show two validation sets attached in the Additional files and panel c shows data from a publicly available GSE109888. We sampled 13 random ones from the pool of miRNAs presented in a validation dataset 2000 times creating 2000 replicates of mean ranking of derived 3 miRNA combinations. This allowed to plot empirical distribution of mean ranking of combinations derived from any arbitrarily selected 13 miRNAs. Shown are mean rankings of single miRNAs (pink) and combinations of 3 miRNAs (blue). A red vertical line marks mean ranking of 3 miRNA combinations derived from the chosen set. The lower the average ranking the more suitable the combination to be a reference gene. Average ranking of combinations derived from the chosen set (the red vertical lines) was lower than 83.32, 84.76 and 97.45% of all average rankings in three validation sets, respectively. In summary, combination of 3 miRNAs picked from our set of 13 were repeatedly within top 15% of best normalizers in two datasets and significantly outperformed single-miRNA normalizers
Fig. 7
Fig. 7
a Flowchart of the steps taken in our study to acquire 11 datasets of miRNA expression in serum measured by qPCR and to identify the most suitable single miRNA or a set of miRNAs to use as reference. b Flowchart of our approach to analysis of single miRNAs. Each dataset was analyzed by the same four algorithms implemented in the Python programming language. Algorithms independently assigned a stability value to each miRNA. We changed algorithms to assign a ranking from 0 to 1 based on the stability value (the lower the ranking value, the better the reference), thus each miRNA had 4 ranking values. We averaged the four values for each miRNA, which resulted in a single measure of stability and aggregated the results from 11 datasets. c The outline of the two-pronged approach of our analysis. We first analyzed all single miRNAs and then created all possible average expressions of two or three miRNA-combinations and analyzed the suitability of single miRNAs and their combinations as a good qPCR reference using the algorithms shown in Fig. 1b

Similar articles

Cited by

References

    1. Avery OT, Macleod CM, McCarty M. Studies on the chemical nature of the substance inducing transformation of pneumococcal types: induction of tranformation by a desoxyribonucleic acid fraction isolated from pneumococcus type III. J Exp Med. 1944;79(2):137–158. doi: 10.1084/jem.79.2.137. - DOI - PMC - PubMed
    1. Watson JD, Crick FHC. Molecular structure of nucleic acids: a structure for Deoxyribose nucleic acid. Nature. 1953;171(4356):737–738. doi: 10.1038/171737a0. - DOI - PubMed
    1. Lehman IR, Bessman MJ, Simms ES, Kornberg A. Enzymatic synthesis of deoxyribonucleic acid. I. Preparation of substrates and partial purification of an enzyme from Escherichia coli. J Biol Chem. 1958;233(1):163–170. - PubMed
    1. Higuchi R, Fockler C, Dollinger G, Watson R. Kinetic PCR analysis: real-time monitoring of DNA amplification reactions. Biotechnology (N Y) 1993;11(9):1026–1030. - PubMed
    1. Schmittgen TD, Jiang J, Liu Q, Yang L. A high-throughput method to monitor the expression of microRNA precursors. Nucleic Acids Res. 2004;32(4):e43. doi: 10.1093/nar/gnh040. - DOI - PMC - PubMed

Substances

LinkOut - more resources