. 2020 Jan 31;21(1):112.
doi: 10.1186/s12864-020-6538-8.

Genome-wide association study reveals that different pathways contribute to grain quality variation in sorghum (Sorghum bicolor)

Affiliations

Genome-wide association study reveals that different pathways contribute to grain quality variation in sorghum (Sorghum bicolor)

Wilson Kimani et al. BMC Genomics. .

Abstract

Background: In sorghum (Sorghum bicolor), one paramount breeding objective is to increase grain quality. The nutritional quality and end use value of sorghum grains are primarily influenced by the proportions of tannins, starch and proteins, but the genetic basis of these grain quality traits remains largely unknown. This study aimed to dissect the natural variation of sorghum grain quality traits and identify the underpinning genetic loci by genome-wide association study.

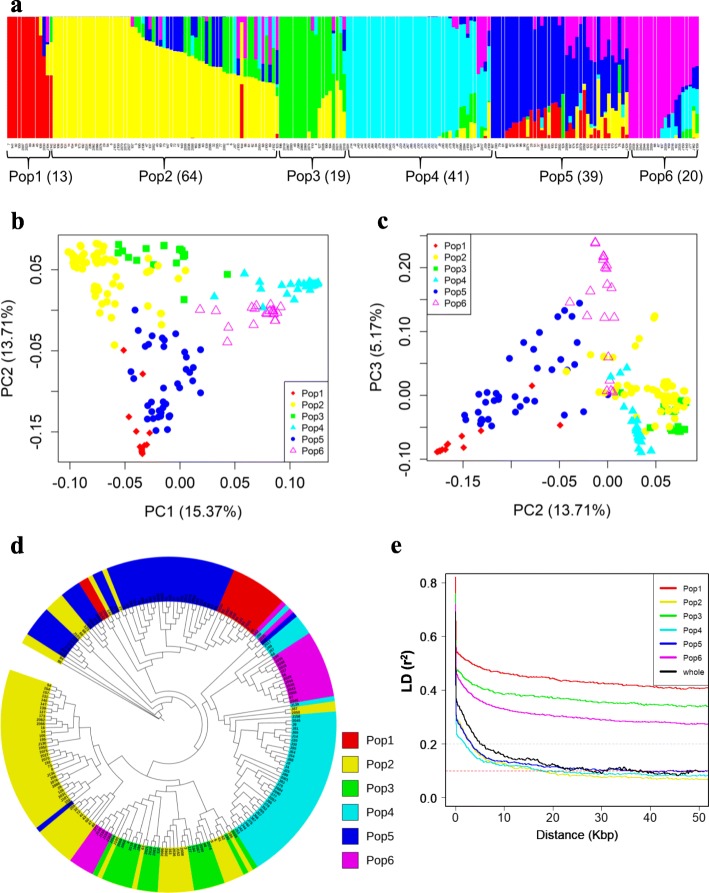
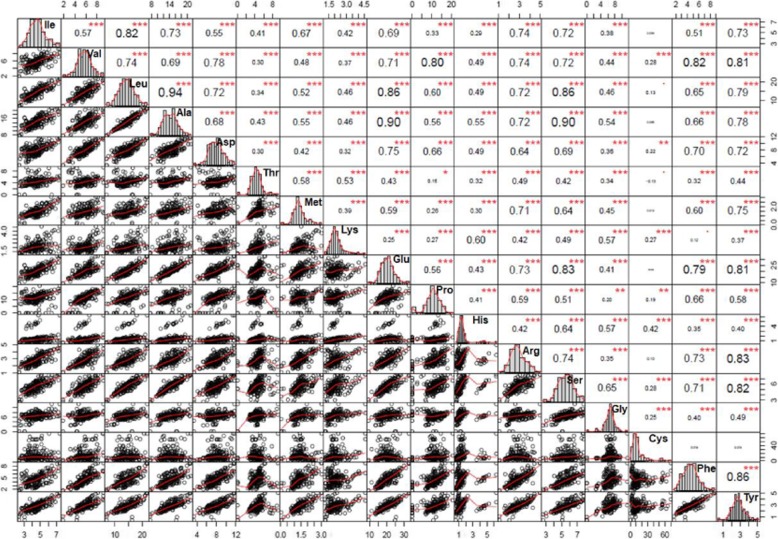
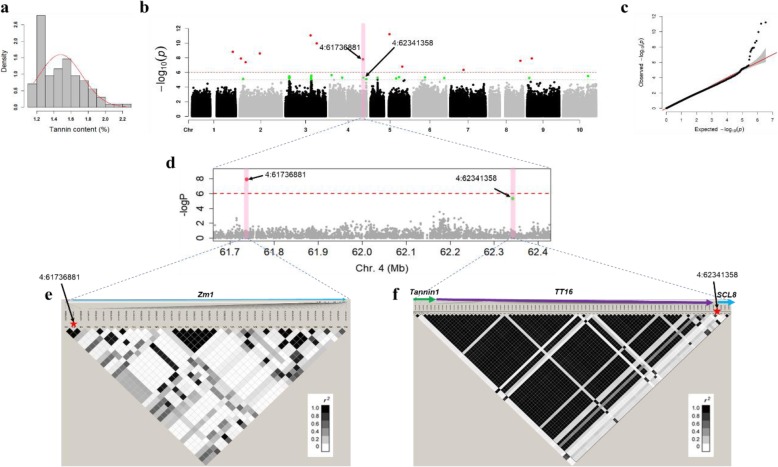
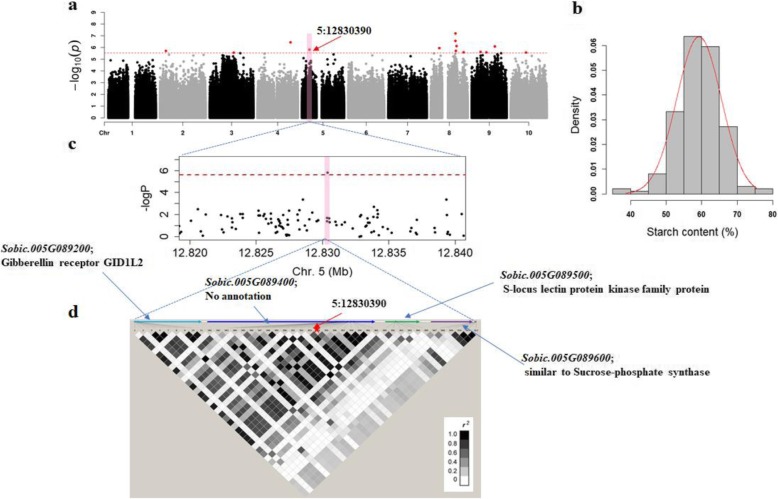
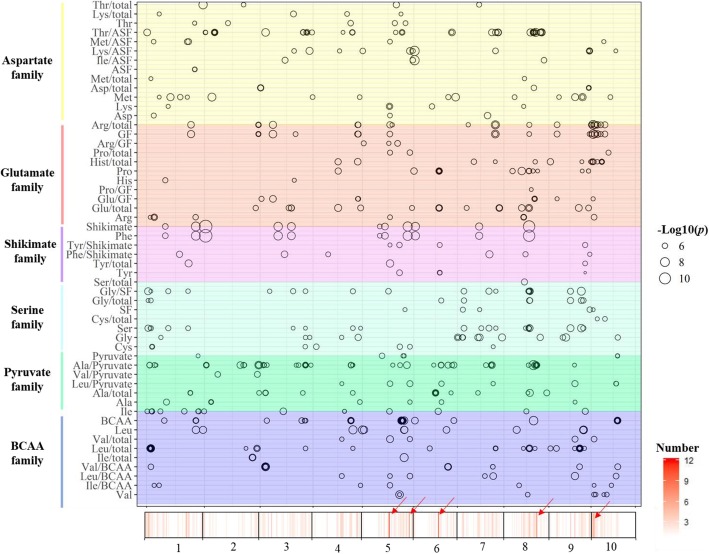
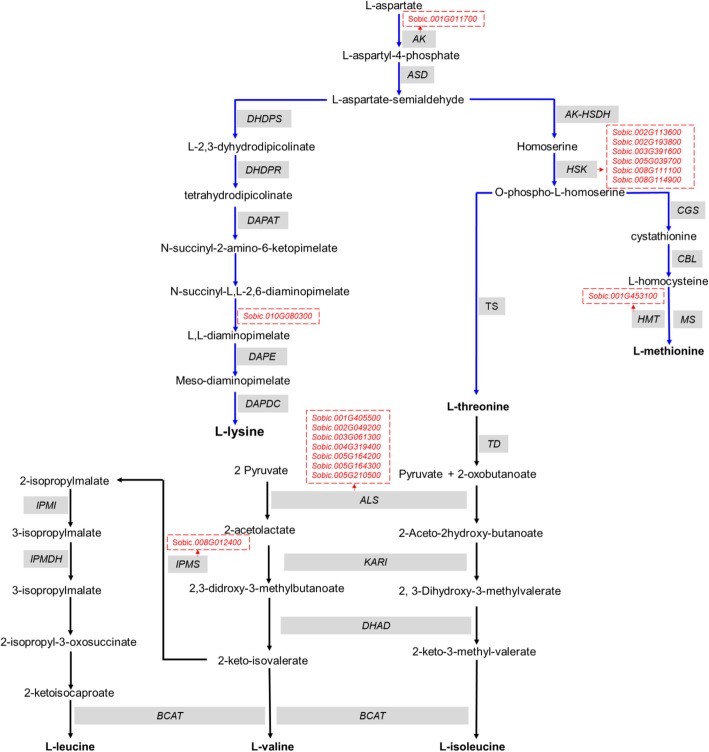
Results: Levels of starch, tannins and 17 amino acids were quantified in 196 diverse sorghum inbred lines, and 44 traits based on known metabolic pathways and biochemical interactions amongst the 17 amino acids calculated. A Genome-wide association study (GWAS) with 3,512,517 SNPs from re-sequencing data identified 14, 15 and 711 significant SNPs which represented 14, 14, 492 genetic loci associated with levels of tannins, starch and amino acids in sorghum grains, respectively. Amongst these significant SNPs, two SNPs were associated with tannin content on chromosome 4 and colocalized with three previously identified loci for Tannin1, and orthologs of Zm1 and TT16 genes. One SNP associated with starch content colocalized with sucrose phosphate synthase gene. Furthermore, homologues of opaque1 and opaque2 genes associated with amino acid content were identified. Using the KEGG pathway database, six and three candidate genes of tannins and starch were mapped into 12 and 3 metabolism pathways, respectively. Thirty-four candidate genes were mapped into 16 biosynthetic and catabolic pathways of amino acids. We finally reconstructed the biosynthetic pathways for aspartate and branched-chain amino acids based on 15 candidate genes identified in this study.

Conclusion: Promising candidate genes associated with grain quality traits have been identified in the present study. Some of them colocalized with previously identified genetic regions, but novel candidate genes involved in various metabolic pathways which influence grain quality traits have been dissected. Our study acts as an entry point for further validation studies to elucidate the complex mechanisms controlling grain quality traits such as tannins, starch and amino acids in sorghum.

Keywords: Amino acids; Genome-wide association study; Grain quality; Sorghum; Starch; Tannins.


Conflict of interest statement

The authors declare they have no competing interests.

Figures

Fig. 1
Fig. 1
Population structure analysis of 196 diverse sorghum accessions using genome-wide SNPs. a Hierarchical organization of genetic relatedness of the 196 diverse sorghum lines. Each bar represents an individual accession. The six sub-populations were pre-determined as the optimum number based on ADMIXTURE analysis with cross-validation for K value from K = 2 to K = 10 using 841,038 unlinked SNPs (r2 < 0.8), distributed across the genome. Different colours represent different sub-populations. b A plot of the first two principal components (PCs) coloured by sub-populations. c PC2 vs PC3 coloured by sub-populations. d Phylogenetic tree constructed using the maximum likelihood method in SNPhylo. The colours are based on the six sub-populations from ADMIXTURE results. e Comparison of genome-wide average linkage disequilibrium (LD) decay estimated from the whole population and six sub-populations. The horizontal broken grey and red lines show the LD threshold at r2 = 0.2 and r2 = 0.1, respectively
Fig. 2
Fig. 2
Variations and spearman’s correlations among 17 amino acids. The lower panel left of the diagonal is the scatter plots containing measured values of 196 accessions. The red line through the scatter plot represents the line of the best fit. Spearman’s correlation coefficients between amino acids are shown on the upper panel on the right of the diagonal. The correlation significance levels are *p = 0.05, **p = 0.01 and ***p = 0.001, and the size of the coefficient values are proportional to the strength of the correlation
Fig. 3
Fig. 3
GWAS for Tannin levels in sorghum seed and direct hits to a priori candidate gene region. a Distribution of tannin content in 196 diverse accessions. b Manhattan plot for tannin content GWAS. Black arrows show associated SNPs located close to candidate genes. c Quantile-quantile plot for tannin content GWAS. d A close up of the significant association on chromosome 4. The broken red line represents the significance threshold. e and f LD blocks showing pairwise r2 values among all polymorphic sites in candidate genes region, where the intensity of the colour corresponds to the r2 value as indicated on the legend. Candidate genes Zm1 (~ 61.7 Mb region), Tannin1, TT16 and SCL8 (~ 62.3 Mb region) are shown
Fig. 4
Fig. 4
GWAS for starch content in sorghum grains (a) Manhattan plot for starch content GWAS. The red arrow shows significant SNP located close to candidate genes. (b) Distribution of starch content in 196 diverse accessions. (c) A close up of the significant association on chromosome 5. The broken red line represents the significance threshold. (d) LD block showing pairwise r2 values among all polymorphic sites in a candidate genes region, where the intensity of the colour corresponds to the r2 value as indicated on the legend
Fig. 5
Fig. 5
Chromosomal distribution of significant SNPs identified in amino acids content GWAS. SNP positions are represented by black circles. The size of the circle proportional to the significance level. Different amino acid families are represented by each colour as shown on the left of the y-axis. The x-Axis represents the physical position across the 10 sorghum chromosomes. The density map on the x-xis represents the number of amino acids significant loci identified across the genome. The red arrows show the association hotspots
Fig. 6
Fig. 6
Biosynthesis of aspartate family and branched-chain amino acids. The blue and black arrows represent the aspartate family and branched-chain amino acid pathways, respectively. The candidate genes identified in this GWAS are shown in red text and surrounded by a textbox with broken red lines. AK, Aspartokinase; AK-HSDH, Aspartate kinase-homoserine dehydrogenase; ALS, Acetolactate synthase; ASD, Aspartate semialdehyde dehydrogenase; BCAT, branched-chain aminotransferases; CBL, cystathionine β-lyase; CGS, cystathionine γ-synthase; DAPAT, diaminopimelate aminotransferase; DAPDC, diaminopimelate decarboxylase; DAPE, diaminopimelate epimerase; DHAD, dihydroxylacid dehydratase; DHDPR, dihydrodipicolinate reductase; HMT, homocysteine S-methyltransferase; HSK, homo-Ser kinase; IPMDH, isopropylmalate dehydrogenase; IPMI, isopropylmalate isomerase; KARI, ketol-acid reductoisomerase; MS, Methionine synthase; TD, Threonine deaminase; TS, Threonine synthase

Similar articles

Cited by

References

    1. Sukumaran S, Xiang W, Bean SR, Pedersen JF, Kresovich S, Tuinstra MR, et al. Association mapping for grain quality in a diverse Sorghum collection. Plant Genome. 2012;5:126–135. doi: 10.3835/plantgenome2012.07.0016. - DOI
    1. Sang Y, Bean S, Seib PA, Pedersen J, Shi YC. Structure and functional properties of sorghum starches differing in amylose content. J Agric Food Chem. 2008;56(15):6680–6685. doi: 10.1021/jf800577x. - DOI - PubMed
    1. Jeon JS, Ryoo N, Hahn TR, Walia H, Nakamura Y. Starch biosynthesis in cereal endosperm. Plant Physiol Biochem. 2010;48(6):383–392. doi: 10.1016/j.plaphy.2010.03.006. - DOI - PubMed
    1. Wilson LM, Whitt SR, Iba AM, Iv ESB. Dissection of Maize Kernel Composition and Starch Production by Candidate Gene Association. Plant Cell. 2004;16:2719–2733. doi: 10.1105/tpc.104.025700. - DOI - PMC - PubMed
    1. James MG, Denyer K, Myers AM. Starch synthesis in the cereal endosperm. Curr Opin Plant Biol. 2003;6(3):215–222. doi: 10.1016/S1369-5266(03)00042-6. - DOI - PubMed

LinkOut - more resources