

MammaPrint guides treatment decisions in breast Cancer: results of the IMPACt trial
- PMID: 32005181
- PMCID: PMC6995096
- DOI: 10.1186/s12885-020-6534-z
MammaPrint guides treatment decisions in breast Cancer: results of the IMPACt trial
Abstract
Background: Increased usage of genomic risk assessment assays suggests increased reliance on data provided by these assays to guide therapy decisions. The current study aimed to assess the change in treatment decision and physician confidence based on the 70-gene risk of recurrence signature (70-GS, MammaPrint) and the 80-gene molecular subtype signature (80-GS, BluePrint) in early stage breast cancer patients.
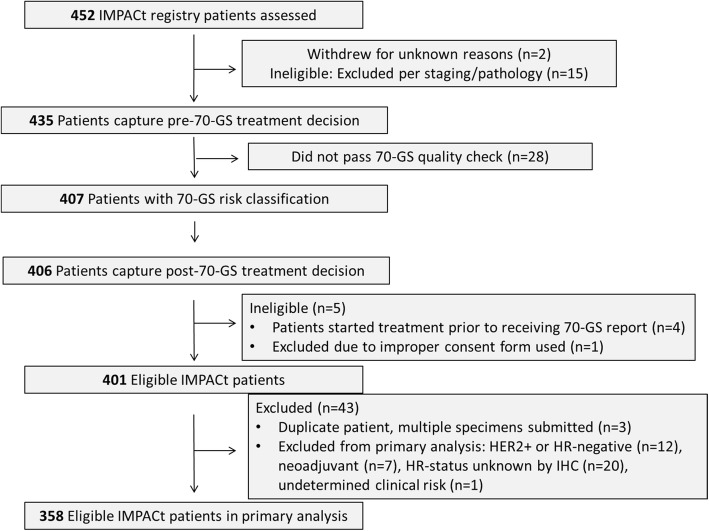
Methods: IMPACt, a prospective, case-only study, enrolled 452 patients between November 2015 and August 2017. The primary objective population included 358 patients with stage I-II, hormone receptor-positive, HER2-negative breast cancer. The recommended treatment plan and physician confidence were captured before and after receiving results for 70-GS and 80-GS. Treatment was started after obtaining results. The distribution of 70-GS High Risk (HR) and Low Risk (LR) patients was evaluated, in addition to the distribution of 80-GS compared to IHC status.
Results: The 70-GS classified 62.5% (n = 224/358) of patients as LR and 37.5% (n = 134/358) as HR. Treatment decisions were changed for 24.0% (n = 86/358) of patients after receiving 70-GS and 80-GS results. Of the LR patients initially prescribed CT, 71.0% (44/62) had CT removed from their treatment recommendation. Of the HR patients not initially prescribed CT, 65.1% (41/63) had CT added. After receiving 70-GS results, CT was included in 83.6% (n = 112/134) of 70-GS HR patient treatment plans, and 91.5% (n = 205/224) of 70-GS LR patient treatment plans did not include CT. For patients who disagreed with the treatment recommended by their physicians, most (94.1%, n = 16/17) elected not to receive CT when it was recommended. For patients whose physician-recommended treatment plan was discordant with 70-GS results, discordance was significantly associated with age and lymph node status.
Conclusions: The IMPACt trial showed that treatment plans were 88.5% (n = 317/358) in agreement with 70-GS results, indicating that physicians make treatment decisions in clinical practice based on the 70-GS result. In clinically high risk, 70-GS Low Risk patients, there was a 60.0% reduction in treatment recommendations that include CT. Additionally, physicians reported having greater confidence in treatment decisions for their patients in 72% (n = 258/358) of cases after receiving 70-GS results.
Trial registration: "Measuring the Impact of MammaPrint on Adjuvant and Neoadjuvant Treatment in Breast Cancer Patients: A Prospective Registry" (NCT02670577) retrospectively registered on Jan 27, 2016.
Keywords: 70-GS; 80-GS; BluePrint; Breast cancer; Clinical utility; Diagnostic test; MammaPrint; Molecular profiling.
Conflict of interest statement
SU, HMK, TT, and WA are employees of Agendia, Inc. HS reports receiving personal fees outside the submitted work from Novartis, Eli Lilly, AstraZeneca, Celgene, PUMA, Pfizer, and Eisai. RM reports receiving personal fees outside the submitted work from Agendia, Pfizer, Novartis, Eli Lilly, Amgen, PUMA, and Eisai. BM reports receiving honoraria outside the submitted work from Celgene and Janssen. No other disclosures were reported.
Figures


References
-
- Buyse M, Loi S, van't Veer L, Viale G, Delorenzi M, Glas AM, d'Assignies MS, Bergh J, Lidereau R, Ellis P, et al. Validation and clinical utility of a 70-gene prognostic signature for women with node-negative breast cancer. J Natl Cancer Inst. 2006;98(17):1183–1192. doi: 10.1093/jnci/djj329. - DOI - PubMed
-
- Mook S, Schmidt MK, Viale G, Pruneri G, Eekhout I, Floore A, Glas AM, Bogaerts J, Cardoso F, Piccart-Gebhart MJ, et al. The 70-gene prognosis-signature predicts disease outcome in breast cancer patients with 1-3 positive lymph nodes in an independent validation study. Breast Cancer Res Treat. 2009;116(2):295–302. doi: 10.1007/s10549-008-0130-2. - DOI - PubMed
Publication types
MeSH terms
Substances
Associated data
LinkOut - more resources
Full Text Sources
Medical
Research Materials
Miscellaneous
