. 2020 Mar 6;295(10):3269-3284.
doi: 10.1074/jbc.RA119.009794. Epub 2020 Jan 31.

Serine phosphorylation of the small phosphoprotein ICAP1 inhibits its nuclear accumulation

Affiliations

Serine phosphorylation of the small phosphoprotein ICAP1 inhibits its nuclear accumulation

Valerie L Su et al. J Biol Chem. .

Abstract

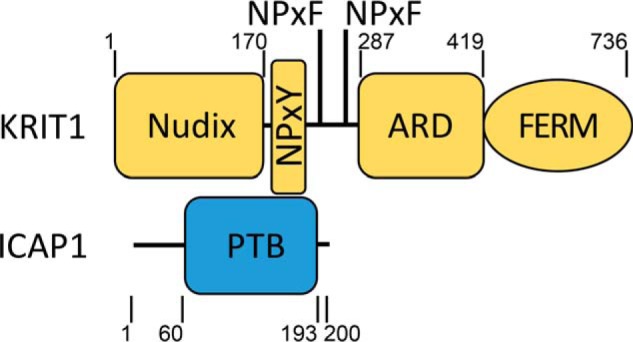
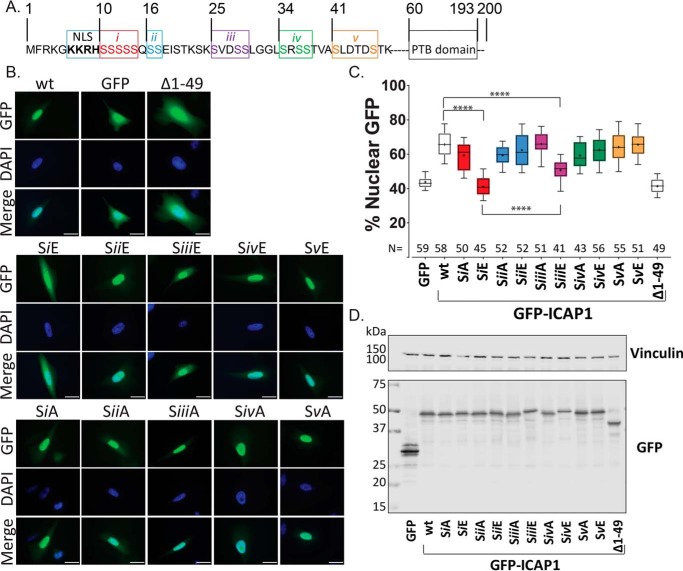
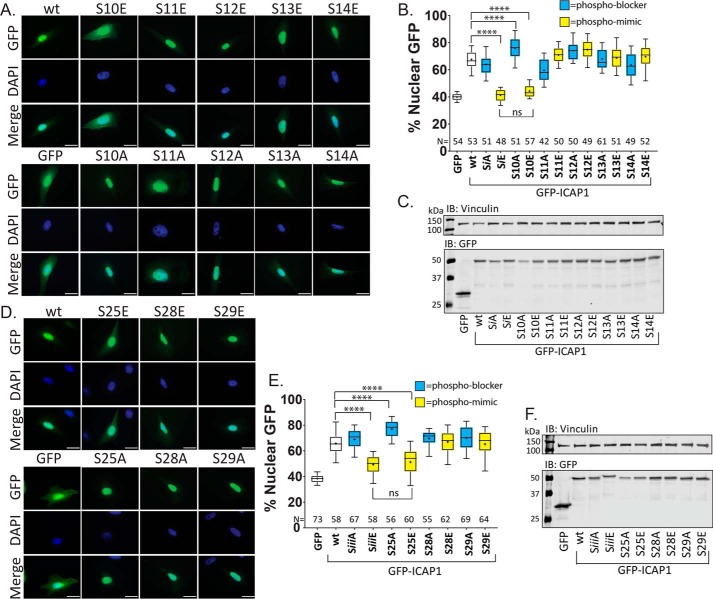
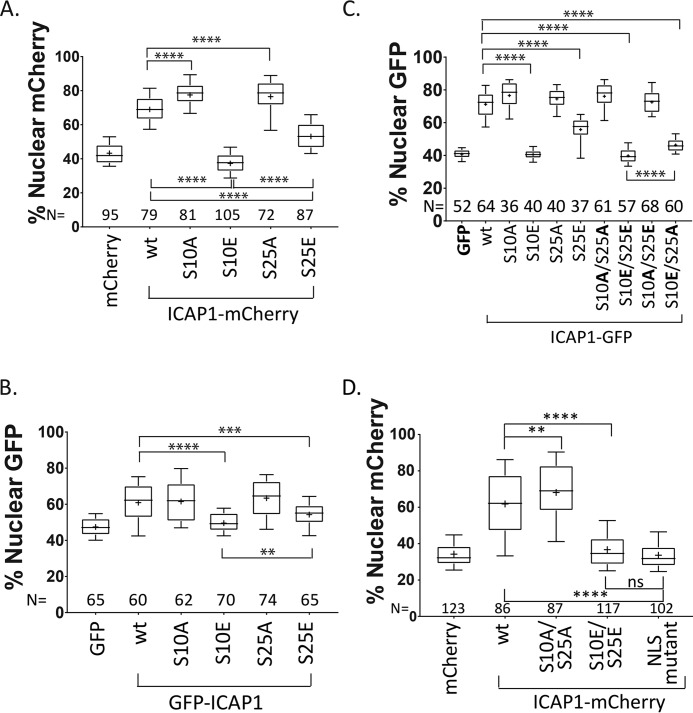
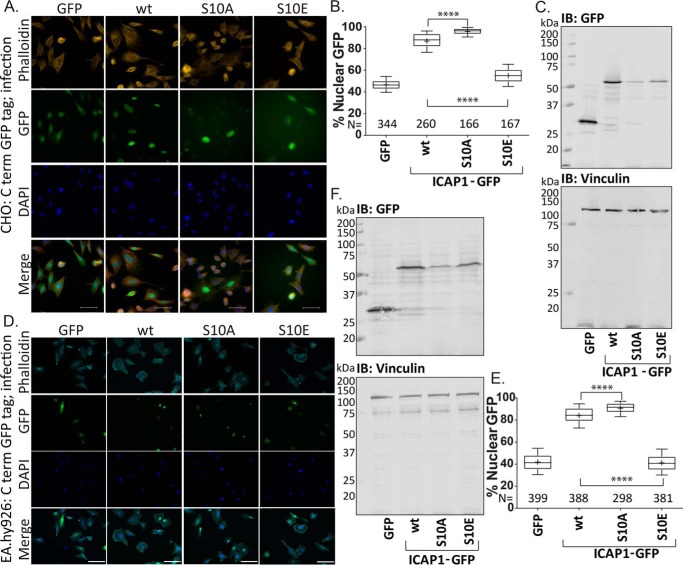
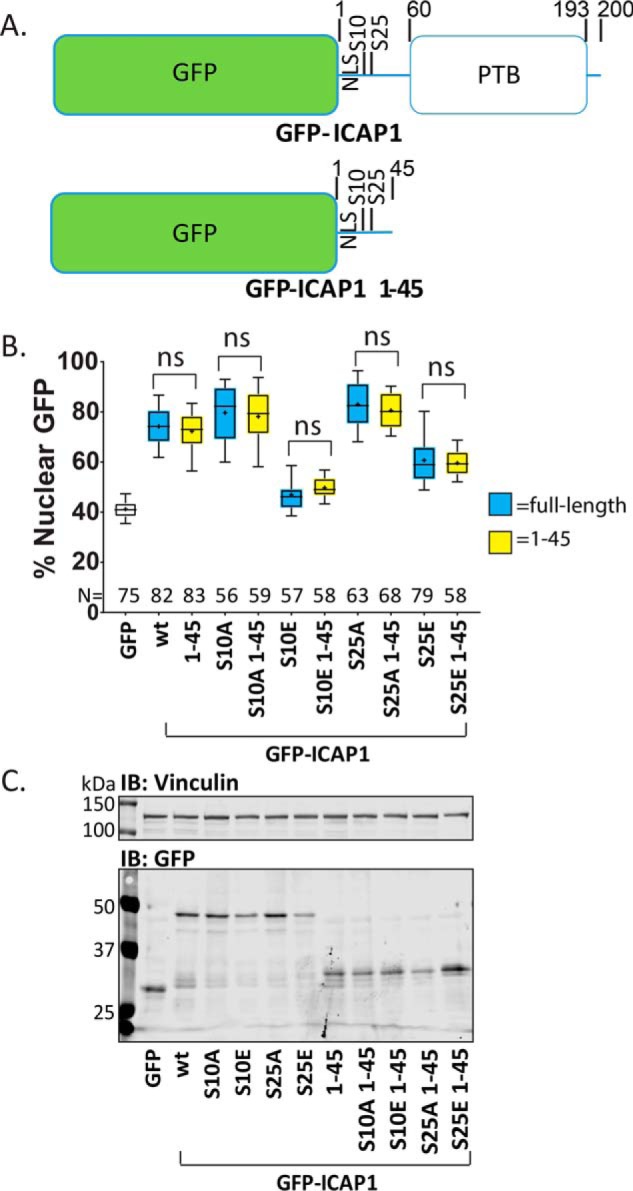
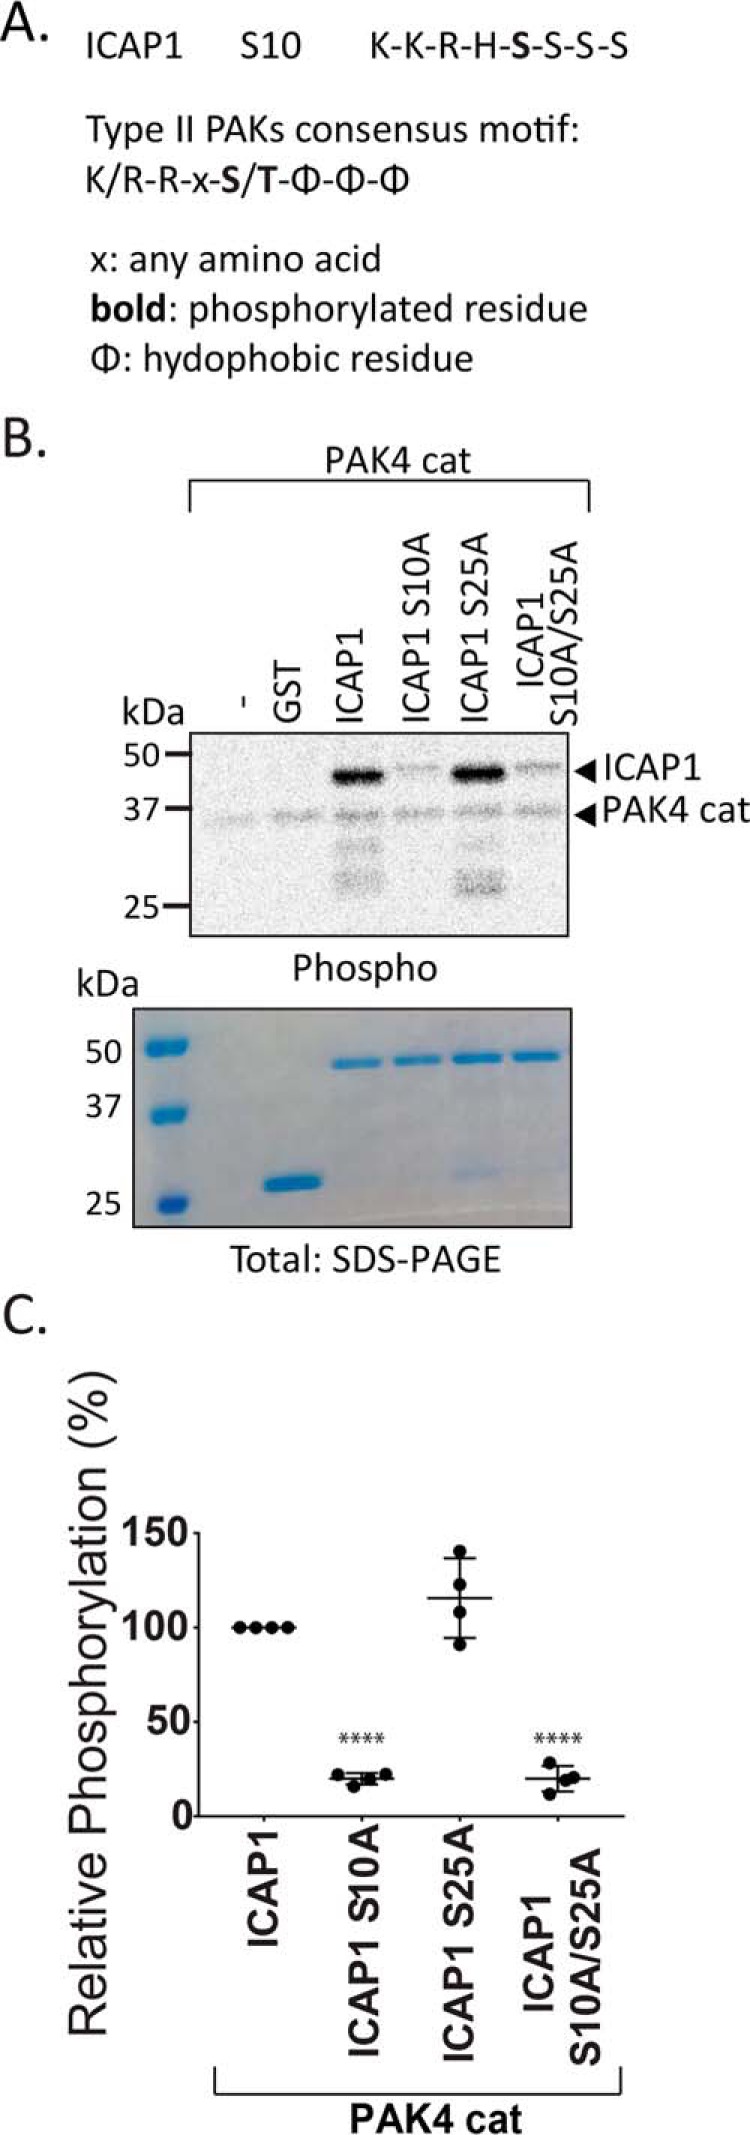
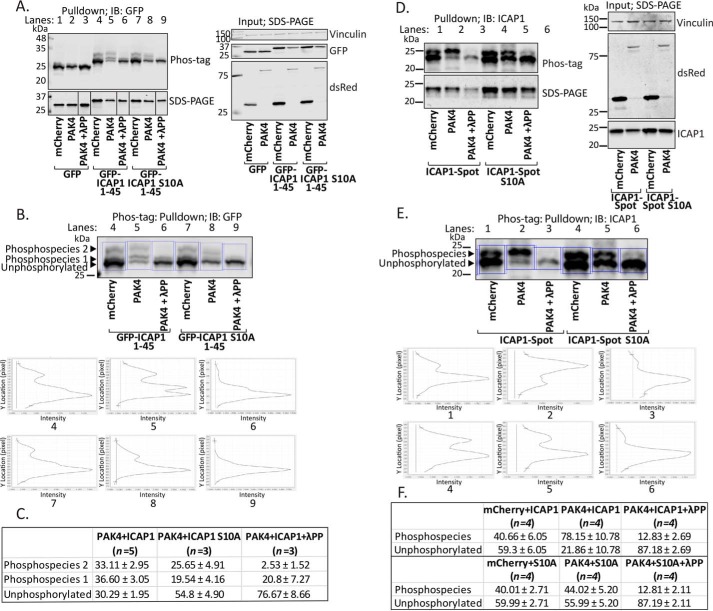
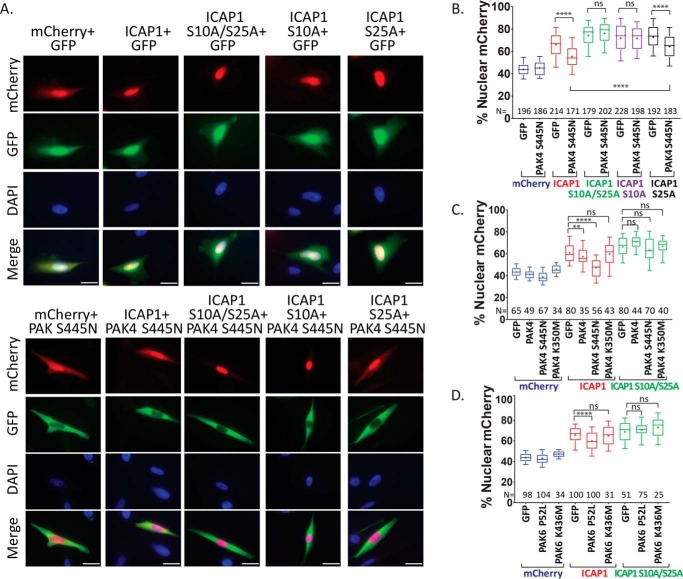
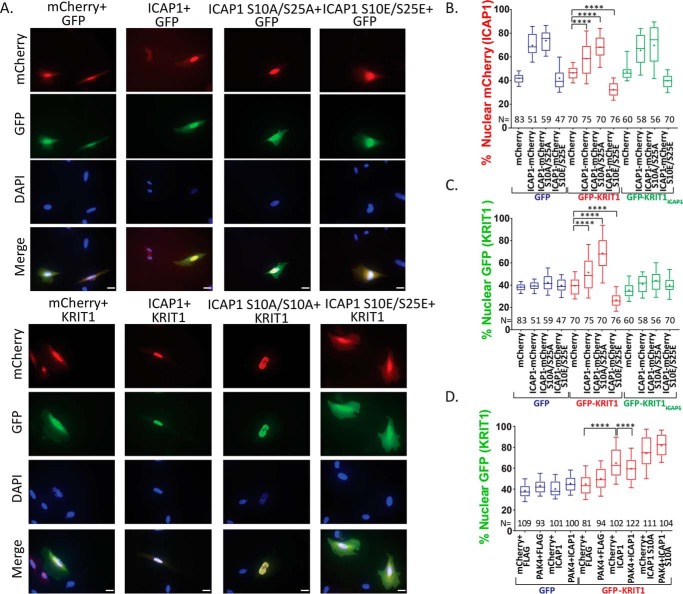
Nuclear accumulation of the small phosphoprotein integrin cytoplasmic domain-associated protein-1 (ICAP1) results in recruitment of its binding partner, Krev/Rap1 interaction trapped-1 (KRIT1), to the nucleus. KRIT1 loss is the most common cause of cerebral cavernous malformation, a neurovascular dysplasia resulting in dilated, thin-walled vessels that tend to rupture, increasing the risk for hemorrhagic stroke. KRIT1's nuclear roles are unknown, but it is known to function as a scaffolding or adaptor protein at cell-cell junctions and in the cytosol, supporting normal blood vessel integrity and development. As ICAP1 controls KRIT1 subcellular localization, presumably influencing KRIT1 function, in this work, we investigated the signals that regulate ICAP1 and, hence, KRIT1 nuclear localization. ICAP1 contains a nuclear localization signal within an unstructured, N-terminal region that is rich in serine and threonine residues, several of which are reportedly phosphorylated. Using quantitative microscopy, we revealed that phosphorylation-mimicking substitutions at Ser-10, or to a lesser extent at Ser-25, within this N-terminal region inhibit ICAP1 nuclear accumulation. Conversely, phosphorylation-blocking substitutions at these sites enhanced ICAP1 nuclear accumulation. We further demonstrate that p21-activated kinase 4 (PAK4) can phosphorylate ICAP1 at Ser-10 both in vitro and in cultured cells and that active PAK4 inhibits ICAP1 nuclear accumulation in a Ser-10-dependent manner. Finally, we show that ICAP1 phosphorylation controls nuclear localization of the ICAP1-KRIT1 complex. We conclude that serine phosphorylation within the ICAP1 N-terminal region can prevent nuclear ICAP1 accumulation, providing a mechanism that regulates KRIT1 localization and signaling, potentially influencing vascular development.

Keywords: ICAP1 (integrin cytoplasmic domain-associated protein-1); KRIT1 (Krev interaction trapped); cell compartmentalization; cerebral cavernous malformation; nuclear import; nuclear translocation; nuclear transport; nucleocytoplasmic shuttling; phosphoprotein; phosphorylation.


Conflict of interest statement

The authors declare that they have no conflicts of interest with the contents of this article

Figures

Figure 1.
Figure 1.
Domain schematic of ICAP1 and KRIT1. ICAP1 contains an unstructured N-terminal region followed by a phosphotyrosine-binding domain (residues 60–193). KRIT1 contains an N-terminal Nudix domain, three NPX(Y/F) motifs, an ankyrin repeat domain (ARD), and a FERM domain. The ICAP1:KRIT1 interaction is mediated by direct ICAP1 PTB domain interactions with the first KRIT1 NPX(Y/F) motif and with an adjacent RR motif (not depicted) (6). Boundaries are indicated by residue numbers.
Figure 2.
Figure 2.
Grouped phospho-mimicking mutants inhibit ICAP1 nuclear localization. A, schematic of ICAP1 noting the boundaries of the NLS sequence, PTB domain, and indicating the five groups (i–v) of serines that were mutated to glutamic acid or alanine. B, representative images of CHO cells expressing WT GFP-tagged ICAP1, or various ICAP1 mutants, fixed 24 h after plating on fibronectin and stained with DAPI (to identify nuclei). Bar, 10 μm. C, the percentage of the total integrated whole-cell GFP intensity found in the nucleus was calculated for each cell using CellProfiler 2.1. The total number of cells (N) in each condition from three independent experiments is indicated. Boxes, 25–50th and 50–75th percentile; whiskers, 10–90th percentile; dots, mean. Statistical significance was determined by a one-way ANOVA with Fisher's LSD test with multiple comparisons. ****, p ≤ 0.0001. D, representative immunoblots indicate expression of individual phosphomutants at the expected size; immunoblotting was against GFP for phosphomutants and vinculin for loading control. Uncropped immunoblots are shown in Fig. S1A.
Figure 3.
Figure 3.
Individual phosphomutations at Ser-10 or Ser-25 alter ICAP1 nuclear localization. To assess whether single serine mutations alter ICAP1 localization, individual GFP-ICAP1 serine phospho-mimicking or phospho-blocking mutations from group i (A–C) or group iii (D–F) were generated and expressed in CHO cells. A and D, representative images of CHO cells expressing GFP-tagged ICAP1 constructs stained with DAPI (to identify nuclei) 24 h after plating on fibronectin. Bar, 10 μm. B and E, percentage of GFP intensity in the nucleus. Boxes, 25–50th and 50–75th percentile; whiskers, 10–90th percentile; +, mean. Results are from three independent experiments, and the total number of cells examined (N) is indicated for each condition. ****, statistical significance at p ≤ 0.0001 as determined by a one-way ANOVA with Fisher's LSD test with multiple comparisons. C and F, representative immunoblots (against anti-GFP and anti-vinculin) (IB) indicate expression of individual phosphomutants at the expected size. Uncropped immunoblots are shown in Fig. S1 (B and C).
Figure 4.
Figure 4.
Ser-10 is the major site governing ICAP1 nuclear localization. CHO cells (A and C) or HeLa cells (B) were transfected with constructs encoding mCherry, C-terminally mCherry-tagged ICAP1, and phosphomutants (A); GFP, N-terminally GFP-tagged ICAP1, and phosphomutants (B); or GFP, C-terminally tagged ICAP1-GFP, and phosphomutants (C). Cells were plated on fibronectin, fixed 24 h later, and stained with DAPI (to identify nuclei). Nuclear GFP or mCherry signal was calculated, and results from three independent experiments are displayed in box-and-whisker plots. D, CHO cells stably expressing GFP-histone H2B (to identify nuclei) and transiently transfected with constructs expressing mCherry or C-terminal mCherry-tagged ICAP1, ICAP1 phosphomutants, or ICAP1 containing mutations in the NLS (ICAP1 KK6,7AA) were plated on fibronectin-coated glass-bottom dishes (MatTek), stained with HCS CellMask Deep Red Stain (to identify cell boundaries), and imaged live. Nuclear mCherry signal was calculated in three independent experiments and presented in box-and-whisker plots. In all panels, boxes represent 25–50th and 50–75th percentile, whiskers show the 10–90th percentile, and plus signs show the mean. The total number of cells measured in each condition (N) is indicated. Statistical significance was determined by a one-way ANOVA with Fisher's LSD test. **, p ≤ 0.01; ***, p ≤ 0.001; ****, p ≤ 0.0001; ns, not significant. Representative images are shown in Fig. S2.
Figure 5.
Figure 5.
Mutations at Ser-10 alter localization of lentivirally transduced ICAP1 in CHO and EA.hy926 cells. CHO cells (A–C) or EA.hy926 cells (D–F) were transduced with lentivirus encoding GFP, WT ICAP1-GFP, ICAP1-GFP S10A, or ICAP1-GFP S10E phosphomutants and selected with hygromycin. A and D, representative images of transduced CHO (A) or EA.hy926 (D) cells stained with DAPI (to identify nuclei) and phalloidin (to identify cell boundaries) 24 h after plating on fibronectin are shown. Bar, 50 μm. The percentage of total GFP signal in the nucleus of transduced CHO (B) or EA.hy926 (E) cells was plotted. Boxes, 25–50 and 50–75 percentile; whiskers, 10–90 percentile; +, mean. Results are from three independent experiments, and the total number of cells examined (N) is indicated for each condition. ****, statistical significance at p ≤ 0.0001 as determined by a one-way ANOVA with Fisher's LSD test with multiple comparisons. C and F, representative anti-GFP immunoblots (IB) indicate expression of individual phosphomutants at the expected size. Vinculin staining was used as a loading control.
Figure 6.
Figure 6.
Residues 46–200 do not alter ICAP1 localization. A, schematic depicting GFP-ICAP1 and the truncation mutant GFP ICAP1 1–45. B, percentage of GFP intensity in the nucleus of CHO cells expressing GFP (unfilled box) or phosphomutants of GFP-tagged full-length ICAP1 (blue boxes) or ICAP1 1–45 (yellow boxes) 24 h after plating on fibronectin. Results are from three independent experiments, and the total number of cells examined (N) is indicated for each condition. Boxes, 25–50 and 50–75 percentile; whiskers, 10–90 percentile; +, mean. Statistical analysis was performed using a one-way ANOVA with Fisher's LSD test with multiple comparisons. ns, not significant. C, representative immunoblots (IB) (against anti-GFP and anti-vinculin) indicate construct expression at the expected sizes. Note that GFP (lane 1) runs at a smaller size than GFP-ICAP1 1–45 (lanes 7–11). Uncropped immunoblots are shown in Fig. S1D.
Figure 7.
Figure 7.
PAK4 catalytic domain phosphorylates ICAP1 Ser-10 but not Ser-25 in vitro. A, alignment of the substrate recognition motif of the type II PAKs and the ICAP1 Ser-10 site. B and C, in vitro kinase assays were performed by incubating GST-ICAP1 or phosphomutants, PAK4 catalytic domain, and [γ-33P]ATP for 30 min. B, representative autoradiograph and corresponding Coomassie-stained gel. C, phosphorylation of GST-ICAP1 mutants was quantified and normalized to WT GST-ICAP1 in four independent experiments. Individual values are represented by filled circles, and bars show mean with S.D. ****, p ≤ 0.0001 with respect to WT GST-ICAP1 as determined by a one-way ANOVA test with Fisher's LSD test with multiple comparisons.
Figure 8.
Figure 8.
Activated PAK4 phosphorylates ICAP1 Ser-10 in cells. Phos-tagTM gel mobility shift analyses were performed in CHO cells co-expressing mCherry, mCherry-PAK4 S445N, and either GFP, GFP-ICAP1 1–45, or GFP-ICAP1 1–45 S10A (A–C) or ICAP1-Spot or ICAP1-Spot S10A (D–F) in the presence and absence of λ-protein phosphatase (λPP). A–C, GFP-nanotrap pulldowns were resolved by Phos-tagTM PAGE and by standard SDS-PAGE (as indicated) and analyzed by immunoblotting (IB) against GFP (A). Input samples were also assessed by standard SDS-PAGE to evaluate expression levels of all constructs. B, line scans (outlined by blue boxes) depicting signal intensities of mobility shift bands of GFP-ICAP1 1–45 or GFP-ICAP1 S10A 1–45 from A in conditions with mCherry, mCherry-PAK4 S445N alone, or mCherry-PAK4 S445N with λ-protein phosphatase. C, percentages of the signal in each of the mobility shift bands of GFP-ICAP1 1–45 or GFP-ICAP1 S10A 1–45 were calculated by dividing the signal intensity of each band by the total amount of ICAP1. Data are represented as mean ± S.D. from independent preparations. D–F Spot-Trap® agarose pulldowns were resolved by Phos-tagTM PAGE and by standard SDS-PAGE and analyzed by immunoblotting against ICAP1 (D). Input samples were also assessed by standard SDS-PAGE to evaluate expression levels of all constructs. E, line scans (outlined by blue boxes) depicting signal intensities of mobility shift bands of ICAP1-Spot or ICAP1-Spot S10A from D in conditions with mCherry, mCherry-PAK4 S445N alone, or mCherry-PAK4 S445N with λ-protein phosphatase. F, percentages of the signal in each of the mobility shift bands of ICAP1-Spot or ICAP1-Spot S10A were calculated by dividing the signal intensity of each band by the total amount of ICAP1. Data are represented as mean ± S.D. from independent preparations. Uncropped immunoblots are shown in Fig. S3.
Figure 9.
Figure 9.
Activated PAK4 or -6 prevents ICAP1 nuclear accumulation. A–D, CHO cells expressing mCherry, ICAP1-mCherry, or ICAP1-mCherry phospho-blockers and GFP or GFP-PAK4 (A–C) or PAK6 (D) constructs were plated on fibronectin, fixed 24 h later, and stained with DAPI to identify nuclei. A, representative images; bar, 10 μm. B–D, percentage of mCherry intensity in the nucleus of mCherry and GFP double-positive cells. Results are from 4–6 independent experiments, and the total number of cells examined (N) is indicated for each condition. Boxes, 25–50th and 50–75th percentile; whiskers, 10–90th percentile; +, mean. Statistical analysis was performed using a one-way ANOVA with Fisher's LSD test with multiple comparisons. ****, p ≤ 0.0001; **, p ≤ 0.01; ns, not significant. Representative full immunoblots indicating construct expression at the expected sizes are shown in Fig. S5 (A–C).
Figure 10.
Figure 10.
Serine phosphorylation of ICAP1 impairs KRIT1 nuclear accumulation. A–D, CHO cells expressing mCherry, ICAP1-mCherry, or ICAP1-mCherry phosphomutants and GFP, GFP-tagged KRIT1, or a KRIT1 mutant defective in binding ICAP1 (KRIT1; GFP-KRIT1 R179A/R185A/N192A/Y195A) were plated on fibronectin, fixed 24 h later, and stained with DAPI to identify nuclei. A, representative images; bar, 10 μm. B and C, the percentage of mCherry (B) or GFP (C) signal in the nucleus of GFP and mCherry double-positive cells. Results are from three independent experiments, and the total number of cells examined (N) is indicated for each condition. Boxes, 25–50th and 50–75th percentile; whiskers, 10–90th percentile; +, mean. Statistical analysis was performed using a one-way ANOVA with Fisher's LSD test with multiple comparisons. ****, p ≤ 0.0001. D, CHO cells co-expressing FLAG, C-terminally triple FLAG-tagged ICAP1 (ICAP1-FLAG), or ICAP1-FLAG S10A, with mCherry or mCherry-PAK4 S445N, and GFP or GFP-KRIT1 constructs were plated on fibronectin, fixed 24 h later, and stained with DAPI (to identify nuclei). D, nuclear GFP was calculated in double GFP- and mCherry-positive cells in four independent experiments and presented as in C. Representative full immunoblots illustrating construct expression are shown in Fig. S5 (D and E).

Similar articles

Cited by

References

    1. Faurobert E., Rome C., Lisowska J., Manet-Dupé S., Boulday G., Malbouyres M., Balland M., Bouin A.-P., Kéramidas M., Bouvard D., Coll J.-L., Ruggiero F., Tournier-Lasserve E., and Albiges-Rizo C. (2013) CCM1–ICAP-1 complex controls β1 integrin–dependent endothelial contractility and fibronectin remodeling. J. Cell Biol. 202, 545–561 10.1083/jcb.201303044 - DOI - PMC - PubMed
    1. Brunner M., Millon-Frémillon A., Chevalier G., Nakchbandi I. A., Mosher D., Block M. R., Albigès-Rizo C., and Bouvard D. (2011) Osteoblast mineralization requires β1 integrin/ICAP-1–dependent fibronectin deposition. J. Cell Biol. 194, 307–322 10.1083/jcb.201007108 - DOI - PMC - PubMed
    1. Brütsch R., Liebler S. S., Wüstehube J., Bartol A., Herberich S. E., Adam M. G., Telzerow A., Augustin H. G., and Fischer A. (2010) Integrin cytoplasmic domain–associated protein-1 attenuates sprouting angiogenesis. Circ. Res. 107, 592–601 10.1161/CIRCRESAHA.110.217257 - DOI - PubMed
    1. Zhang X. A., and Hemler M. E. (1999) Interaction of the integrin β1 cytoplasmic domain with ICAP-1 protein. J. Biol. Chem. 274, 11–19 10.1074/jbc.274.1.11 - DOI - PubMed
    1. Chang D. D., Wong C., Smith H., and Liu J. (1997) ICAP-1, a novel β1 integrin cytoplasmic domain–associated protein, binds to a conserved and functionally important NPXY sequence motif of β1 integrin. J. Cell Biol. 138, 1149–1157 10.1083/jcb.138.5.1149 - DOI - PMC - PubMed

Publication types