. 2020 Jan 31;11(1):655.
doi: 10.1038/s41467-020-14284-2.

Human and mouse essentiality screens as a resource for disease gene discovery

Collaborators, Affiliations

Human and mouse essentiality screens as a resource for disease gene discovery

Pilar Cacheiro et al. Nat Commun. .

Abstract

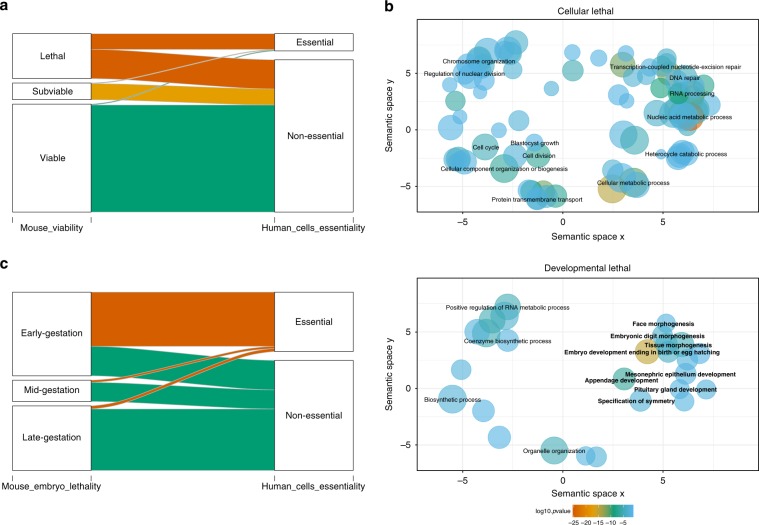
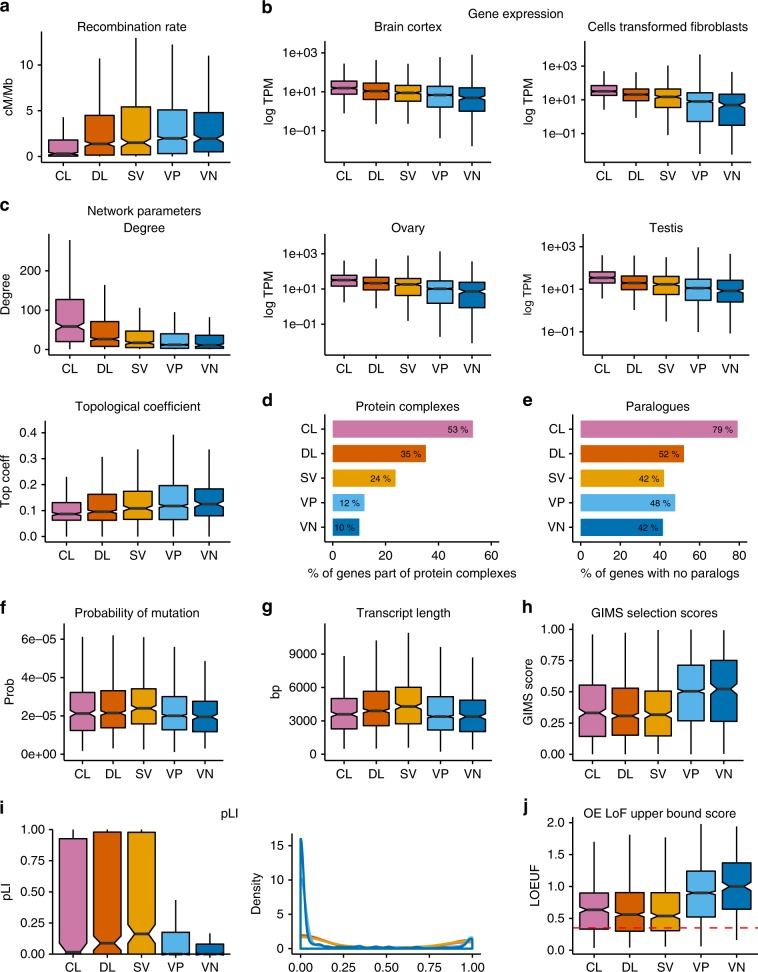
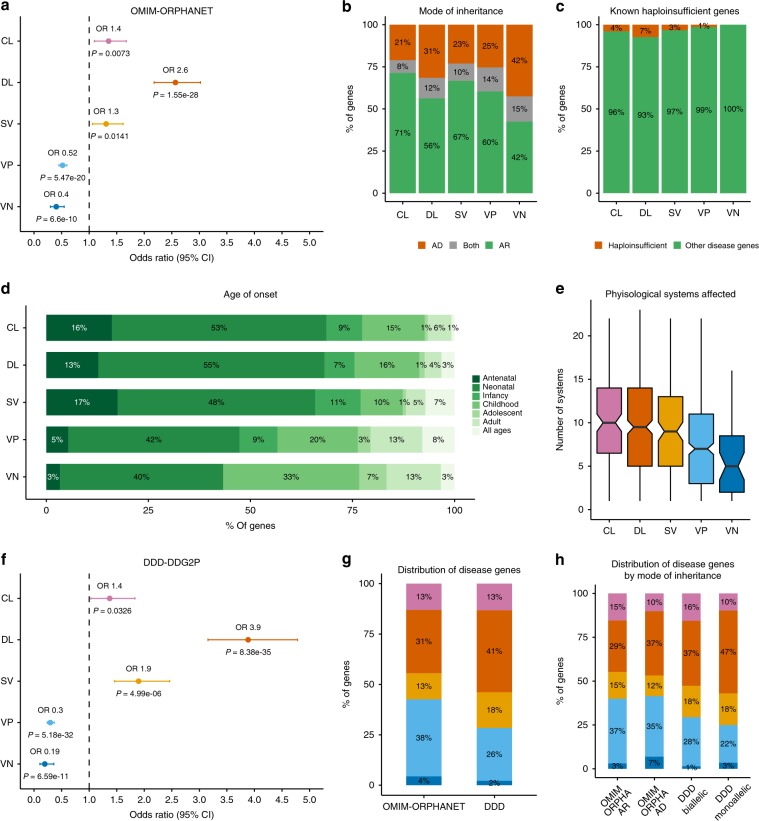
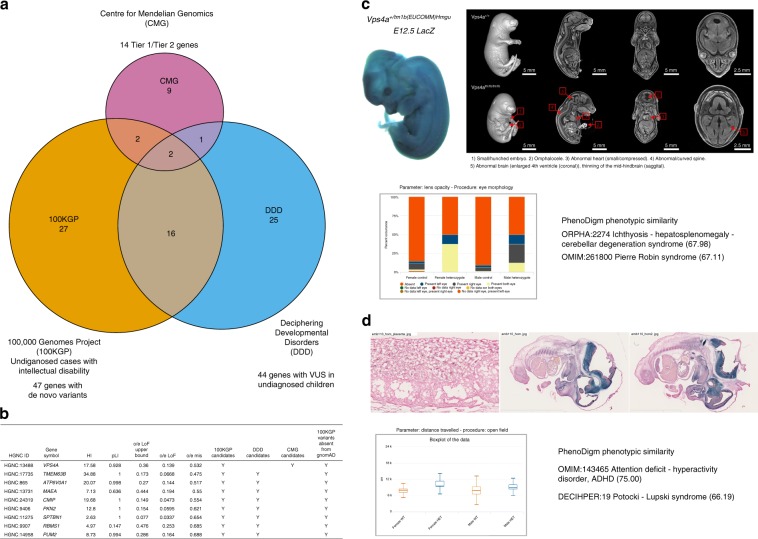
The identification of causal variants in sequencing studies remains a considerable challenge that can be partially addressed by new gene-specific knowledge. Here, we integrate measures of how essential a gene is to supporting life, as inferred from viability and phenotyping screens performed on knockout mice by the International Mouse Phenotyping Consortium and essentiality screens carried out on human cell lines. We propose a cross-species gene classification across the Full Spectrum of Intolerance to Loss-of-function (FUSIL) and demonstrate that genes in five mutually exclusive FUSIL categories have differing biological properties. Most notably, Mendelian disease genes, particularly those associated with developmental disorders, are highly overrepresented among genes non-essential for cell survival but required for organism development. After screening developmental disorder cases from three independent disease sequencing consortia, we identify potentially pathogenic variants in genes not previously associated with rare diseases. We therefore propose FUSIL as an efficient approach for disease gene discovery.


Conflict of interest statement

The authors declare no competing interests.

Figures

Fig. 1
Fig. 1. Cross-species FUSIL categories of intolerance to LoF.
a Correspondence between primary viability outcomes in mice and human cell line screens. The sankey diagram shows how human orthologues of mouse genes with IMPC primary viability assessment (lethal, subviable and viable) regroup into essential and non-essential human cell categories; the width of the bands is proportional to the number of genes. b Gene Ontology Biological Process (GO BP) enrichment results. Significantly enriched GO terms at the biological process level were computed using the set of IMPC mouse-to-human orthologues incorporated into the FUSIL categories as a reference (Table 1) and identified after correcting for multiple comparisons. Significant results were only found for the cellular and developmental lethal gene categories. Bubble size is proportional to the frequency of the term in the database and the colour indicates significance level as obtained in the enrichment analysis. The GO terms associated with embryo development are in bold. c Correspondence between mouse embryonic lethality stage and essentiality in human cell lines. Embryonic lethal LoF strains are assessed for viability at selected stages during embryonic development: early (gestation) lethal (prior to E9.5), mid (gestation) lethal (E9.5–E14.5/15.5), late (gestation) lethal (E14.5/E15.5 onwards). E embryonic day.
Fig. 2
Fig. 2. FUSIL categories and human gene features.
a Notched box plots showing the distribution of recombination rates for the different FUSIL bins. Human recombination rates were mapped to the closest gene and average recombination rates per gene were computed. b Distribution of human gene expression values for different tissues. Median logTPM expression values from the GTEx database for selected non-correlated tissues are shown. c Protein–protein interaction network parameters. Notched box plots showing the distribution of degree and topological coefficient computed from human protein–protein interaction data extracted from STRING. Only high-confidence interactions, defined as those with a combined score of >0.7, were kept. d Protein complexes. Bar plots representing the percentage of genes in each FUSIL bin being part of a protein complex (human protein complexes). e Paralogues. The bar plot shows the percentage of genes without a protein-coding paralogue gene in each FUSIL bin. Paralogues of human genes were obtained from Ensembl Genes 95. A cut-off of 30% amino acid similarity was used. f Probability of mutation. Distribution of gene-specific probabilities of mutation from Samocha et al.. g Transcript length. Maximum transcript lengths among all the associated gene transcripts (Ensembl Genes 95, hsapiens data set). h GIMS Selection Score. Distribution of Gene-level Integrated Metric of negative Selection (GIMS) scores across the different FUSIL bins. i Probability of loss-of-function intolerance (pLI) retrieved from gnomAD2.1. Notched box plots and density plots showing the bimodal distribution of this score, with higher values indicating more intolerance to variation. j Distribution of gnomAD o/e LoF scores. Upper bound fraction of the confidence interval around the observed versus expected LoF score ratio (gnomAD 2.1.). A score <0.35 (dashed line) has been suggested to identify intolerant to LoF variation genes. For ac, f, gj: centre line, median; notch, CI around the median; box edges, interquartile range, 75th and 25th percentile, respectively; whiskers, 1.5 times the interquartile range; outliers not shown. Significance for pairwise comparisons for all features is shown in Supplementary Tables 4 and 5. CL cellular lethal (pink), DL developmental lethal (orange), SV subviable (yellow), VP viable with phenotypic abnormalities (light blue), VN viable with normal phenotype (dark blue).
Fig. 3
Fig. 3. Human disease genes and FUSIL bins.
a Enrichment analysis of Mendelian disease genes. Combined OMIM-ORPHANET data was used to compute the number of disease genes in each FUSIL bin. Odds ratios were calculated by unconditional maximum likelihood estimation (Wald) and confidence intervals (CIs) using the normal approximation, with the corresponding adjusted P values for Fisher’s exact test. b Distribution of disease-associated genes according to mode of inheritance. Disease genes with annotations regarding the mode of inheritance according to the Human Phenotype Ontology. c Haploinsufficient genes. Known haploinsufficient genes curated by ClinGen (percentage with respect to the total number of disease genes in each bin). d Age of onset as described in rare diseases epidemiological data from Orphanet (Orphadata). The earliest age of onset associated with each gene was used. Bar plots representing the percentage of disease genes associated with each age of onset for each FUSIL category. e Distribution of the number of physiological systems affected. The phenotypes (HPO) associated with each gene were mapped to the top level of the ontology to compute the number of unique physiological systems affected. f Enrichment analysis of developmental disorder genes. The Developmental Disorders Genotype-Phenotype Database (DDD-DDG2P) set of genes was used to compute the number of developmental disorder genes in each FUSIL bin. These genes were compared against non-disease genes (OMIM, ORPHANET and DDD-DD2GP). Odds ratios were calculated by unconditional maximum likelihood estimation (Wald) and confidence intervals (CIs) using the normal approximation, with the corresponding adjusted P values for Fisher’s exact test. g Distribution of disease genes. Percentage of distribution of Mendelian and developmental disorder genes among the different FUSIL categories. h Distribution of disease genes by mode of inheritance. Percentage of distribution of Mendelian and developmental disorder genes among the different FUSIL categories according to the mode of inheritance reported in the HPO (set of Mendelian disease genes) and DDD (developmental disease-associated genes). CL cellular lethal (pink), DL developmental lethal (orange), SV subviable (yellow), VP viable with phenotypic abnormalities (light blue), VN viable with normal phenotype (dark blue), DDD/DDD-DDG2P Deciphering Developmental Disorders database of genes that are likely causative of developmental disorders. For e, centre line, median; notch, CI around the median; box edges, interquartile range, 75th and 25th percentile, respectively; whiskers, 1.5 times the interquartile range.
Fig. 4
Fig. 4. Developmental disorders gene candidate prioritisation.
a Venn diagram showing the overlap between DL prioritised genes with evidence from 3 large-scale sequencing programmes. Overlap between the set of 163 developmental genes highly intolerant to LoF variation (pLI > 0.90 or o/e LoF upper bound < 0.35 or HI < 10) and not yet associated with disease and the set of candidate genes from three large rare disease sequencing consortia: 100KGP, CMG, and DDD. b Set of nine candidate genes. The selected genes met the following criteria: (1) evidence from both the 100KGP (with detailed clinical phenotypes and variants) and either DDD (variants and high-level phenotypes available) or CMG (gene and high-level phenotypes available), (2) the associated variants were not present in gnomAD, and (3) intolerance to missense variation; these genes were further prioritised based on the number of unrelated probands and the phenotypic similarity between them and the existence of a mouse knockout line with embryo and adult phenotypes that mimic the clinical phenotypes. c Mouse evidence for VPS4A. IMPC embryonic phenotyping of homozygous mutants at E18.5 showed abnormal/curved spine and abnormal brain among other relevant phenotypes. The phenotypic abnormalities observed in heterozygous knockout mice include lens opacity. Heterozygous mouse phenotypic similarity to known disorders as computed by the PhenoDigm algorithm. d Mouse evidence for TMEM63B. IMPC homozygous mouse embryo lacZ imaging at E14.5 supporting neuronal expression during development. Heterozygous IMPC knockout mice associated phenotypes included abnormal behaviour evaluated through different parameters. The heterozygous mice showed a high phenotypic similarity with several developmental disorder phenotypes. VUS variant of unknown significance.

References

    1. Bamshad MJ, et al. The Centers for Mendelian Genomics: a new large-scale initiative to identify the genes underlying rare Mendelian conditions. Am. J. Med. Genet. A. 2012;158a:1523–1525. doi: 10.1002/ajmg.a.35470. - DOI - PMC - PubMed
    1. Deciphering Developmental Disorders Study. Prevalence and architecture of de novo mutations in developmental disorders. Nature. 2017;542:433–438. doi: 10.1038/nature21062. - DOI - PMC - PubMed
    1. Thormann A, et al. Flexible and scalable diagnostic filtering of genomic variants using G2P with Ensembl VEP. Nat. Commun. 2019;10:2373. doi: 10.1038/s41467-019-10016-3. - DOI - PMC - PubMed
    1. Splinter K, et al. Effect of genetic diagnosis on patients with previously undiagnosed disease. N. Engl. J. Med. 2018;379:2131–2139. doi: 10.1056/NEJMoa1714458. - DOI - PMC - PubMed
    1. Petrovski S, Wang Q, Heinzen EL, Allen AS, Goldstein DB. Genic intolerance to functional variation and the interpretation of personal genomes. PLoS Genet. 2013;9:e1003709. doi: 10.1371/journal.pgen.1003709. - DOI - PMC - PubMed

Publication types