. 2020 Jan 31;11(1):656.
doi: 10.1038/s41467-020-14432-8.

Fast temporal dynamics and causal relevance of face processing in the human temporal cortex

Affiliations

Fast temporal dynamics and causal relevance of face processing in the human temporal cortex

Jessica Schrouff et al. Nat Commun. .

Abstract

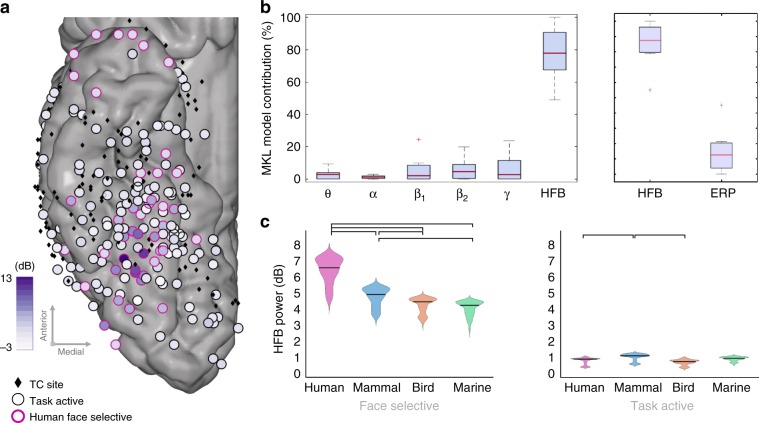
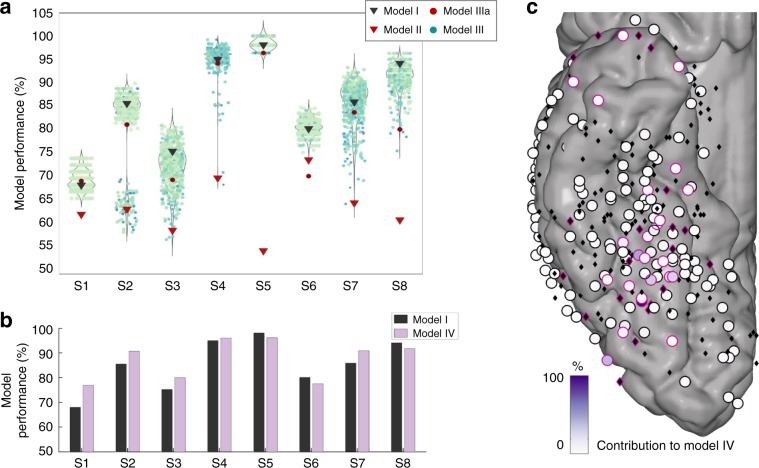
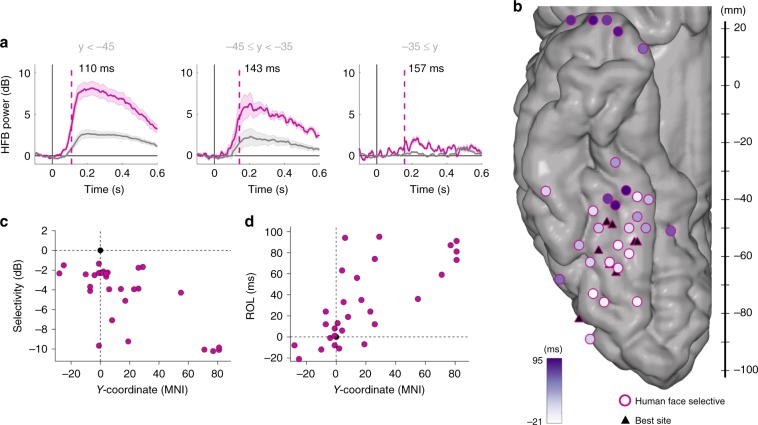
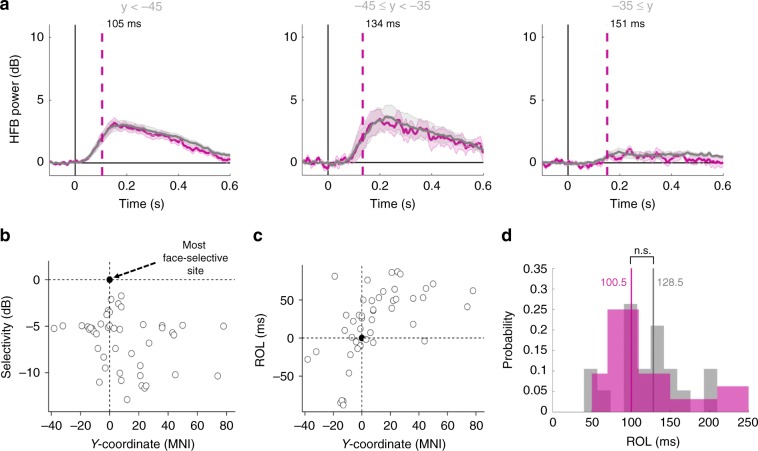
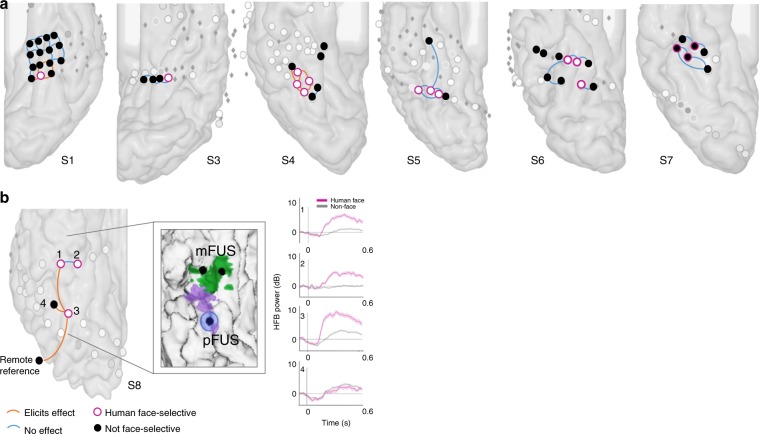
We measured the fast temporal dynamics of face processing simultaneously across the human temporal cortex (TC) using intracranial recordings in eight participants. We found sites with selective responses to faces clustered in the ventral TC, which responded increasingly strongly to marine animal, bird, mammal, and human faces. Both face-selective and face-active but non-selective sites showed a posterior to anterior gradient in response time and selectivity. A sparse model focusing on information from the human face-selective sites performed as well as, or better than, anatomically distributed models when discriminating faces from non-faces stimuli. Additionally, we identified the posterior fusiform site (pFUS) as causally the most relevant node for inducing distortion of conscious face processing by direct electrical stimulation. These findings support anatomically discrete but temporally distributed response profiles in the human brain and provide a new common ground for unifying the seemingly contradictory modular and distributed modes of face processing.


Conflict of interest statement

The authors declare no competing interests.

Figures

Fig. 1
Fig. 1. Effect of species on face coding.
a Task-active and human face-selective sites across subjects in HFB. The coordinates of the electrodes from left hemisphere subjects were mirrored such that all sites could be displayed on a single hemisphere. Among the 357 included TC sites (represented by black diamonds), 190 were task active (represented by circles) as defined by permutation tests (i.e., presenting a significant response to at least one category). The difference between their response to human faces and non-face stimuli are displayed as a color-coded fill. In total, 48 task-active sites were identified as selective for human faces (represented with a pink contour). b HFB activity has the highest contribution in the discrimination between human faces and non-faces, within and across subjects. The results of the MKL model are plotted as box plots of the frequency band contributions to the model across the eight subjects, with the median represented by a red line. Similarly, HFB is favored over ERPs in an MKL model combining HFB power and ERPs. c HFB amplitude averaged within the [150 500]ms time window after onset for each of the four subcategories, in face-selective (left) and task-active sites (right). Coloring and initials represent the face subcategories: human (H/pink), mammal (M/blue), bird (B/orange), and marine (Ma/green). For face-selective sites, significant differences can be found (paired permutation tests, displayed by a black bracket) between the HFB responses to human faces and the mammal, bird, and marine faces, as well as between the mammal and the bird and marine faces. There is no significant difference between the responses to bird and marine faces. For task-active sites (i.e., active but not face selective), significant differences can be found between the bird faces and the human and mammal faces.
Fig. 2
Fig. 2. Nature and amount of face information on TC sites in decoding settings.
a Dark grey triangles represent the performance of model I, i.e., including all TC sites. Performance of model II is represented by red triangles. Red circles represent the performance of model IIIa. Each colored dot represents one of the “random set” models (499 models per subject, model III), their color representing the proportion of face sites were included in the model (dark blue is one face site, light green is all face sites). Violin plots represent the distribution of the “random set” model performances compared to models I and II. b Sparse models perform as well as or better than distributed models. Bar plot representing the balanced accuracy for model I compared to the model accuracy of the sparse model IV, for each subject. c Site contributions to the sparse model, plotted across subjects. The contribution of the site (in %) is represented by a color-coded fill. Black diamonds have a perfectly null contribution to the model while circles had a positive contribution to the model. Sites assessed as human face selective by the univariate analysis are highlighted by a pink rim.
Fig. 3
Fig. 3. Temporal distribution of human face information on face-selective sites.
a Average traces and ROL according to y-coordinate. Mean (±standard error) HFB traces across face-selective sites in the posterior (<−45, n = 24), middle (−45 to −35, n = 7), and anterior (after −35, n = 6) TC sites for human faces (pink) and non-faces (grey) stimuli. b Response onset latency (ROL) over human face-selective sites for the human face category, as represented by a purple color scale fill on the MNI cortex with the best (i.e., most human face selective) site in each individual chosen as the point of reference (triangles). Here only relevant electrodes are shown. c ROL in each subject, when compared to MNI y-coordinate with the best site in each individual chosen as the point of reference. Latency is related to anatomical location of the sites. d) Selectivity in each subject, when compared to MNI y-coordinate with the best site (i.e., most human face selective) in each individual chosen as the point of reference. The best site is represented as a black circle, at the crossing of the two axes. Selectivity is related to anatomical position.
Fig. 4
Fig. 4. Temporal distribution of human face information on task-active sites.
a Mean (±standard error) HFB traces across task-active sites in the posterior (<−45, n = 24), middle (−45 to −35, n = 7), and anterior (after −35, n = 6) sites for human faces (pink) and non-faces (grey) stimuli. b Selectivity in each subject, when compared to MNI y-coordinate with the best (i.e., most human face selective) site in each individual chosen as the point of reference. The best site is represented as a black circle, at the crossing of the two axes. Selectivity is not related to anatomical position. c ROL in each subject, when compared to MNI y-coordinate with the best site in each individual chosen as the point of reference. Latency is related to anatomical location of the sites. d Histograms (in probabilities) of ROL values for human face-selective sites (n = 32) and their matched task-active sites in terms of y-coordinate (n = 19). N.s. refers to a non-significant difference between the two distributions.
Fig. 5
Fig. 5. Electrical brain stimulation.
Effect of electrical stimulation applied to a pair of electrodes is shown with lines colored in orange (stimulation of this pair affects subjective face perception) or blue (stimulation of this pair has no effect on subjective face perception). Human face-selective electrodes are outlined in pink. a Depicts the localization of stimulated sites on subjects 1, 3, 4, 5, 6, and 7 using the same convention as in Supplementary Figs. 1 and 2. b Displays the same results for S8 and investigates further the localization of the stimulated sites. In the inset figure, the location of sites 1, 2, and 3 are shown on top of the fMRI patches of mFUS (green) and pFUS (purple). The estimated cortical area affected by the stimulation of site 3 is shown with a blue circle around it. The cortical area was estimated using the parameters recently validated in a separate cohort. Site 3 in subject 8 is the site whose stimulation caused distortion of faces when it was stimulated in pairs with site 1 (another face elective site), nearby site 4 (task-active site), and a remote reference site. Right panel shows the HFB responses to human faces (pink) and non-faces (grey) of the sites that were stimulated. Please see Supplementary Movie 1 for the video of subject S8’s verbal responses after being stimulated.

References

    1. Damasio AR, Damasio H, Van Hoesen GW. Prosopagnosia: anatomic basis and behavioral mechanisms. Neurology. 1982;32:331–341. doi: 10.1212/WNL.32.4.331. - DOI - PubMed
    1. Meadows JC. The anatomical basis of prosopagnosia. J. Neurol. Neurosurg. Psychiatry. 1974;37:489–501. doi: 10.1136/jnnp.37.5.489. - DOI - PMC - PubMed
    1. Sergent J, Ohta S, MacDonald B. Functional neuroanatomy of face and object processing. A positron emission tomography study. Brain. 1992;115(Pt 1):15–36. doi: 10.1093/brain/115.1.15. - DOI - PubMed
    1. Puce A, Allison T, Gore JC, McCarthy G. Face-sensitive regions in human extrastriate cortex studied by functional MRI. J. Neurophysiol. 1995;74:1192–1199. doi: 10.1152/jn.1995.74.3.1192. - DOI - PubMed
    1. Kanwisher N, McDermott J, Chun MM. The fusiform face area: a module in human extrastriate cortex specialized for face perception. J. Neurosci. 1997;17:4302–4311. doi: 10.1523/JNEUROSCI.17-11-04302.1997. - DOI - PMC - PubMed

Publication types