. 2020 Jan 31;10(1):1597.
doi: 10.1038/s41598-020-58482-w.

Hypoxia-inducible factor (HIF) prolyl hydroxylase inhibitors induce autophagy and have a protective effect in an in-vitro ischaemia model

Affiliations

Hypoxia-inducible factor (HIF) prolyl hydroxylase inhibitors induce autophagy and have a protective effect in an in-vitro ischaemia model

Ayesha Singh et al. Sci Rep. .

Erratum in

Abstract

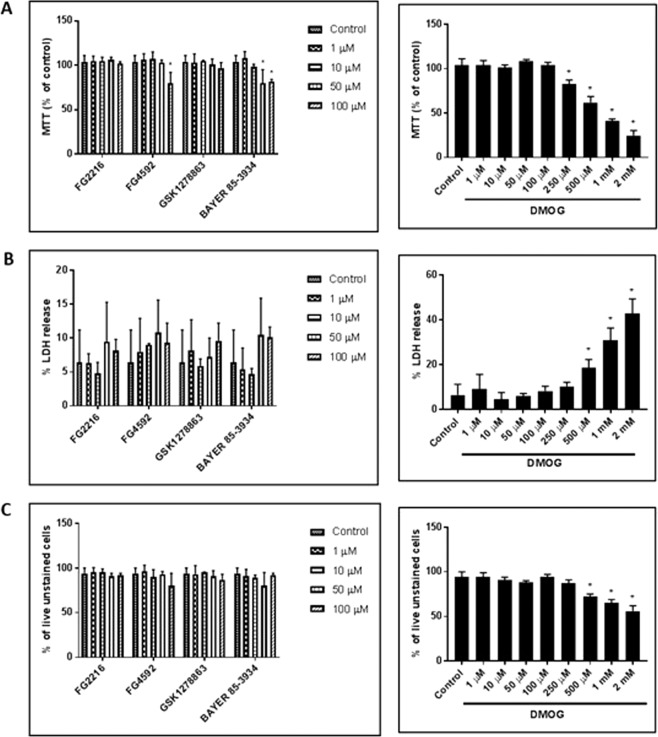
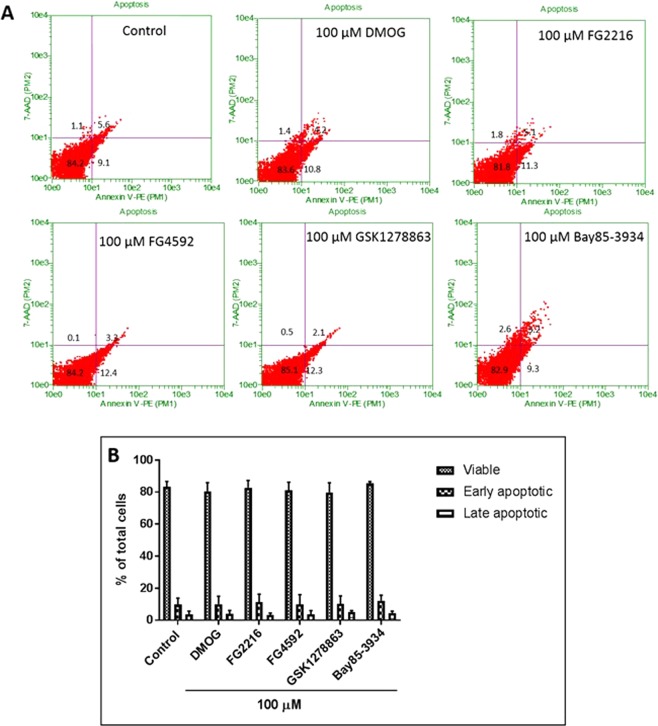
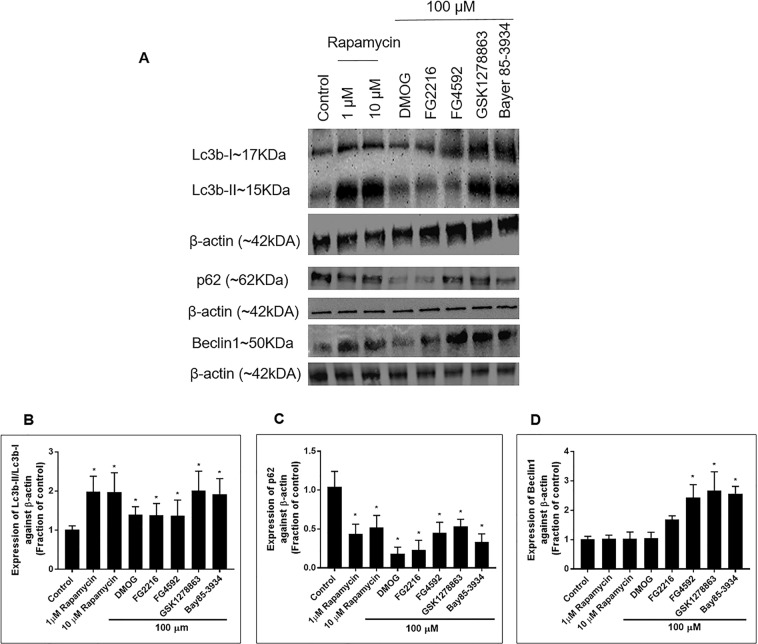
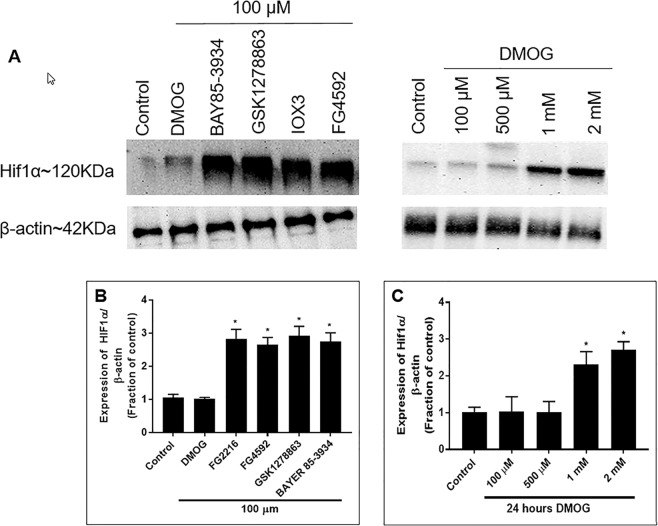
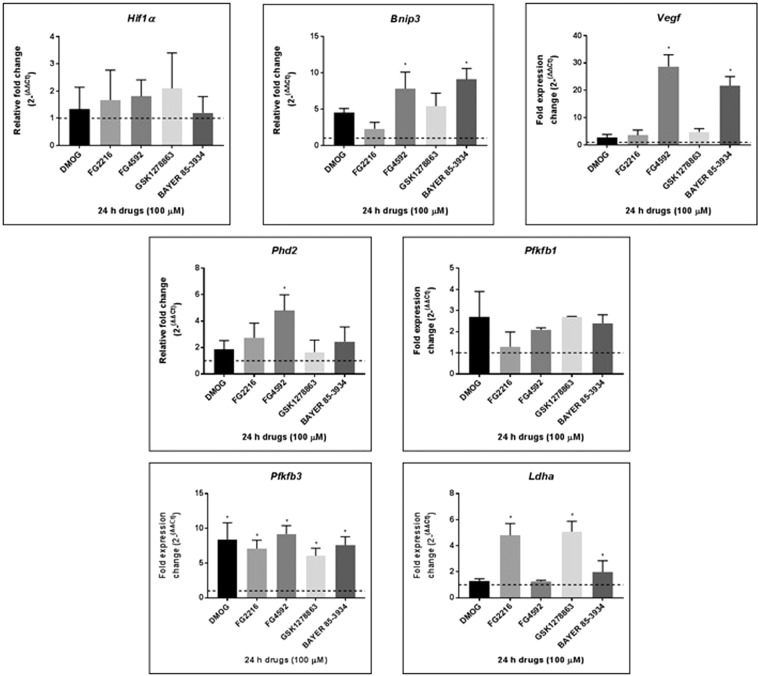
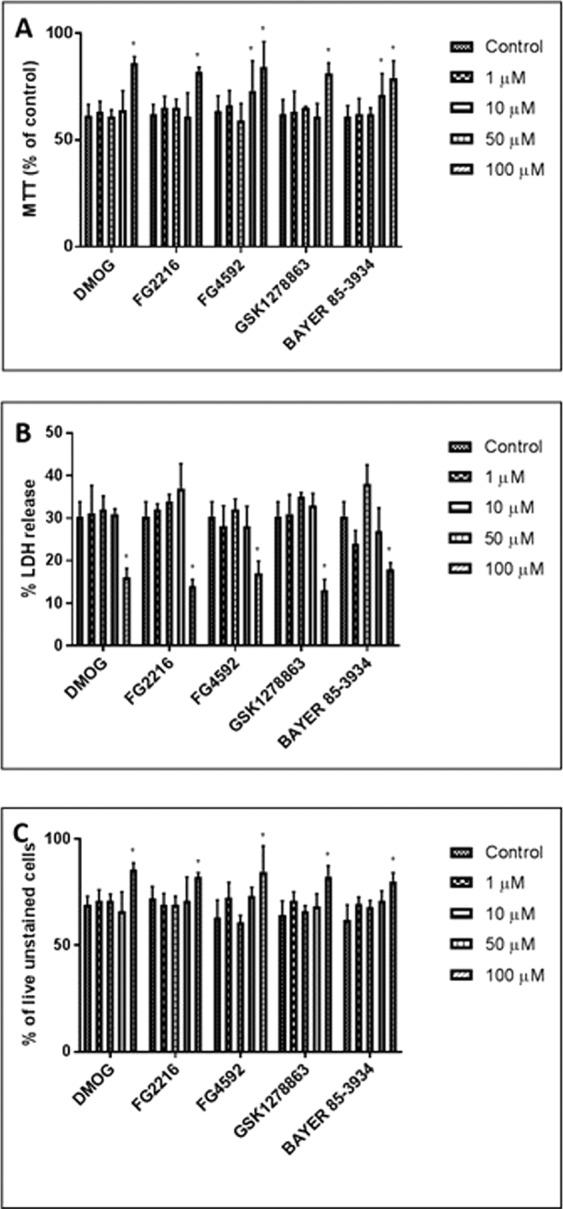
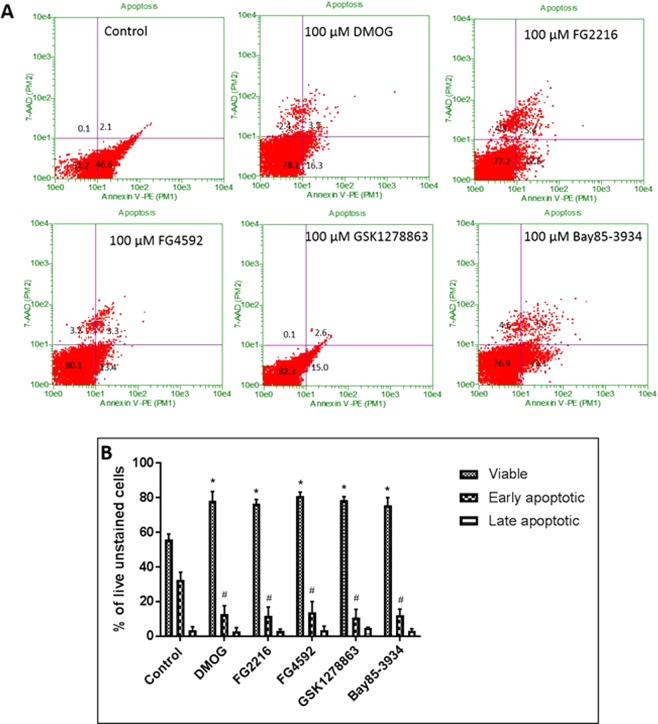
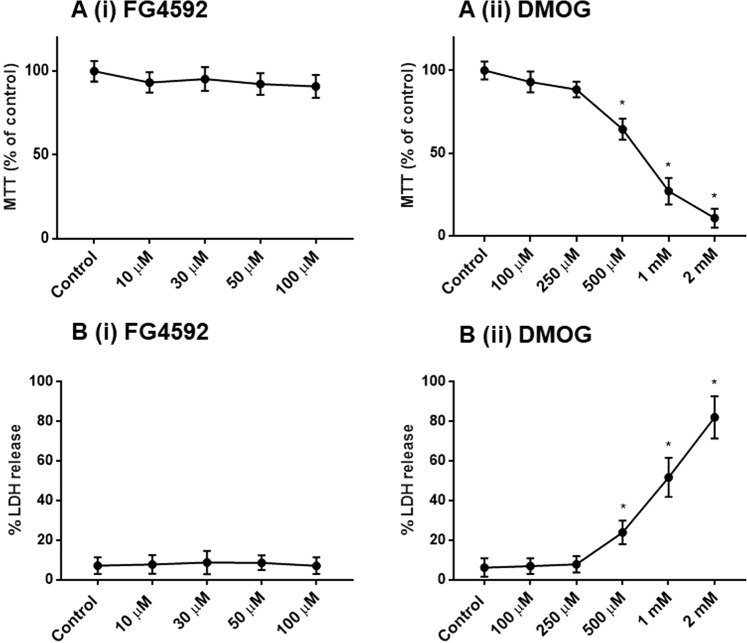
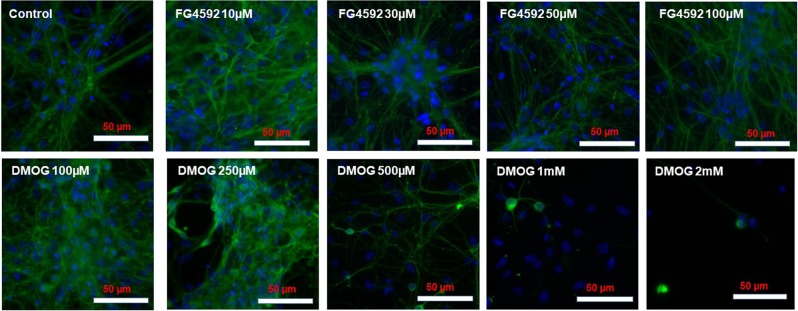
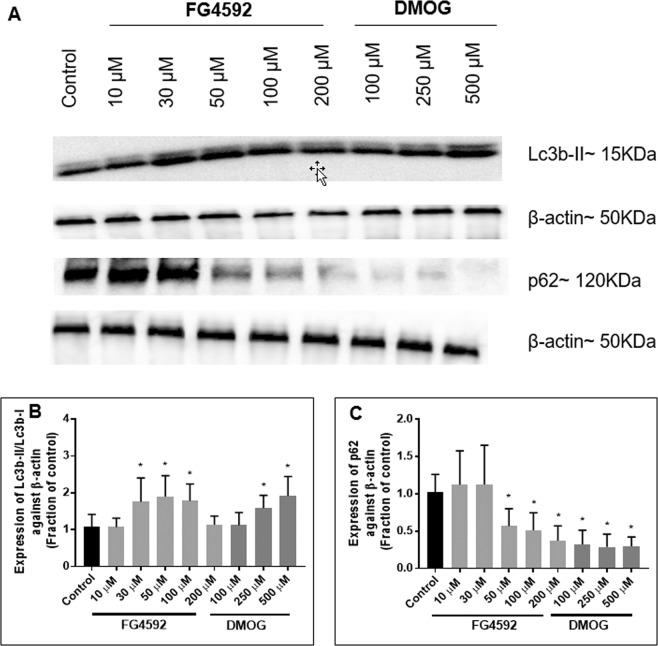
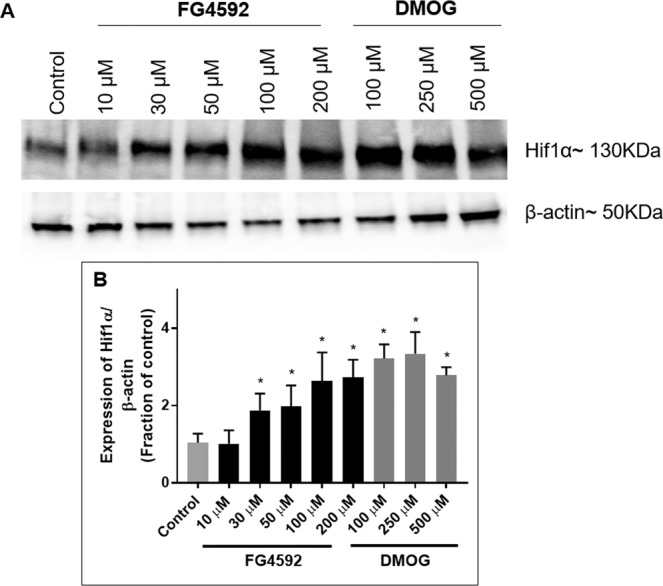
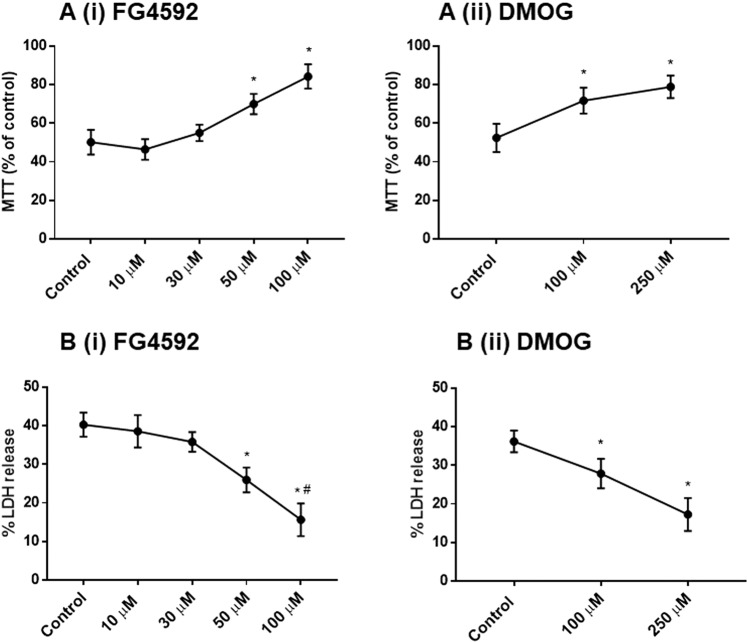
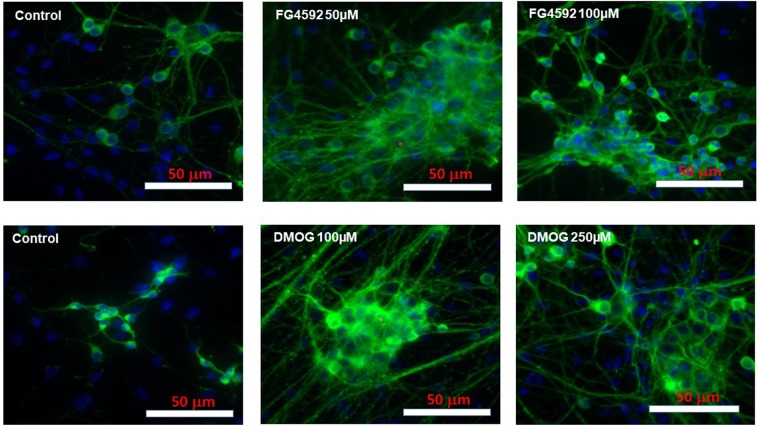
This study compared effects of five hypoxia-inducible factor (HIF) prolyl hydroxylases (PHD) inhibitors on PC12 cells and primary rat neurons following oxygen-glucose deprivation (OGD). At 100 µM, the PHD inhibitors did not cause cytotoxicity and apoptosis. MTT activity was only significantly reduced by FG4592 or Bayer 85-3934 in PC12 cells. The PHD inhibitors at 100 µM significantly increased the LC3-II/LC3-I expression ratio and downregulated p62 in PC12 cells, so did FG4592 (30 µM) and DMOG (100 µM) in neurons. HIF-1α was stabilised in PC12 cells by all the PHD inhibitors at 100 µM except for DMOG, which stabilised HIF-1α at 1 and 2 mM. In primary neurons, HIF-1α was stabilised by FG4592 (30 µM) and DMOG (100 µM). Pretreatment with the PHD inhibitors 24 hours followed by 24 hour reoxygenation prior to 6 hours OGD (0.3% O2) significantly reduced LDH release and increased MTT activity compared to vehicle (1% DMSO) pretreatment. In conclusion, the PHD inhibitors stabilise HIF-1α in normoxia, induce autophagy, and protect cells from a subsequent OGD insult. The new class of PHD inhibitors (FG4592, FG2216, GSK1278863, Bay85-3934) have the higher potency than DMOG. The interplay between autophagy, HIF stabilisation and neuroprotection in ischaemic stroke merits further investigation.


Conflict of interest statement

The authors declare no competing interests.

Figures

Figure 1
Figure 1
PC12 cells were cultured in normoxia (21% O2) for 24 hours with the PHD inhibitors (FG4592, FG2216, GSK1278863, Bay85-3934; concentration of 1, 10, 50, 100 µM) and DMOG (1, 10, 50, 100, 250, 500 µM, 1 and 2 mM). (A) MTT assays (n = 3) reveals reduction in mitochondrial activity (MTT release) in cells subjected to 100 µM of FG4592 and 50 & 100 µM of Bay85-3934 in comparison to 1% DMSO. The other inhibitors did not significantly affect mitochondrial activity. A significant reduction in MTT release was seen by 250, 500 µM, 1 and 2 mM of DMOG in comparison to 1% DMSO; (B). LDH assays (n = 3) revealed no significant changes in structural integrity (% LDH release) with FG4592, FG2216, GSK1278863, Bay85-3934 at all concentrations. DMOG increased % LDH release and resulted in significant cytotoxicity at concentration of 500 µM, 1 and 2 mM; (C). Trypan blue exclusion assay (n = 3) revealed no significant changes in % of live (trypan blue unstained cells) with FG4592, FG2216, GSK1278863, Bay85-3934 at all concentrations. DMOG significantly decreased % of live cells at concentration of 500 µM, 1 and 2 mM. Data were expressed as mean ± S.D. *Indicates P < 0.05 against 1% DMSO treated PC12 cells (Two-way ANOVA, Tukey’s post-hoc analysis).
Figure 2
Figure 2
Annexin-V and 7-AAD FACS analysis of PC12 cells treated with HIF-PHD inhibitors (100 µM) in normoxia (21% O2) for 24 hours. (A) Representative dot plots of Annexin-V/7-AAD FACS analysis of cells treated with the vehicle (1% DMSO) and the inhibitors. Cells in lower left quadrant represent viable cells, cells in lower right quadrant represent early apoptosis and cells in upper right quadrant represent late apoptosis/necrosis; (B) The group data (n = 3) representing % of viable, early and late apoptotic cells. There was no significant different in any of the treatments groups compared to 1% DMSO treatment. Data were expressed as mean ± S.D.
Figure 3
Figure 3
Immunoblot analysis of the protein expression of Lc3b-II, Lc3b-I, p62 and Beclin1 in PC12 cells treated with the indicated PHD inhibitors (100 µM) and rapamycin (1 & 10 µM) for 24 hours in normoxia. (A) Representative immunoblots of Lc3b-II, Lc3b-I, p62 and Beclin1 were shown alongside β-actin; (B) Normalised Lc3b-II/Lc3b-I ratio measured after 24 hours exposure to the indicated PHD inhibitors and rapamycin in normoxia (n = 3). Significant increase in the Lc3b-II/Lc3b-I ratio was seen with rapamycin (1 & 10 µM) and 100 µM of DMOG, FG2216, FG4592, GSK1278863 and Bay85-3934. GSK1278863 and Bay85-3934 had a similar effect on the Lc3b-II/Lc3b-I ratio as Rapamycin; (C) Expression of p62 measured after 24 hours exposure to the indicated PHD inhibitors and rapamycin in normoxia (n = 3). Significant reduction in p62 expression in comparison to vehicle (1% DMSO)-treated cells was seen with rapamycin (1 & 10 µM) and 100 µM of DMOG, FG2216, FG4592, GSK1278863 and Bay85-3934 treated cells; (D) Expression of Beclin1 measured after 24 hours exposure to the indicated PHD inhibitors and rapamycin in normoxia (n = 3). Significant upregulation of Beclin1 expression in comparison to vehicle (1% DMSO)-treated cells was seen in 100 µM of DMOG, FG2216, FG4592, GSK1278863 and Bay85-3934 treated cells, but was not in the Rapamycin treated cells. Data were expressed as mean ± S.D. *Indicated P < 0.05 against 1% DMSO treatment (Two-way ANOVA, Tukey’s post-hoc analysis).
Figure 4
Figure 4
Immunoblot analysis of HIF-1α levels in PC12 cells treated with 100 µM of the indicated PHD inhibitors and DMOG (100 µM, 500 µM, 1 mM, 2 mM) for 24 hours in normoxia (21% O2). (A) Representative HIF-1α immunoblots were shown with those for β-actin; (B) Graph (n = 3) showed the normalised HIF-1α level measured at 24 hours after exposure to the indicated PHD inhibitors (100 µM) in normoxia. 24 hours incubation with 100 µM of FG2216, FG4592, GSK1278863 and Bay85-3934 significantly increased HIF-1α protein levels, while 100 µM DMOG did not change the HIF-1α proteinlevels; (C) Graph (n = 3) showing normalised HIF-1α level at 24 hours after exposure to DMOG (100 µM, 500 µM, 1 mM, 2 mM) in normoxia. Both 1 mM and 2 mM DMOG increased HIF-1α protein levels in normoxia. Data were expressed as mean ± S.D. *Indicated P < 0.05 against 1% DMSO treatment (Two-way ANOVA, Tukey’s post-hoc analysis).
Figure 5
Figure 5
Effects of HIF PHD inhibitors on hypoxia gene expression. Expression of hypoxia genes, HIF1α, Bnip3, Phd2, Vegf, Pfkfb1, Pfkfb3, Ldha, after treatment with 100 µM PHD inhibitors in normoxia for 24 hours were normalised to β-actin levels. Significant upregulation of Bnip3 and Vegf was seen with FG4592 and Bay85-3934. Phd2 was significant upregulated by FG4592. Pfkfb3 was significantly upregulated by DMOG, FG2216, FG492, GSK1278863, and Bay85-3934. Ldha was significantly upregulated by FG2216, GSK1278863 and Bay85-3934. HIF1α was not changed by any of the HIF PHD inhibitors. Each data point represented the mean and standard deviation of the relative fold change with respect to 1% DMSO-treated sample normalised to reference gene β-actin level. The dotted line represented basal gene expression. Statistical significance was indicated as *P < 0.05 (Two-way ANOVA, Tukey’s post-hoc analysis).
Figure 6
Figure 6
The effect of preconditioning with HIF-PHD inhibitors followed by 24 hours re-oxygenation and 6 hours OGD on PC12 cells. PC12 cells were exposed to the PHD inhibitors (1, 10, 50 and 100 µM) for 24 hours in normoxia (21% O2) followed by 24 hours re-oxygenation (21% O2) and subsequent 6 hours OGD insult (0.3% O2). (A) MTT assay (n = 3) showed greater mitochondrial activity after 6 hours OGD in cells preconditioned with 100 µM of DMOG, FG2216, or GSK1278863 and 50 & 100 µM of FG4592 or Bay 85-3934 compared to 1% DMSO pretreatment; (B) LDH assays (n = 3) revealed reduced LDH release in cells preconditioned with 100 µM of DMOG, FG2216, FG4592, GSK1278863, or Bay 85-3934 prior to 6 hours OGD compared to 1% DMSO pretreatment; (C) Trypan blue exclusion assays (n = 3) reveal increased live (unstained) cells in cells preconditioned with 100 µM of DMOG, FG2216, FG4592, GSK1278863, or Bay 85-3934 prior to 6 hours OGD compared to 1% DMSO pretreatment. Data were expressed as mean ± S.D. *Indicated P < 0.05 against 1% DMSO (Two-way ANOVA, Tukey’s post-hoc analysis).
Figure 7
Figure 7
Annexin-V/7-AAD FACS analysis of PC12 cells preconditioned with the HIF PHD inhibitors followed by 24 hours re-oxygenation and 6 hours OGD. PC12 cells were exposed to PHD inhibitors (100 µM) for 24 hours in normoxia (21% O2), followed by 24 hours re-oxygenation (21% O2) and subsequent 6 hours OGD treatment (0.3% O2). (A) Representative dot plots of Annexin-V/7-AAD FACS analysis of cells with the PHD inhibitor pre-treatment and 24 hours re-oxygenation followed by 6 hours OGD. Cells in the lower left quadrant represent viable cells, cells in the lower right quadrant represent early apoptosis and cells in upper right quadrant represent late apoptosis/necrosis; (B) The group data (n = 3) representing % of viable, early and late apoptotic cells. Significant reductions in the fractions of early apoptotic cells were seen in cells preconditioned with 100 µM of DMOG, FG2216, FG4592, GSK1278863 and Bay 85-3934 in comparison to 1% DMSO-treated cells following 24 hours re-oxygenation and 6 hours OGD. Data were expressed as mean ± S.D. *Indicated significance of viable cells P < 0.05 against 1% DMSO. #Indicated significance of apoptotic cells P < 0.05 against 1% DMSO (Two-way ANOVA, Tukey’s post-hoc analysis).
Figure 8
Figure 8
Effect of HIF-PHD inhibitors on primary rat neurons during normoxia. Primary rat cortical neurons were cultured in normoxia (21% O2) for 24 hours with control (1% DMSO), FG4592 (concentration of 10, 30 50, 100 µM) and DMOG (100, 250, 500 µM, 1 mM and 2 mM). (A) MTT assays (n = 3) reveals no significant changes in mitochondrial activity in primary neurons subjected to 10- 100 µM of FG4592 (i), while a significant reduction in MTT activity was seen 500 µM, 1 mM and 2 mM of DMOG (ii), in comparison to control (1% DMSO) treated cells; (B). LDH assays (n = 3) revealed no significant changes in LDH release (%) with FG4592 (10–100 µM)(i), while a significant increase in % LDH release was seen by 500 µM, 1 mM and 2 mM of DMOG (ii) in comparison to control (1% DMSO) treated neurons.
Figure 9
Figure 9
Representative double merged (FITC labelled neuron specific Tuj1 and DAPI stained nuclei) immunofluorescence images of primary rat neurons following FG4592 and DMOG treatment in normoxia. No morphological changes were observed with FG4592 treatment (10–100 µM) and DMOG (100, 250 µM), but DMOG (500 µM, 1 mM and 2 mM) treatment resulted in neurons with shorter and fewer neurites and reduced cell densities per microscopic field.
Figure 10
Figure 10
Effect of HIF-PHD inhibitors on the Lc3b-II/Lc3b-I and p62 expression in primary rat neurons. Immunoblot analysis of the Lc3b-II/Lc3b-I ratio and p62 in primary rat neurons treatment with 24 hours with control (1% DMSO), FG4592 (10, 30 50, 100 µM) and DMOG (100, 250 µM). (A) Representative Lc3b-II/Lc3b-I and p62 immunoblots alongside β-actin; (B) Normalised Lc3b-II/Lc3b-I ratio measured after 24 hours exposure to FG4592 or DMOG in normoxia (n = 3). Significant increase in the Lc3b-II/Lc3b-I ratio was seen with FG4592 (50, 100 µM) and DMOG (250, 500 µM) in comparison to control (1% DMSO-treated cells); (C) Expression of p62 measured after 24 hours exposure to FG4592 or DMOG in normoxia (n = 3). Significant reduction in p62 expression in comparison to control (1% DMSO-treated cells) was seen 50, 100 µM of FG4592 and 100, 250, 500 µM of DMOG treated cells. Error bars represent ± S.D. *Indicates P < 0.05 against control (1% DMSO treatment) (Two-way ANOVA, Tukey’s post-hoc analysis).
Figure 11
Figure 11
Effects of HIF-PHD inhibitors on HIF-1α levels in primary rat neurons. Immunoblot analysis of HIF-1α levels in primary cortical neurons treated with 24 hours with 1% DMSO, FG4592 (10, 30 50, 100 µM) and DMOG (100, 250 µM) in normoxia. (A) Representative HIF-1α immunoblots were shown with those for β-actin; (B) Graph (n = 3) showed the normalised HIF-1α level measured at 24 hours after exposure to FG4592 or DMOG in normoxia. FG4592 (30 µM onwards) and DMOG (100, 250 µM) significantly increased HIF-1α levels in primary rat neurons. Error bars represent ± S.D. *Indicates P < 0.05 against control (1% DMSO treatment) (Two-way ANOVA, Tukey’s post-hoc analysis).
Figure 12
Figure 12
The effect of preconditioning with HIF-PHD inhibitors followed by 24 hours re-oxygenation and 6 hours OGD on primary rat neurons. Primary cortical rat neurons were exposed to 1% DMSO, FG4592 (10, 30 50, 100 µM) and DMOG (100, 250 µM) for 24 hours in normoxia (21% O2) followed by 24 hours re-oxygenation (21% O2) and subsequent 6 hours OGD insult (0.3% O2). (A) MTT assay (n = 3) showed greater mitochondrial activity after 6 h OGD in neurons preconditioned with FG4592 (50, 100 µM) (i) and DMOG (100, 250 µM) (ii) compared to 1% DMSO pretreatment; (B) LDH assays (n = 3) reveal reduced LDH release in cells preconditioned with FG4592 (50, 100 µM) (i) and DMOG (100, 250 µM) (ii) prior to 6 h OGD compared to 1% DMSO pretreatment.
Figure 13
Figure 13
Representative double merged (FITC labelled neuron specific Tuj1 and DAPI stained nuclei) immunofluorescence images of primary rat neurons preconditioning with FG4592 and DMOG followed by 6 hours OGD. FG4592 (50, 100 µM) and DMOG (100, 250 µM) preconditioned neurons displayed longer and more neurites than those pretreated with 1% DMSO.

Similar articles

Cited by

References

    1. Wilkins SE, Abboud MI, Hancock RL, Schofield CJ. Targeting Protein-Protein Interactions in the HIF System. ChemMedChem. 2016;11(8):773–786. - PMC - PubMed
    1. Schofield CJ, Ratcliffe PJ. Oxygen sensing by HIF hydroxylases. Nature Reviews Molecular Cell Biology. 2004;5(5):343–354. - PubMed
    1. Kaelin WG, Ratcliffe PJ. Oxygen Sensing by Metazoans: The Central Role of the HIF Hydroxylase Pathway. Molecular Cell. 2008;30(4):393–402. - PubMed
    1. Davis CK, Jain SA, Bae O, Majid A, Rajanikant GK. Hypoxia Mimetic Agents for Ischemic Stroke. Frontiers in cell and developmental biology. 2018;6:175. - PMC - PubMed
    1. Yeh T, et al. Molecular and cellular mechanisms of HIF prolyl hydroxylase inhibitors in clinical trials. Chemical science. 2017;8(11):7651. - PMC - PubMed

Publication types

MeSH terms