. 2020 Jan 31;10(1):1584.
doi: 10.1038/s41598-020-58510-9.

A transcriptome-wide association study based on 27 tissues identifies 106 genes potentially relevant for disease pathology in age-related macular degeneration

Collaborators, Affiliations

A transcriptome-wide association study based on 27 tissues identifies 106 genes potentially relevant for disease pathology in age-related macular degeneration

Tobias Strunz et al. Sci Rep. .

Abstract

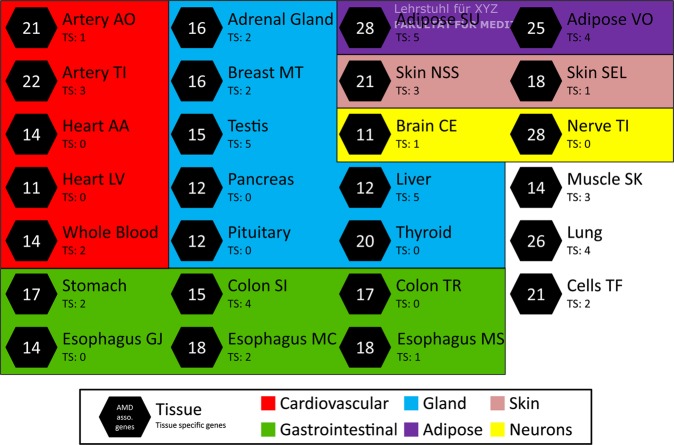
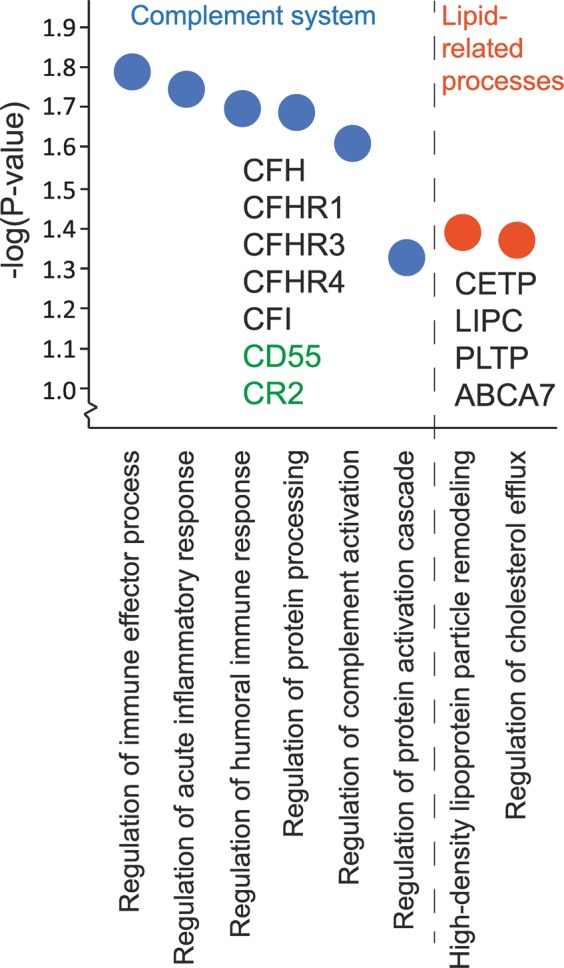
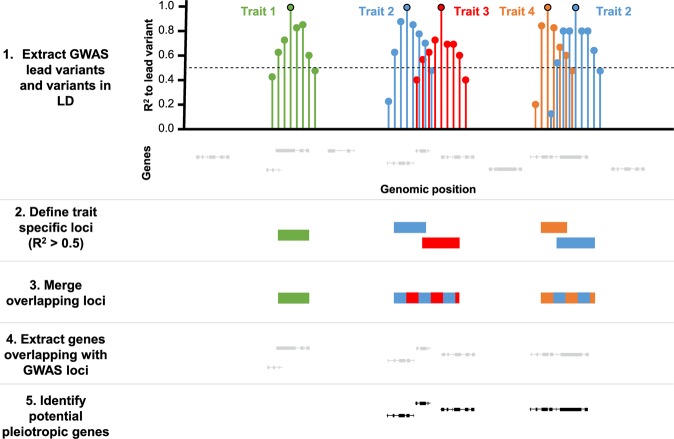
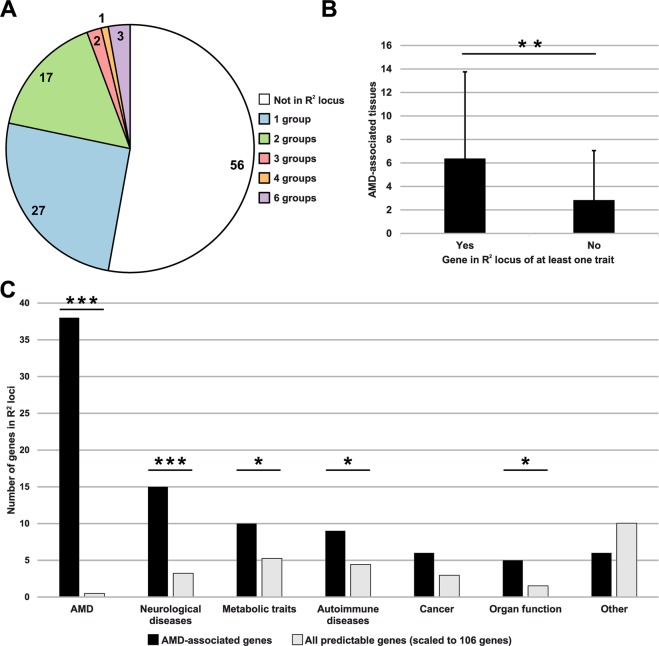
Genome-wide association studies (GWAS) for late stage age-related macular degeneration (AMD) have identified 52 independent genetic variants with genome-wide significance at 34 genomic loci. Typically, such an approach rarely results in the identification of functional variants implicating a defined gene in the disease process. We now performed a transcriptome-wide association study (TWAS) allowing the prediction of effects of AMD-associated genetic variants on gene expression. The TWAS was based on the genotypes of 16,144 late-stage AMD cases and 17,832 healthy controls, and gene expression was imputed for 27 different human tissues which were obtained from 134 to 421 individuals. A linear regression model including each individuals imputed gene expression data and the respective AMD status identified 106 genes significantly associated to AMD variants in at least one tissue (Q-value < 0.001). Gene enrichment analysis highlighted rather systemic than tissue- or cell-specific processes. Remarkably, 31 of the 106 genes overlapped with significant GWAS signals of other complex traits and diseases, such as neurological or autoimmune conditions. Taken together, our study highlights the fact that expression of genes associated with AMD is not restricted to retinal tissue as could be expected for an eye disease of the posterior pole, but instead is rather ubiquitous suggesting processes underlying AMD pathology to be of systemic nature.


Conflict of interest statement

The authors declare no competing interests.

Figures

Figure 1
Figure 1
TWAS results for 27 tissues. A TWAS was conducted based on the genotypes of 16,144 late-stage AMD cases and 17,832 AMD-free controls. Prediction models of 27 tissues were included in the analysis. The schematic overview demonstrates the number of significant AMD-associated genes (FDR < 1 × 10−3) within the respective tissue. If a gene was found exclusively in a single tissue, it was marked as tissue-specific (TS). Tissue classification was performed manually according to main functions or metabolic assignments. Adipose SU: Adipose Subcutaneous; Adipose VO: Adipose Visceral Omentum; Artery AO: Artery Aorta; Artery TI: Artery Tibial; Brain CE: Brain Cerebellum; Breast MT: Breast Mammary Tissue; Cells TF: Cells Transformed fibroblasts; Colon SI: Colon Sigmoid; Colon TR: Colon Transverse; Esophagus GJ: Esophagus Gastroesophageal Junction; Esophagus MC: Esophagus Mucosa; Esophagus MS: Esophagus Muscularis; Heart AA: Heart Atrial Appendage; Heart LV: Heart Left Ventricle; Muscle SK: Muscle Skeletal; Nerve TI: Nerve Tibial; Skin NSS: Skin Not Sun Exposed Suprapubic; Skin SEL: Skin Sun Exposed Lower leg.
Figure 2
Figure 2
Enriched GO biological processes in 106 genes identified (adjusted P-value < 0.05). Enrichr was used to assign gene ontology (GO) terms for the 106 AMD-associated genes and to investigate enriched GO biological processes. The eight significantly enriched processes are shown, clustered into the complement cascade and lipid-related processes. Genes are given for each process. Genes colored in green indicate those which were not identified previously in AMD-associated loci.
Figure 3
Figure 3
Work-flow for identification of pleiotropic genes. Genome-wide significant independent GWAS signals (P-value ≤ 5 × 10−8) were extracted for 82 complex traits and diseases from the corresponding publications. Additionally, variants in LD for each of the independent GWAS hits were included in the analysis. Linked variants with R2 > 0.5 demarcated the start- and stop-positions for a GWAS signal R2 Locus. Overlapping loci were merged to identify potential pleiotropic genomic regions. The genes overlapping with at least one R2 locus were identified.
Figure 4
Figure 4
Analysis of AMD-associated genes and their overlap with pleiotropic loci. (A) Number of genes, which overlapped with R2 loci of trait groups (B) Number of AMD-associated tissues per gene as identified by TWAS and overlap of genes with at least a single R2 locus (Mann-Whitney-U-Test P-value 0.0053) (C) Trait groups shared by AMD-associated genes identified in this study (black) and by all predictable genes (grey). The latter have been scaled from in total 24,388 to 106 genes to enable a better comparability. “Other” include “Aging”, “anthropometric traits”, “Blood cells”, “cardiovascular diseases”, “Complex eye diseases and traits”, “Lifestyle”, and “Immune-related traits”. Significance was assessed through a Fisher exact test. *P-value < 0.05; **P-value < 0.01; ***P-value < 0.001.

References

    1. Colijn JM, et al. Prevalence of Age-Related Macular Degeneration in Europe: The Past and the Future. Ophthalmology. 2017;124:1753–1763. doi: 10.1016/j.ophtha.2017.05.035. - DOI - PMC - PubMed
    1. Fritsche LG, et al. A large genome-wide association study of age-related macular degeneration highlights contributions of rare and common variants. Nat. Genet. 2016;48:134–143. doi: 10.1038/ng.3448. - DOI - PMC - PubMed
    1. Visscher, P. M. et al. 10 Years of GWAS Discovery: Biology, Function, and Translation. American Journal of Human Genetics. 10.1016/j.ajhg.2017.06.005 (2017). - PMC - PubMed
    1. Cookson W, Liang L, Abecasis G, Moffatt M, Lathrop M. Mapping complex disease traits with global gene expression. Nat. Rev. Genet. 2009;10:184–94. doi: 10.1038/nrg2537. - DOI - PMC - PubMed
    1. Strunz T, et al. A mega-analysis of expression quantitative trait loci (eQTL) provides insight into the regulatory architecture of gene expression variation in liver. Sci. Rep. 2018;8:5865. doi: 10.1038/s41598-018-24219-z. - DOI - PMC - PubMed

Publication types

MeSH terms