. 2020 Jan 31;3(1):51.
doi: 10.1038/s42003-020-0775-x.

Trypanosomatid parasite dynamically changes the transcriptome during infection and modifies honey bee physiology

Affiliations

Trypanosomatid parasite dynamically changes the transcriptome during infection and modifies honey bee physiology

Qiushi Liu et al. Commun Biol. .

Abstract

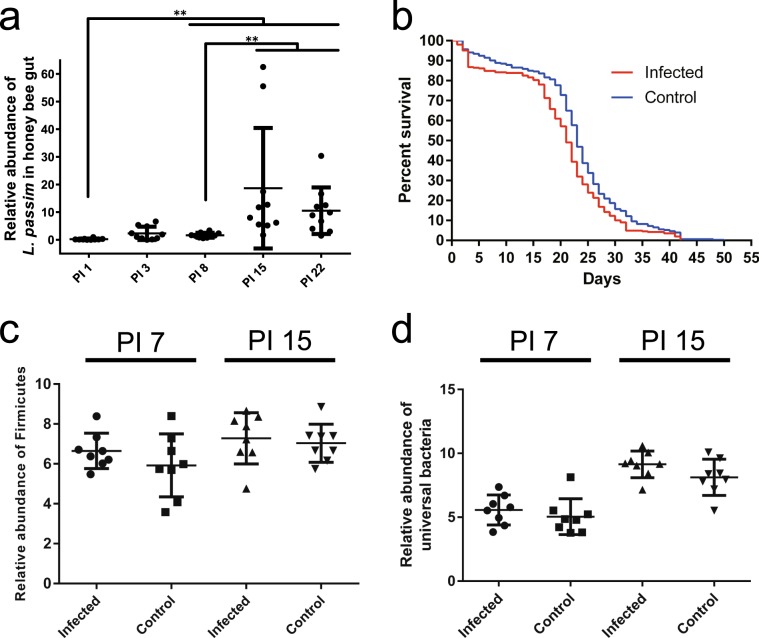
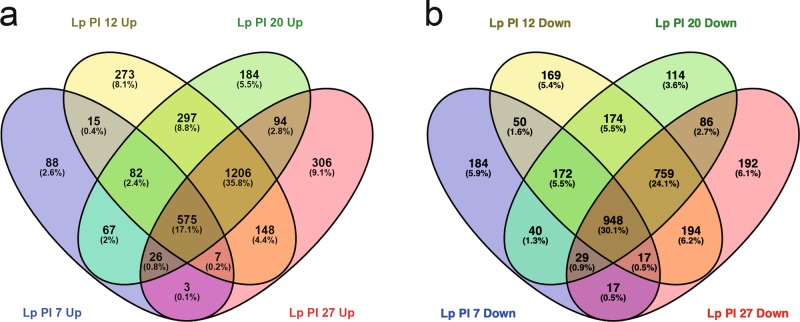
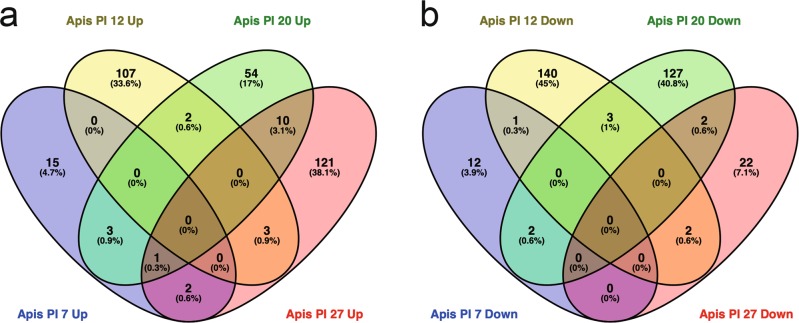
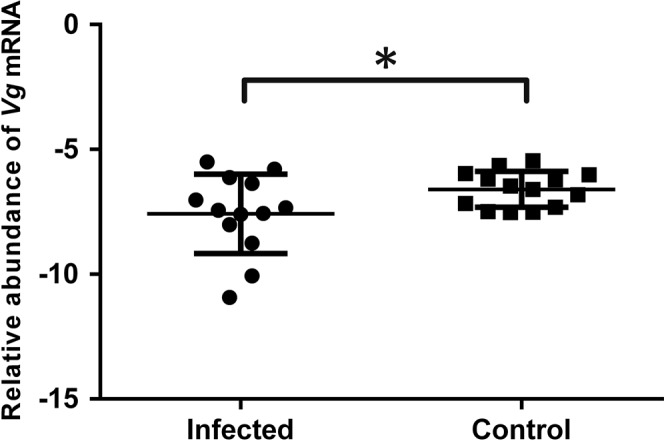
It is still not understood how honey bee parasite changes the gene expression to adapt to the host environment and how the host simultaneously responds to the parasite infection by modifying its own gene expression. To address this question, we studied a trypanosomatid, Lotmaria passim, which can be cultured in medium and inhabit the honey bee hindgut. We found that L. passim decreases mRNAs associated with protein translation, glycolysis, detoxification of radical oxygen species, and kinetoplast respiratory chain to adapt to the anaerobic and nutritionally poor honey bee hindgut during the infection. After the long term infection, the host appears to be in poor nutritional status, indicated by the increase and decrease of take-out and vitellogenin mRNAs, respectively. Simultaneous gene expression profiling of L. passim and honey bee during infection by dual RNA-seq provided insight into how both parasite and host modify their gene expressions.


Conflict of interest statement

The authors declare no competing interests.

Figures

Fig. 1
Fig. 1. The effects of L. passim infection on honey bee survival and gut microbiota.
a The abundance of L. passim in individual honey bees (n = 10) at 1, 3, 8, 15, and 22 days after the infection (PI 1–22). In order to compare the relative abundance of L. passim, one honey bee sample on day 1 was set as 1 and thus nine samples were statistically analyzed for day 1. Steel-Dwass method was used for the statistical analysis between the different time points. Mean values ± SD (error bars) are shown. **P< 0.01. b Survival of honey bees infected by L. passim at 33 °C under laboratory condition. Newly emerged honey bees (n = 96–110) were either infected by 105L. passim (Infected, red) or fed with sucrose solution (Control, blue) at day 0, and then the survival rates were recorded every day. The experiment was repeated three times and the average values are shown. The data were statistically analyzed by Log-rank (Mantel–Cox) test (P = 0.0002). Relative abundance of Firmicutes (c) and universal bacteria (d) in L. passim-infected (Infected) and the uninfected (Control) honey bees at PI 7 and PI 15 (n = 8 for each time point). Mean values ± SD (error bars) are shown. Unpaired t test (two-tailed) was used for the statistical analysis.
Fig. 2
Fig. 2. Global transcriptomic profiles of L. passim at the different time points of infection in the honey bee hindgut.
Venn diagram to indicate L. passim genes upregulated (a) or downregulated (b) at four different time points (PI 7–27) of the infection.
Fig. 3
Fig. 3. Global transcriptomic profiles of honey bee hindguts at the different time points of L. passim infection.
Venn diagram to indicate honey bee genes upregulated (a) or downregulated (b) in response to L. passim infection at four different time points (PI 7–27).
Fig. 4
Fig. 4. Relative amounts of Vg mRNA in the fat bodies of L. passim-infected and uninfected honey bees.
Relative amounts of Vg mRNA in the fat bodies of L. passim-infected (Infected, n = 13) and uninfected honey bees (Control, n = 14) were measured at 20 days after the infection under hive condition. The samples were obtained by two independent experiments. Mean values ± SD (error bars) are shown. Unpaired t test (two-tailed) was used for the statistical analysis (*P< 0.05).

References

    1. Potts SG, et al. Declines of managed honey bees and beekeepers in Europe. J. Apicultural Res. 2010;49:15–22. doi: 10.3896/IBRA.1.49.1.02. - DOI
    1. Evans JD, Schwarz RS. Bees brought to their knees: microbes affecting honey bee health. Trends Microbiol. 2011;19:614–620. doi: 10.1016/j.tim.2011.09.003. - DOI - PubMed
    1. Goulson D, Nicholls E, Botías C, Rotheray EL. Bee declines driven by combined stress from parasites, pesticides, and lack of flowers. Science. 2015;347:1255957. doi: 10.1126/science.1255957. - DOI - PubMed
    1. Stanimirović Z, et al. Looking for the causes of and solutions to the issue of honey bee colony losses. Acta Veterinaria. 2019;69:1–31. doi: 10.2478/acve-2019-0001. - DOI
    1. Doublet V, et al. Unity in defence: honeybee workers exhibit conserved molecular responses to diverse pathogens. BMC Genom. 2017;18:207. doi: 10.1186/s12864-017-3597-6. - DOI - PMC - PubMed

Publication types