Review
. 2020 Sep;77(18):3469-3502.
doi: 10.1007/s00018-020-03458-2. Epub 2020 Jan 31.

The neuroscience of sugars in taste, gut-reward, feeding circuits, and obesity

Affiliations
Review

The neuroscience of sugars in taste, gut-reward, feeding circuits, and obesity

Ranier Gutierrez et al. Cell Mol Life Sci. 2020 Sep.

Abstract

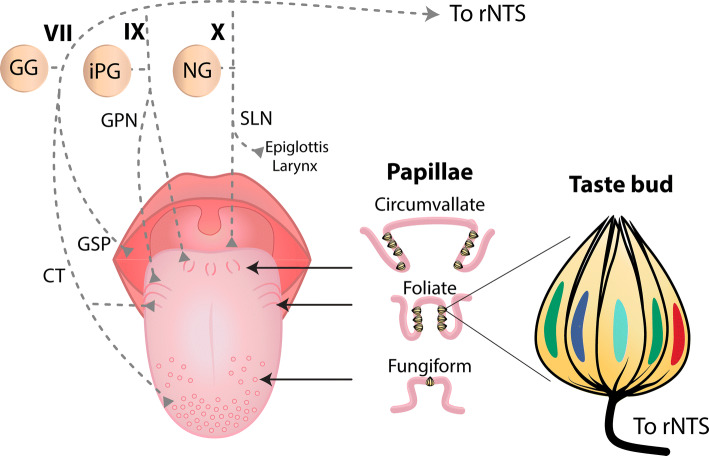
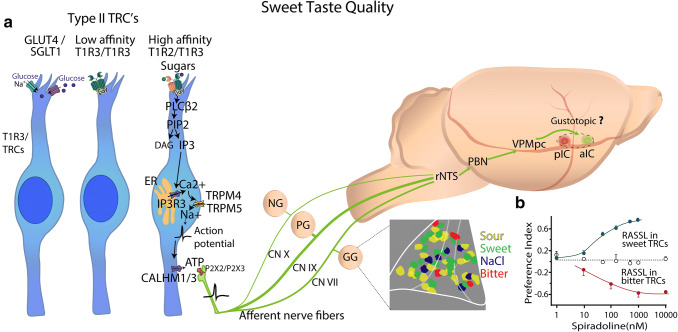
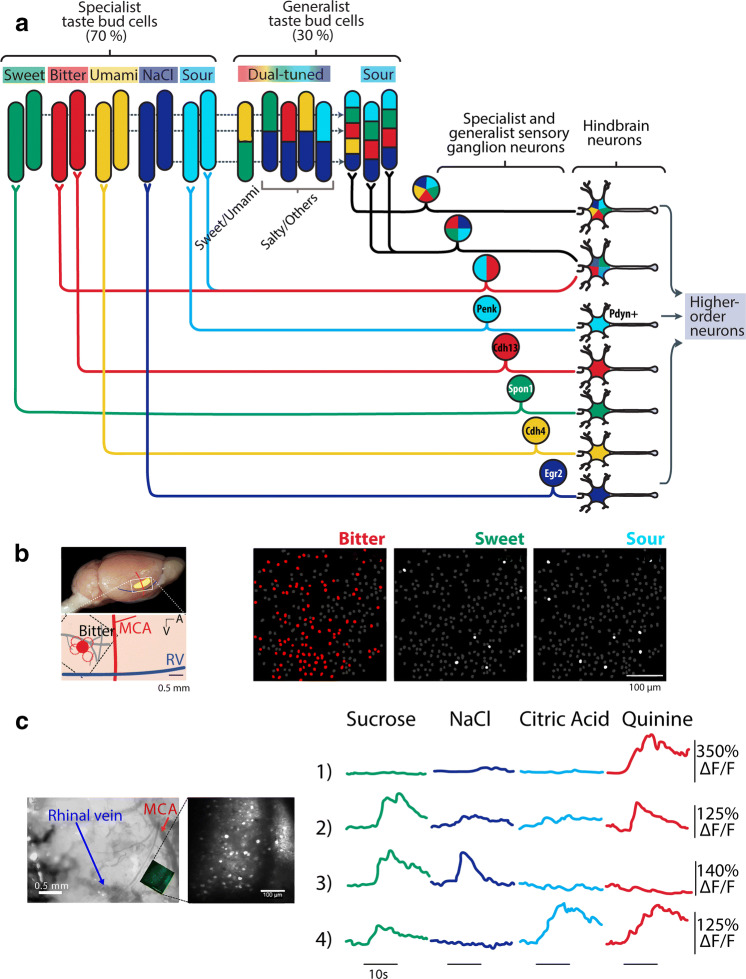
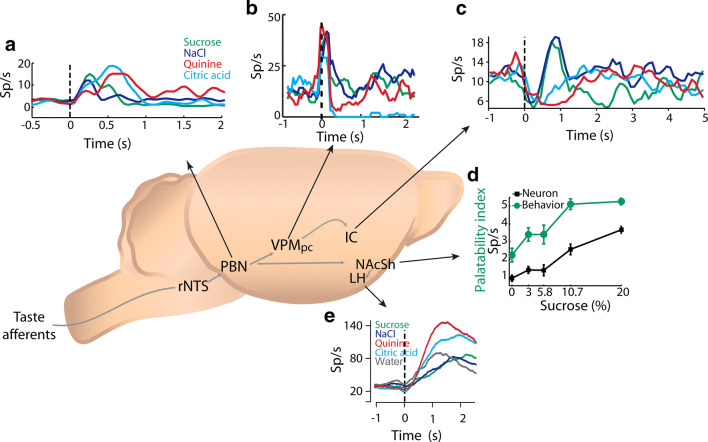
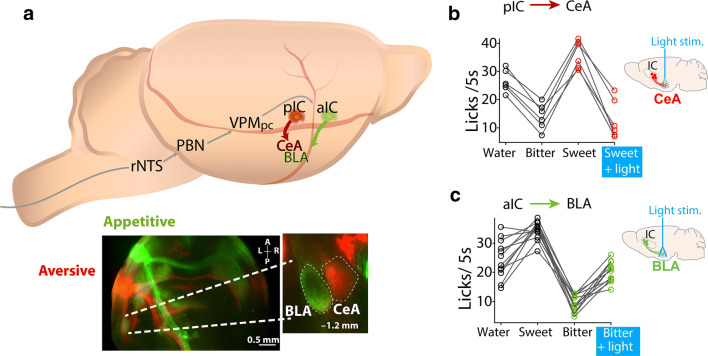
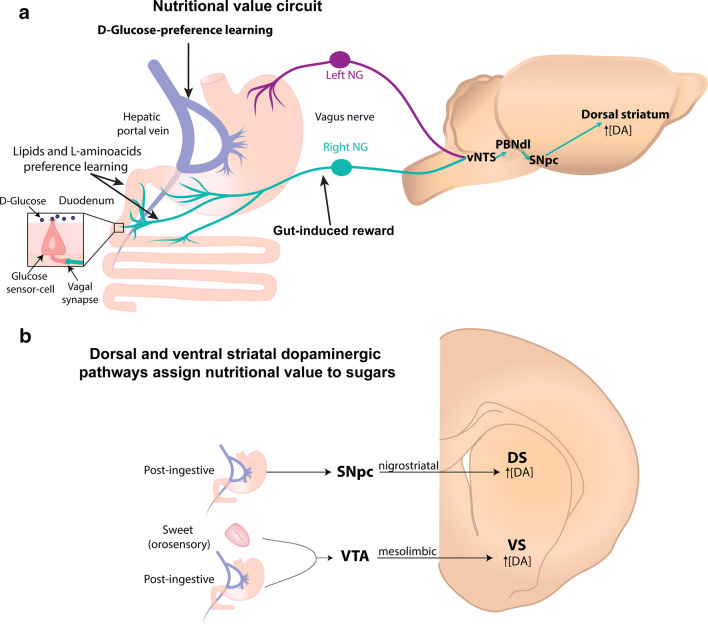
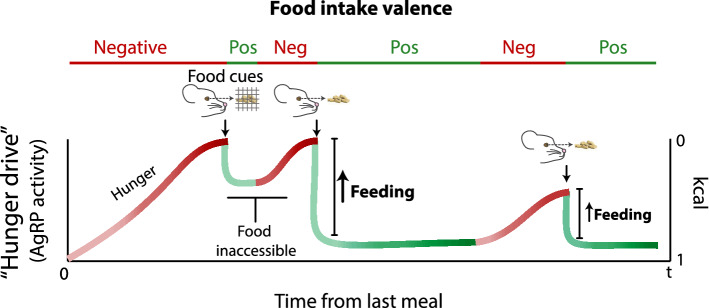
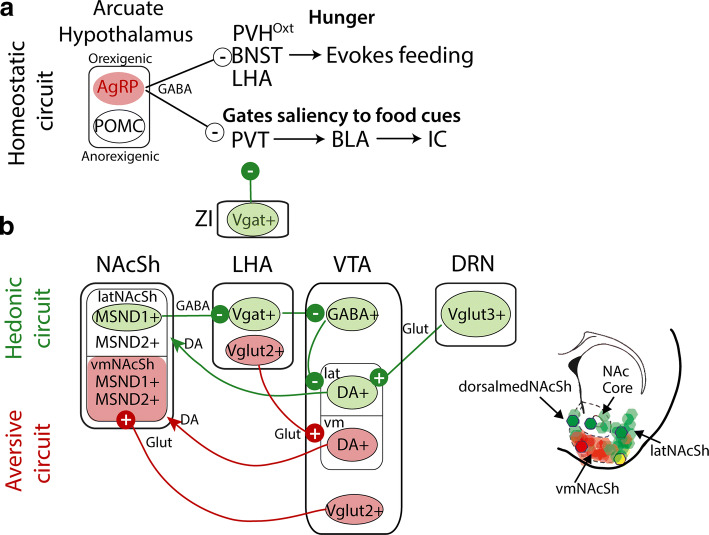
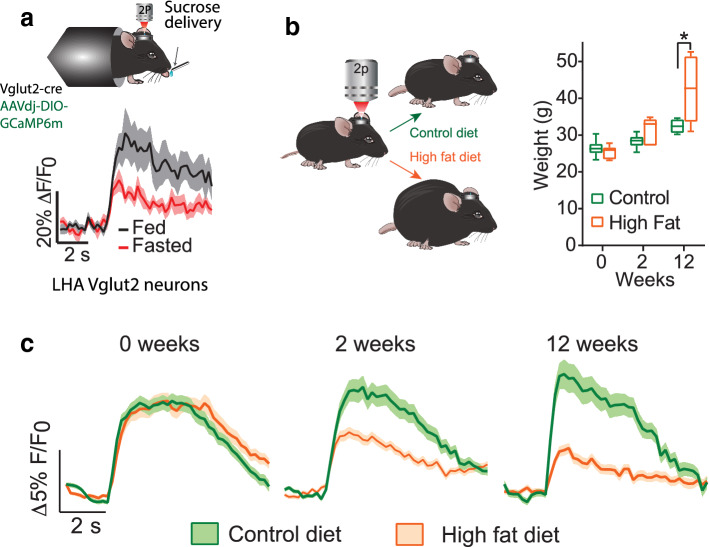
Throughout the animal kingdom sucrose is one of the most palatable and preferred tastants. From an evolutionary perspective, this is not surprising as it is a primary source of energy. However, its overconsumption can result in obesity and an associated cornucopia of maladies, including type 2 diabetes and cardiovascular disease. Here we describe three physiological levels of processing sucrose that are involved in the decision to ingest it: the tongue, gut, and brain. The first section describes the peripheral cellular and molecular mechanisms of sweet taste identification that project to higher brain centers. We argue that stimulation of the tongue with sucrose triggers the formation of three distinct pathways that convey sensory attributes about its quality, palatability, and intensity that results in a perception of sweet taste. We also discuss the coding of sucrose throughout the gustatory pathway. The second section reviews how sucrose, and other palatable foods, interact with the gut-brain axis either through the hepatoportal system and/or vagal pathways in a manner that encodes both the rewarding and of nutritional value of foods. The third section reviews the homeostatic, hedonic, and aversive brain circuits involved in the control of food intake. Finally, we discuss evidence that overconsumption of sugars (or high fat diets) blunts taste perception, the post-ingestive nutritional reward value, and the circuits that control feeding in a manner that can lead to the development of obesity.

Keywords: AgRP; Gut-reward; Hedonic taste value; LHA GABA neurons; Nutritional value; Obesity; Sugars; Sweetness.


Figures

Fig. 1
Fig. 1
Chemical structures of selected sweet tastants and lactisole, a human sweet taste inhibitor. Molecular structures of some monosaccharides (fructose and glucose), the disaccharide sucrose, sugar alcohols (xylitol, erythritol), the aminoacid d-tryptophan, non-caloric sweet tastants (acesulfame, aspartame, neotame, cyclamate, saccharin, and sucralose), proteins (monellin and brazzein) and a sweet taste inhibitor (lactisole). Monellin and brazzein Adapted from [270]
Fig. 2
Fig. 2
A figure of the structure of the human sweet taste receptor hT1R2/T1R3 showing the presence of multiple binding sites. The heterodimer hT1R2 (red) + hT1R3 (green) is primarily constituted by an extracellular Amino Terminal Domain (ATD) which is composed of a Venus Flytrap Domain (VFD) and a Cysteine-Rich Domain (CRD). The VFD consists of two lobes that change their conformation to “open” or “closed,” resembling that of the carnivorous plant. It is linked via the CRD to the seven helical Transmembrane Domain (TMD). Sweet tastants exert their effects by binding to different sites of the receptor (arrows) that result in conformational changes eliciting downstream signaling cascades as shown in Fig. 4. Figure with permission from [39]
Fig. 3
Fig. 3
Human tongue, taste papillae, and their afferent nerve fibers. Dorsal surface of a human tongue showing the location of the three types of papillae containing taste buds and their associated afferent nerves. In fungiform papillae, taste buds are on the anterior surface, while in foliate and circumvallate papillae they are in trenches on the side and posterior areas of the tongue, respectively (middle panel). Note that the chorda tympani (CT) nerve, a branch of CN VII, innervates both the fungiform papillae and the anterior part of foliate papillae, whereas the posterior part of foliate papillae and the circumvallate papillae are innervated by a sensory branch of CN IX, the glossopharyngeal nerve (GPN). The soft palate is innervated by the greater superficial petrosal (GSP) branch of CN VII, while the root of the tongue, epiglottis, and larynx are innervated by the superior laryngeal (SLN) branch of the vagus nerve (CN X). At right panel shows a longitudinal section of a taste bud showing five different taste receptor cells. GG geniculate ganglion, PG inferior petrosal ganglion, NG nodose ganglion, rNTS rostral portion of the Nucleus Tractus Solitarius
Fig. 4
Fig. 4
Sweet taste transduction and taste pathway into the rodent brain. a Sweet tastants are detected in Type II taste receptor cells (TRCs) by high and low affinity T1R2/T1R3 heterodimers (Fig. 2), a glucose receptor 4 (GLUT4), and a Sodium-Glucose Linked Transporter 1 (SGLT1). The TRC on the right depicts the signaling cascade originated by the binding of sweet tastants [i.e., glucose (purple) and sucrose (green)] which promotes intracellular calcium increases via a PIP2 cascade that binds to IP3R3 receptors in the endoplasmic reticulum (ER) that opens the sodium-selective cation channels TRPM4 and TRPM5, eliciting depolarization and action potentials. Membrane voltage depolarization promotes fast extracellular release of ATP through the hetero-hexameric calcium homeostasis modulator 1/3 (CALHM1/3) ion channel. ATP activates P2X2/P2X3 purinergic receptors that are localized in the afferents of the facial (CN VII) and glossopharyngeal (CN IX) nerves. In addition, vagal (CN X) cranial nerves innervate epiglottis and esophagus. Taste information travels through the Geniculate, Petrosal, and Nodose Ganglia (GG and PG, and NG, respectively) to higher brain centers. The first central relay of gustatory processing is the rostral portion of the Nucleus Tractus Solitarius (rNTS). Then, in rodents (but not humans) information is carried to the Parabrachial Nucleus (PBN) followed by input to the parvocellular portion of the Ventroposteromedial (VPMpc) thalamus until it reaches the primary gustatory or Insular Cortex (IC). In rodents, within the IC (dashed circle) is suggested to display a gustotopic organization with bitter-posterior (pIC red) and sweet-anterior (aIC green) areas [81] relative to the medial cerebral artery, and dorsal to the rhinal vein. See text for additional discussion about this controversial point. The inset in the GG depicts that the topographic organization, or proposed hotspots, for taste qualities, are not seen at the level of the GG. Heterogenic distribution of sour (yellow), sweet (magenta), salty (green), and bitter (blue) taste-preferred cells in the GG. The white lines delineated the GG. b Consumption preference index, defined as spiradoline intake divided by spiradoline + water intake, as a function of spiradoline concentration (a tasteless κ opioid agonist) in mice expressing receptor activated solely by a synthetic ligand (RASSL) in sweet (green) and bitter (red) taste receptor cells (TRCs). When RASSL is expressed in sweet and bitter TRCs, mice are strongly attracted and repelled, respectively, to drink a spiradoline solution, implying a peripheral labeled-line coding scheme. White circles are control mice with no expression of RASSL receptors. Reprinted with permission from [8] and [71]
Fig. 5
Fig. 5
Taste coding in specialist and generalist taste cells, associated primary neurons, and in the mouse insular cortex. a Responses of five primary tastants at different levels of the taste system that goes from TRCs to higher-order neurons (sweet—green, NaCl—dark blue, citric acid—cyan, and quinine—red). Shown are mention some ‘specialist’ cells that exhibit selective responses to one taste quality, and ‘generalist’ cells that respond to more than one tastant. For simplicity, not all connections are drawn. The gene marker for geniculate ganglion neurons selective to each taste quality is proenkephalin (Penk), Cadherin 4 (Cdh4) and 13 (Cdh13), Spondin-1 (Spon-1) and Early Growth Response 2 (Egr2). The sour sensitive neurons in the rNTS are marked by the Pdyn (prodynorphin) gen. Modified from [15]. b The dorsal portion of the mouse IC, which is above the rhinal vein (RV), is subdivided into posterior (pIC) and anterior (aIC) relative to the medial cerebral artery (MCA). The extent of IC is depicted in yellow. A hotspot for bitter tastants was reported to be in the pIC (see red dot). Right panels, two-photon calcium imaging of bitter-hotspot” identified in the pIC. In this report on this area of the mouse cortex most IC neurons preferentially responded to bitter (red), in comparison to other sapid stimuli. Reused from [81]. c In contrast, another calcium imaging study in the mouse pIC (see inset of recording window), revealed that calcium transient responses of pIC neurons were broadly tuned to tastants, sweet (sucrose, green), salty (NaCl, dark blue), sour (citric acid, cyan), and bitter (quinine, red). In this study a bitter hotspot was not found. Each row shows a neuron, note that neurons 2 and 4 responded to both sweet and bitter tastants. Reused with permission from [91]
Fig. 6
Fig. 6
Palatability is encoded in a widespread brain network. a Example of the response of a Parabrachial Nucleus (PBN) neuron that exhibited larger firing rates in response to aversive tastants [citric acid (light blue) and quinine (red)] than to appetitive stimuli [sucrose (green) and sodium chloride (dark blue)]. From [108]. b Mean PSTHs of a representative palatability-related thalamic neuron with higher firing rates (from 0.2 to 1 s) in response to hedonically positive stimuli (sucrose and NaCl)), and lower activity in response to aversive stimuli (Quinine and citric acid). Same conventions as in a. From [84]. Notably, as seen in a and b, throughout the gustatory axis there are both aversive- and hedonic-selective cells that display higher responses to unpleasant or to palatable tastants, respectively. c. Example of a hedonic-selective IC neuron with greater activity in response to sucrose and NaCl (from 0.2 to 1 s) in comparison to aversive stimuli. Same conventions as in a. From [109]. d An example of a Nucleus Accumbens Shell (NAcSh) neuron whose mean firing rate increases as a function of sucrose concentration, shown in black, and that covaries with the palatability behavioral index (green). The palatability index is the lick rate during a 5 s reward epoch where sucrose was available to the animal to consume. From [67]. e Example of a Lateral Hypothalamic Area (LHA) aversive-selective cell with increasing activity from positive (water, NaCl, and sucrose) to negative (citric acid and quinine) valence sapid stimuli. Same conventions as in a, water is depicted in gray. With permission from [111]
Fig. 7
Fig. 7
Optogenetic manipulation of IC projections to the amygdala can reverse innate palatability responses. a Schematic of the rat’s brain taste pathway from the rNTS to the posterior pIC and anterior aIC, and then to two different amygdalar nuclei (Central Amygdala (CeA) and Basolateral Amygdala (BLA)). Below, a horizontal brain slice showing distinct projections from the anterior IC/“appetitive” (green) and posterior IC/“aversive” (red) “hotspots” to the BLA and the CeA, respectively. b The consumption of a sweet tastant solution is decreased when paired with optogenetic stimulation of the “aversive” pIC to CeA projections (see sketch of brain on the right side) in comparison to sweet solution alone, which is more preferred than water or a bitter solution. It is plotting the number of licks given in 5 s during a brief access test task. c. Consumption of a bitter-tasting stimulus increases when paired with photostimulation of the “appetitive” aIC to BLA projections (see right-side of the brain) in comparison to the bitter solution alone which is less preferred than water or a sweet solution. With permission from [113]. Thus, activation of these projections can assign a new-opposite valence to tastants
Fig. 8
Fig. 8
The concentration-dependent and intensity responses to sucrose are found throughout the rat gustatory pathway. a When sucrose is applied to the tongue, calcium imaging measurements from the mouse geniculate ganglion (GG) showed sucrose concentration-dependent increases. From [74]. b Mean response from rat rNTS cells that track sucrose intensity by increasing (upper) or decreasing (lower) firing rates. From [82]. c PBN neurons with increased activity as a function of sucrose intensity (in [moles]). From [120]. d Mean activity of pIC cells that tracks sucrose’s intensity either by monotonically increasing (red) or decreasing (blue) firing rates. ef Same conventions as in d for aIC, and OFC, respectively. g Mean firing rate of aIC neurons that covaries their activity with the subjective judgment of “how sweet” that a subject perceived a sucrose concentration. h Same conventions as in g but for OFC neurons. Note that activity of figures af shows the encoding of the sensory/physical dimension of the stimuli (whether intensity increased), while activity in figures g and h shows the encoding of the perceptual/psychological dimension. That is, it shows how the intensity was perceived and classified in an active self-reporting generalization task. With permission from [94]
Fig. 9
Fig. 9
Gut-induced reward pathway. a Left panel: The right (cyan) and left (purple) Nodose Ganglia (NG) of the vagus nerve differentially innervates the digestive system. The left NG projects from the stomach’s fundus (see upper left side), while the right NG projects from the pyloric antrum and small intestine (lower left side). Both synapse in the ventral NTS (vNTS). The gut-induced reward information is produced exclusively by activation of the right vagal nerve and reaches the vNTS, the dorsolateral portion of the PBN (PBNdl). Subsequently, the SNpc, which activity increases dorsostriatal dopamine (DA) efflux. Preference learning for lipids and l-aminoacids requires vagal terminals and sensing in the duodenum. In contrast, glucose-preference learning is mediated by a vagal-independent and taste-independent pathway via a post-absorptive mechanism in the hepatic portal vein. b Mesolimbic (orosensory) and nigrostriatal (post-ingestive) dopamine pathways assign nutritional value to sugars. Schematics of the two separate dopaminergic pathways involved in the nutritional value of d-glucose. Note that the mesolimbic pathways require sweet taste activation to induced learned preference to d-glucose. In contrast, the nigrostriatal pathway is more dedicated to sense and detect energetic foods in the gut. SNpc substantia nigra pars compacta, VTA ventral tegmental area, DS dorsal striatum, and VS ventral striatum
Fig. 10
Fig. 10
Model of how ARCAgRP neurons control feeding behavior and track the number of calories ingested. The population activity of ARCAgRP neurons encodes a “hunger drive” that is released by food cues (see text for details). The population AgRP neuronal activity is plotted vs. time from the last meal, when AgRP neuron activity increases (the “hunger drive” also increases; see red lines). The valence of food is assigned according to whether the food can inhibit (positive, see green colors) -or not- AgRP neuron activity (negative, red colors show when food is inaccessible). Presentation of food that can be seen and smelled but not consumed (food inaccessible) inhibited ARCAgRP neuron activity that is reversed within minutes. However, when a food cue is followed by intake of a caloric meal, a sustained inhibition is observed [220, 226]. The magnitude of the transition from high to low ARCAgRP neuron activity drives feeding in the same proportion [221] and encodes the number of calories ingested [219, 220]. Thus, caloric food intake resets the “hunger drive”. Note that the kcal axis on the right increases in a downward direction
Fig. 11
Fig. 11
Schematic diagrams of the neuronal homeostatic, hedonic, and aversive feeding circuits in the brain. a Homeostatic pathway: The Arcuate nucleus of the hypothalamus (Arc) has both orexigenic (Agouti-related peptide, AgRP, in red) and an anorexigenic population (Proopiomelanocortin, POMC). ARCAgRP neurons are GABAergic and promote food intake by inducing a sensation of hunger or by increasing the attractiveness of food-predicting. Hunger is evoked via the inhibition (negative arrow) of the oxytocin-expressing cells in the hypothalamic Paraventricular nucleus (PVHOxt), Bed Nucleus Stria Terminalis (BNST), and Lateral Hypothalamic Area (LHA). ARCAgRP neurons also encode the food’s saliency due to Insular Cortex (IC) activation via the Paraventricular Thalamus (PVT) and Basolateral Amygdala (BLA), respectively. b In the NAcSh, the hedonic circuit (green) induces feeding via GABAergic inhibitory projections (negative arrow) from the Medium Spiny Neurons expressing D1 receptors (MSND1+) in the lateral Nucleus Accumbens Shell (latNAcSh) to the GABA+ cells of the LHAVgat+. LHAVgat+ inhibits VTAGABA+ interneurons, thus disinhibiting lateral Ventral Tegmental Area dopaminergic neurons (latVTADA+) which, in turn, are excited by the reward signal of neurons expressing the Vesicular glutamate transporter type-3 (Vglut3) from the Dorsal Raphe Nucleus (DRN). The aversive circuit (red) involves activation (positive arrow) of the NAcSh from the VTAVglut2+, and positive modulatory projections (arrowheads) to the ventromedial nucleus accumbens shell (vmNAcShMSN+) from the vmVTADA+, which, in turn, are activated by LHAVglut2+. Thus, the NAcSh displays a lateral-ventromedial gradient encoding rewarding (green)-aversive (red) stimuli (see right panel, from [216]). The GABA neurons in the Zona Incerta (ZIVgat+) project and inhibit glutamatergic PVT neurons inducing rapid binge-like eating for high fat and sugar foods
Fig. 12
Fig. 12
High-fat diets progressively attenuate a neural satiety “stop-feeding” signal. a VGlut2-cre mice were injected with the calcium indicator, GCaMP6m, to measure neuronal activity via in vivo two-photon calcium imaging, while the mice consumed a 10% sucrose solution. Figure showing two-photon imaging setup and control (healthy) mouse feeding (licking for sucrose) together with a representative example of a response from an LHAVglut2+ neuron that displayed a diminished activity in response to sucrose consumption when the same mouse had fasted for 24 h (red) in comparison when it had ad libitum access to food (Fed, black). b Preparation of study in Vglut2-cre mice regarding how obesity affects LHAVglut2+ responses. Mice fed for 12 weeks with a high-fat diet (orange) gained significantly more weight in comparison to lean control (green). c LHAVglut2+ population responses to sucrose during the development of obesity. Note that as obese subjects (orange) gained weight, the response of LHAVglut2+ neurons to sucrose consumption was attenuated in comparison to lean control (green) showing that obesity dampens the “brake on satiety” feeding signal. From [217]

References

    1. Breslin PAS. An evolutionary perspective on food and human taste. Curr Biol. 2013;23:R409–R418. doi: 10.1016/j.cub.2013.04.010. - DOI - PMC - PubMed
    1. Gutierrez R, Simon SA. Why do people living in hot climates like their food spicy? Temp Multidiscip Biomed J. 2015;3:48–49. doi: 10.1080/23328940.2015.1119616. - DOI - PMC - PubMed
    1. Simon SA, de Araujo IE, Gutierrez R, Nicolelis MAL. The neural mechanisms of gustation: a distributed processing code. Nat Rev Neurosci. 2006;7:890. doi: 10.1038/nrn2006. - DOI - PubMed
    1. Glendinning JI, Stano S, Holter M, et al. Sugar-induced cephalic-phase insulin release is mediated by a T1r2 + T1r3-independent taste transduction pathway in mice. Am J Physiol Regul Integr Comp Physiol. 2015;309:R552–R560. doi: 10.1152/ajpregu.00056.2015. - DOI - PMC - PubMed
    1. Belloir C, Neiers F, Briand L. Sweeteners and sweetness enhancers. Curr Opin Clin Nutr Metab Care. 2017;20:279–285. doi: 10.1097/MCO.0000000000000377. - DOI - PubMed