. 2020 Apr 15:210:116589.
doi: 10.1016/j.neuroimage.2020.116589. Epub 2020 Jan 30.

Damage to the shortest structural paths between brain regions is associated with disruptions of resting-state functional connectivity after stroke

Affiliations

Damage to the shortest structural paths between brain regions is associated with disruptions of resting-state functional connectivity after stroke

Joseph C Griffis et al. Neuroimage. .

Abstract

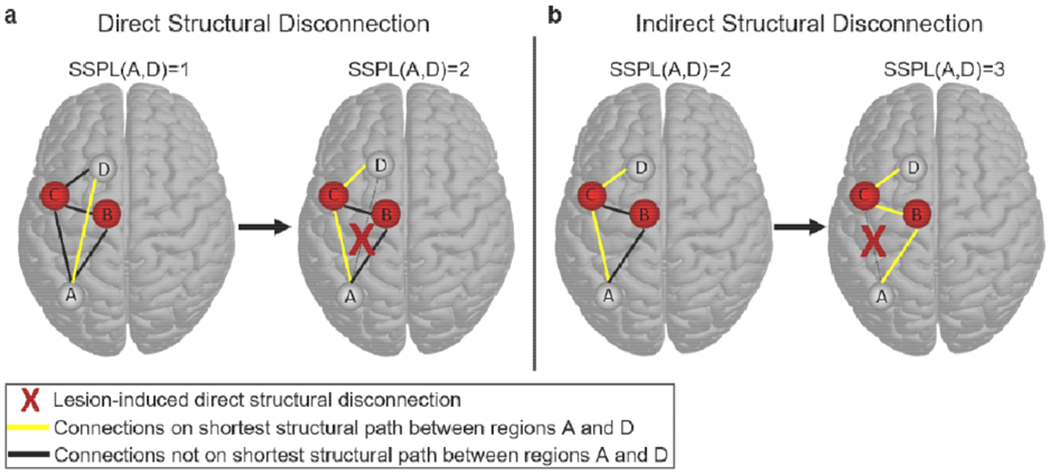
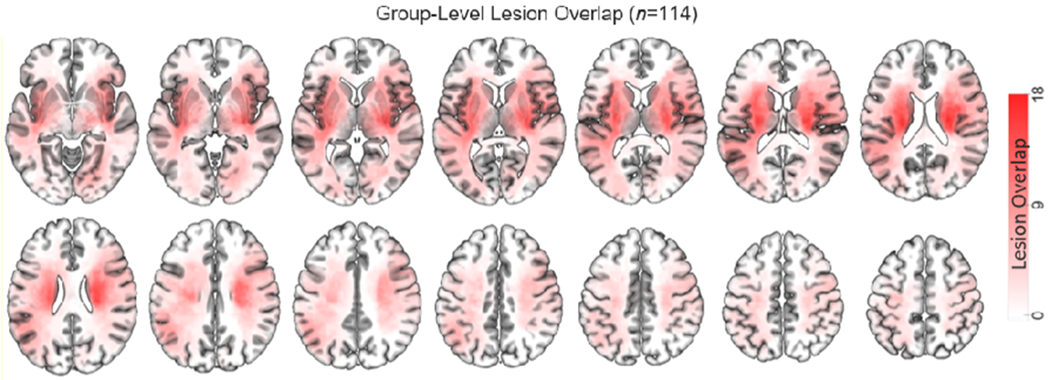
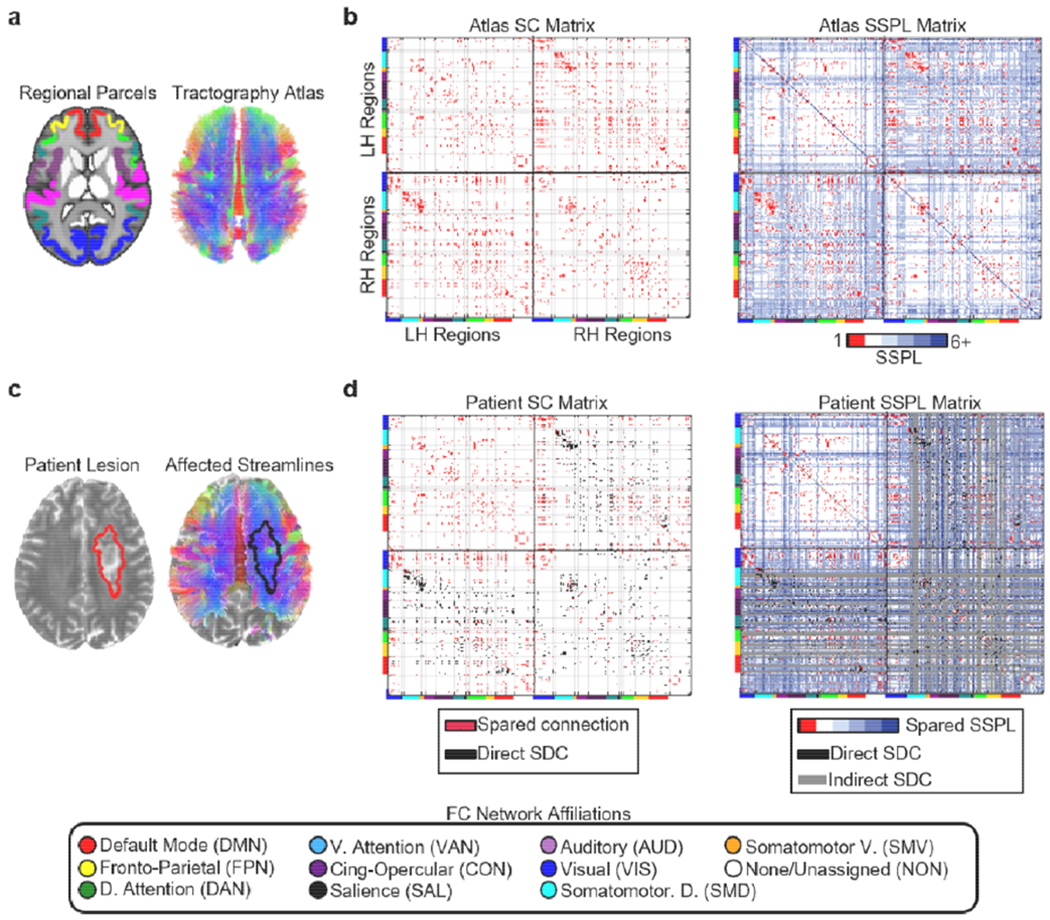
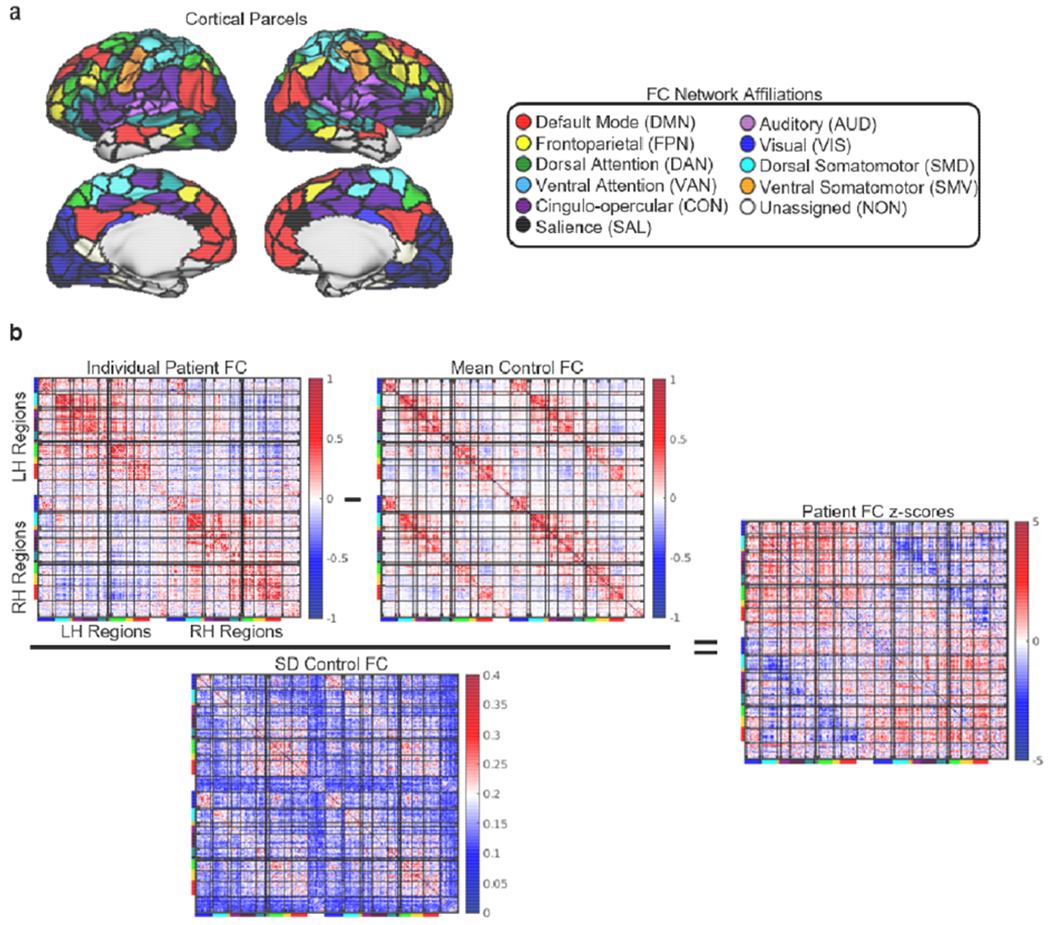
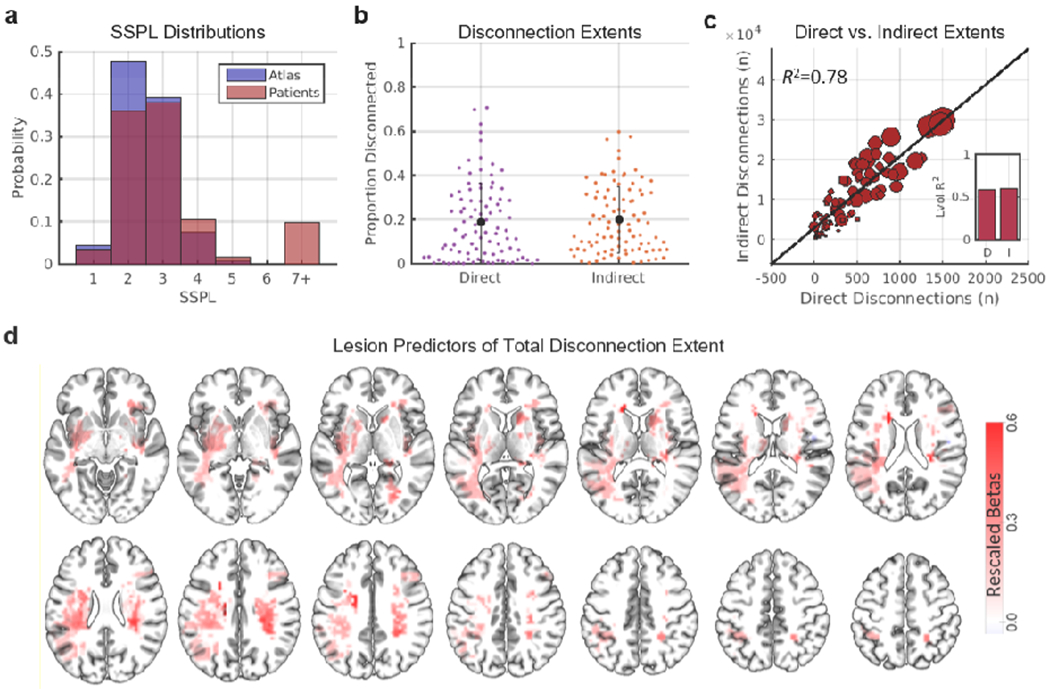
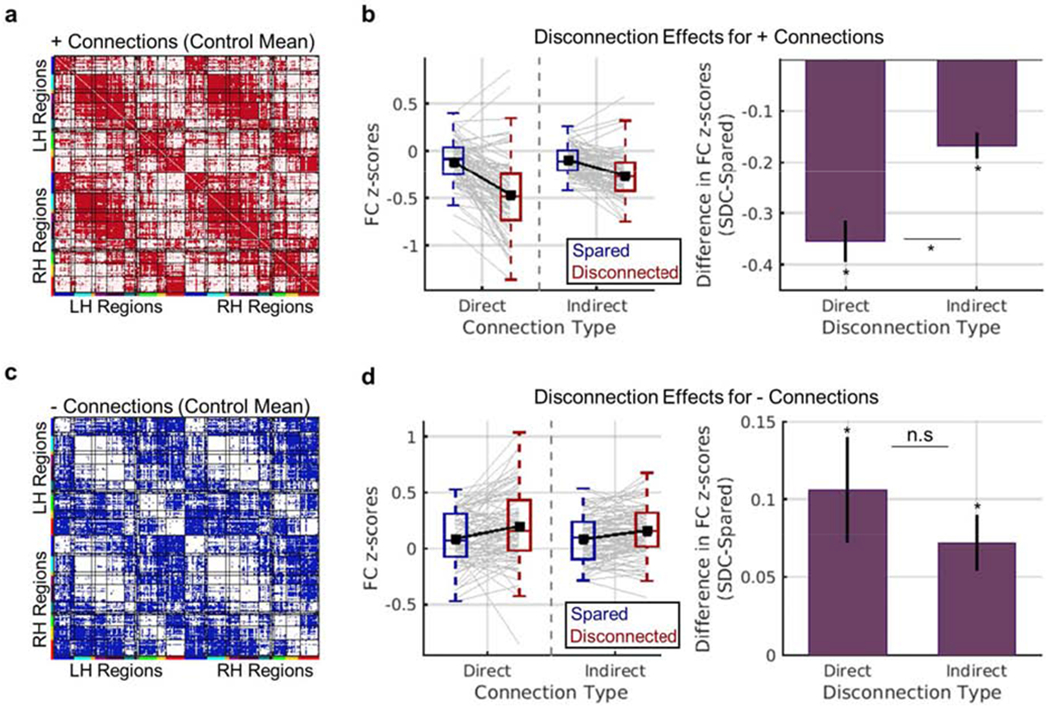
Focal brain lesions disrupt resting-state functional connectivity, but the underlying structural mechanisms are unclear. Here, we examined the direct and indirect effects of structural disconnections on resting-state functional connectivity in a large sample of sub-acute stroke patients with heterogeneous brain lesions. We estimated the impact of each patient's lesion on the structural connectome by embedding the lesion in a diffusion MRI streamline tractography atlas constructed using data from healthy individuals. We defined direct disconnections as the loss of direct structural connections between two regions, and indirect disconnections as increases in the shortest structural path length between two regions that lack direct structural connections. We then tested the hypothesis that functional connectivity disruptions would be more severe for disconnected regions than for regions with spared connections. On average, nearly 20% of all region pairs were estimated to be either directly or indirectly disconnected by the lesions in our sample, and extensive disconnections were associated primarily with damage to deep white matter locations. Importantly, both directly and indirectly disconnected region pairs showed more severe functional connectivity disruptions than region pairs with spared direct and indirect connections, respectively, although functional connectivity disruptions tended to be most severe between region pairs that sustained direct structural disconnections. Together, these results emphasize the widespread impacts of focal brain lesions on the structural connectome and show that these impacts are reflected by disruptions of the functional connectome. Further, they indicate that in addition to direct structural disconnections, lesion-induced increases in the structural shortest path lengths between indirectly structurally connected region pairs provide information about the remote functional disruptions caused by focal brain lesions.

Keywords: Functional connectivity; Lesion; Shortest path length; Stroke; Structural connectivity; Structural disconnection.


Conflict of interest statement

Declaration of competing interests The authors do not declare any competing interests.

Figures

Fig. 1.
Fig. 1.
Defining direct and indirect structural disconnections. (a) The brain on the left shows a simple network where regions A and D are directly structurally connected to each other (yellow line), and therefore have an SSPL equal to 1. The brain on the right shows the SSPL (yellow line) between regions A and D after the direct structural connection has been disrupted by a lesion (red X): the SSPL between regions A and D is now 2 because the shortest path passes through region C. This is an example of how direct structural disconnections increase SSPLs between disconnected regions. (b) The brain on the left shows an alternative network configuration where regions A and D are indirectly structurally connected to each other via mutual connections to region C (yellow line), and therefore have an SSPL equal to 2. The brain on the right shows the SSPL (yellow line) between regions A and D after the structural connection between regions A and C has been disrupted by a lesion (red X): the SSPL between regions A and D is now 3 because the shortest path passes through both regions B and C. This is an example of how a direct structural disconnection can increase SSPLs between indirectly structurally connected regions, which we refer to here as an “indirect structural disconnection”.
Fig. 2.
Fig. 2.
Group-level lesion topography. Color intensities indicate the number of patients with overlapping lesions at each voxel in the brain (max=18).
Fig. 3.
Fig. 3.
Structural disconnection data. (a) The regional parcels and tractography atlas. (b) Left – Cortical SC matrix derived from the tractography atlas and regional parcels. Right – Cortical SSPL matrix derived from the atlas SC matrix. Atlas SSPL values are integers ranging from 1 to 6. Directly structurally connected regions have SSPLs equal to 1. Cortical regions are organized by hemisphere within each matrix, and the horizontal and vertical black lines on each matrix divide the matrix into quadrants corresponding to intra-LH connections (upper left quadrant), interhemispheric connections (bottom left and upper right quadrants), and intra-RH connections (lower right quadrant). Cortical regions are further organized according to their a priori resting-state network assignments from cortical parcellation as indicated by the colored bars along the edges of each matrix and the legend at the bottom of the figure. The light grey lines extending from the tick marks between these colored bars form “boxes” delineating portions of each matrix corresponding to different sets of within-network (i.e. on-diagonal “boxes” within each quadrant) and between-network (i.e. off-diagonal “boxes” within each quadrant) connections. (c) Lesion segmentation (left) and affected streamlines (right) for a single patient overlaid on that patient’s T2-weighted scan. (d) Left -- spared cortical direct structural connections (red) and direct cortical structural disconnections (black – direct SDC) for the patient shown in (c). Right – spared cortical SSPLs (colored), indirect cortical structural disconnections (gray – indirect SDC), and direct cortical structural disconnections (black– direct SDC) are shown for the same patient shown in (c). Patient SSPLs values are integers ranging from 1 to 6+ (max=infinity, where infinity indicates that no shortest paths exist). The upper left quadrants in the matrices shown in (d) correspond to connections within the contralesional hemisphere, which were spared by the right hemisphere lesion. Note: SSPL calculations also considered cortico-subcortical connections, but these connections are not shown in the matrices above. All brain images are shown in neurological convention (i.e. the left side of the brain is on the left).
Fig. 4.
Fig. 4.
Functional connectivity disruptions. (a) Cortical regions are shown on the cortical surface and are color-coded by network assignment. (b) The transformation of a raw functional connectivity matrix to a functional connectivity z-score matrix is illustrated for the same patient shown in Fig. 3c–d. The bars on matrix axes correspond to the cortical functional connectivity network assignments shown in the legend at the top of the figure.
Fig. 5.
Fig. 5.
Focal brain lesions disrupt the structural connectome. (a) The red histogram shows the distribution of SSPLs in the atlas-derived structural connectome. The blue histogram shows the distribution of SSPLs in patients. Short SSPLs are decreased and long SSPLs are increased in patients relative to the atlas-derived structural connectome. (b) Distributions and means/standard deviations are shown for the proportion of disconnected direct and indirect cortico-cortical structural connections in the subset of patients that sustained at least one direct cortico-cortical disconnection (n=92). (c) The scatterplot shows the relationship between the total number of direct disconnections (x-axis) and the total number of indirect disconnections (y-axis) in patients. Dots correspond to individual patients, and dot sizes are proportional to lesion volumes. The inset plot shows the amount of variance in direct (D) and indirect (I) disconnection extents explained by lesion volume. (d) Voxels where damage significantly (FWEp<0.05) predicted the total disconnection extent in a multivariate PLSR lesion-mapping analysis with direct total lesion volume control (dTLVC). Color intensities correspond to re-scaled (proportional to the maximum value) regression weight magnitudes for voxels that predicted greater total disconnection extents. See also Fig. S1.
Fig. 6.
Fig. 6.
Effects of direct and indirect disconnection on functional connectivity. (a-b) Results for positive functional connections. (a) The matrix shows positive functional connections from the mean control functional connectivity matrix in red. The analyses shown in (b) were restricted to these connections. (b) Left – Distributions of mean patient-level functional connectivity z-scores (y-axis) for each connection status (blue vs. red boxplots) and connection type (x-axis). Grey line plots correspond to individual patient observations, and black line plots show group-level means. Right – Data are summarized to show group-level mean (+/− SEM) differences in functional connectivity z-scores (y-axis) between regions with disconnected vs. spared direct and indirect connections (x-axis). (c-d) Results for negative functional connections. (c) The matrix shows negative functional connections from the mean control functional connectivity matrix in blue. The analyses shown in (d) were restricted to these connections. (d) Same as (b), but for negative functional connections. *dependent samples t-test FWEp<0.004. See also Figs. S3–S4.

Similar articles

Cited by

References

    1. Abdi H, 2010a. Partial least squares regression and projection on latent structure regression (PLS Regression). Wiley Interdiscip. Rev. Comput. Stat. 2, 97–106. 10.1002/wics.51 - DOI
    1. Abdi H, 2010b. The greenhouse-geisser correction. Encycl. Res. Des. Sage Publ. 1–10. 10.1007/BF02289823 - DOI
    1. Adachi Y, Osada T, Sporns O, 2011. Functional connectivity between anatomically unconnected areas is shaped by collective network-level effects in the macaque cortex. Cereb. cortex 1586–1592. 10.1093/cercor/bhr234 - DOI - PubMed
    1. Adhikari MH, Hacker CD, Siegel JS, Griffa A, Hagmann P, Deco G, Corbetta M, 2017. Decreased integration and information capacity in stroke measured by whole brain models of resting state activity. Brain 1068–1085. https://doi.Org/10.1093/brain/awx021 - DOI - PMC - PubMed
    1. Aickin M, Gensler H, 1996. Adjusting for multiple testing when reporting research results: The Bonferroni vs Holm methods. Am. J. Public Health 86, 726–728. https://doi.Org/10.2105/AJPH.86.5.726 - DOI - PMC - PubMed

Publication types