

Preliminary estimation of the basic reproduction number of novel coronavirus (2019-nCoV) in China, from 2019 to 2020: A data-driven analysis in the early phase of the outbreak
- PMID: 32007643
- PMCID: PMC7110798
- DOI: 10.1016/j.ijid.2020.01.050
Preliminary estimation of the basic reproduction number of novel coronavirus (2019-nCoV) in China, from 2019 to 2020: A data-driven analysis in the early phase of the outbreak
Abstract
Backgrounds: An ongoing outbreak of a novel coronavirus (2019-nCoV) pneumonia hit a major city in China, Wuhan, December 2019 and subsequently reached other provinces/regions of China and other countries. We present estimates of the basic reproduction number, R0, of 2019-nCoV in the early phase of the outbreak.
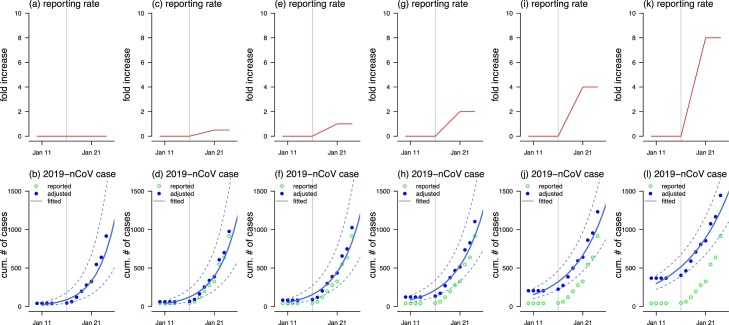
Methods: Accounting for the impact of the variations in disease reporting rate, we modelled the epidemic curve of 2019-nCoV cases time series, in mainland China from January 10 to January 24, 2020, through the exponential growth. With the estimated intrinsic growth rate (γ), we estimated R0 by using the serial intervals (SI) of two other well-known coronavirus diseases, MERS and SARS, as approximations for the true unknown SI.
Findings: The early outbreak data largely follows the exponential growth. We estimated that the mean R0 ranges from 2.24 (95%CI: 1.96-2.55) to 3.58 (95%CI: 2.89-4.39) associated with 8-fold to 2-fold increase in the reporting rate. We demonstrated that changes in reporting rate substantially affect estimates of R0.
Conclusion: The mean estimate of R0 for the 2019-nCoV ranges from 2.24 to 3.58, and is significantly larger than 1. Our findings indicate the potential of 2019-nCoV to cause outbreaks.
Keywords: Basic reproduction number; Novel coronavirus (2019-nCoV).
Copyright © 2020 The Author(s). Published by Elsevier Ltd.. All rights reserved.
Figures
Comment in
-
Comments on "Preliminary estimation of the basic reproduction number of novel Coronavirus (2019-nCoV) in China, from 2019 to 2020: A data-driven Analysis in the early phase of the outbreak".Int J Infect Dis. 2020 May;94:72-73. doi: 10.1016/j.ijid.2020.02.024. Epub 2020 Feb 20. Int J Infect Dis. 2020. PMID: 32088335 Free PMC article. No abstract available.
-
The basic reproduction number of novel coronavirus (2019-nCoV) estimation based on exponential growth in the early outbreak in China from 2019 to 2020: A reply to Dhungana.Int J Infect Dis. 2020 May;94:148-150. doi: 10.1016/j.ijid.2020.02.025. Epub 2020 Feb 20. Int J Infect Dis. 2020. PMID: 32088339 Free PMC article. No abstract available.
-
Response to Comments on "Preliminary estimation of the basic reproduction number of novel coronavirus (2019-nCoV) in China, from 2019 to 2020: a data-driven analysis in the early phase of the outbreak".Int J Infect Dis. 2022 Feb;115:70-71. doi: 10.1016/j.ijid.2021.12.310. Epub 2021 Dec 5. Int J Infect Dis. 2022. PMID: 34879227 Free PMC article. No abstract available.
References
-
- Bauch C.T., Lloyd-Smith J.O., Coffee M.P., Galvani A.P. Dynamically modeling SARS and other newly emerging respiratory illnesses: past, present, and future. Epidemiol (Cambridge, Mass) 2005;16(6):791–801. - PubMed
-
- de Silva U., Warachit J., Waicharoen S., Chittaganpitch M. A preliminary analysis of the epidemiology of influenza A (H1N1) v virus infection in Thailand from early outbreak data, June-July 2009. Eurosurveillance. 2009;14(31):19292. - PubMed
MeSH terms
LinkOut - more resources
Full Text Sources
Medical
Miscellaneous
