

Disproportionality Analysis for Pharmacovigilance Signal Detection in Small Databases or Subsets: Recommendations for Limiting False-Positive Associations
- PMID: 32008183
- PMCID: PMC7165139
- DOI: 10.1007/s40264-020-00911-w
Disproportionality Analysis for Pharmacovigilance Signal Detection in Small Databases or Subsets: Recommendations for Limiting False-Positive Associations
Abstract
Introduction: Uncovering safety signals through the collection and assessment of individual case reports remains a core pharmacovigilance activity. Despite the widespread use of disproportionality analysis in signal detection, recommendations are lacking on the minimum size of databases or subsets of databases required to yield robust results.
Objective: This study aims to investigate the relationship between database size and robustness of disproportionality analysis, with regards to limiting spurious associations.
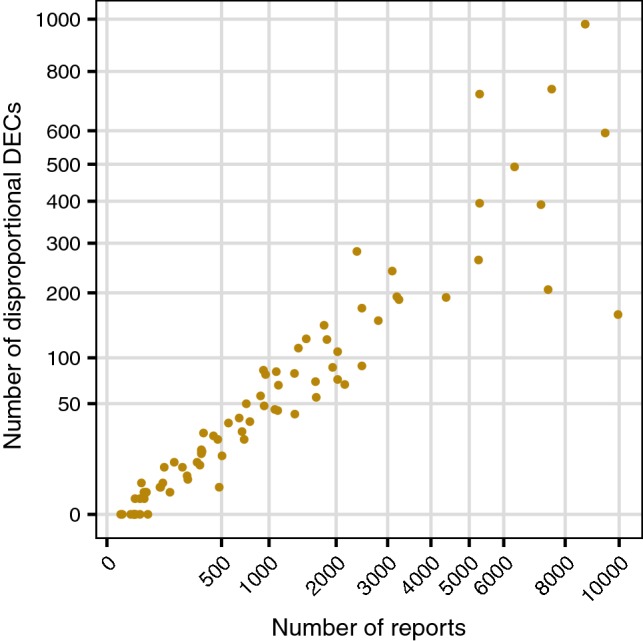
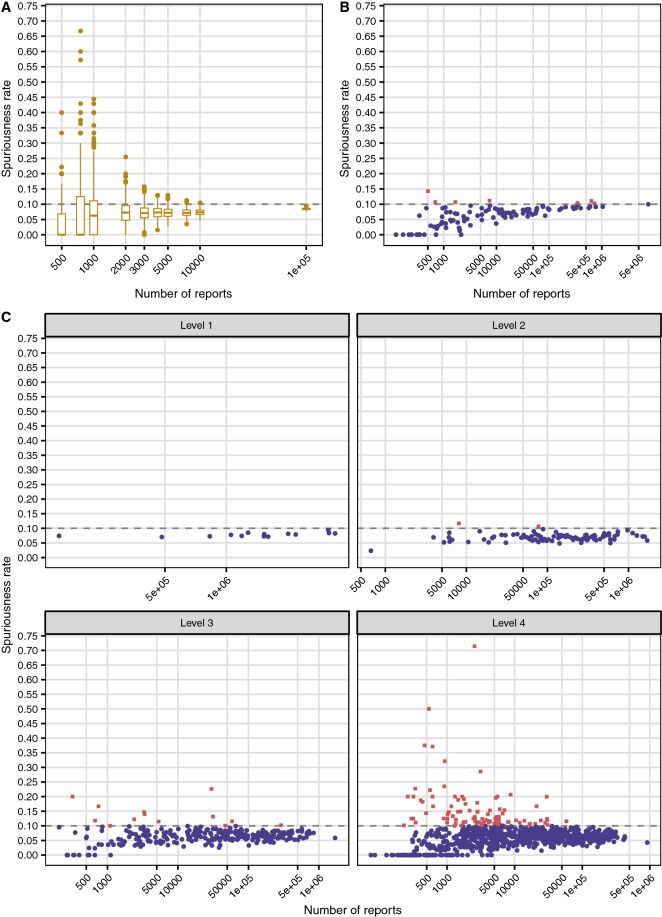
Methods: Three types of subsets were created from the global database VigiBase: random subsets (500 replicates each of 11 fixed subset sizes between 250 and 100,000 reports), country-specific subsets (all 131 countries available in the original VigiBase extract) and subsets based on the Anatomical Therapeutic Chemical classification. For each subset, a spuriousness rate was computed as the ratio between the number of drug-event combinations highlighted by disproportionality analysis in a permuted version of the subset and the corresponding number in the original subset. In the permuted data, all true reporting associations between drugs and adverse events were broken. Subsets with fewer than five original associations were excluded. Additionally, the set of disproportionately over-reported drug-event combinations in three specific countries at three different time points were clinically assessed for labelledness. These time points corresponded to database sizes of less than 10,000, 5000 and 1000 reports, respectively. All disproportionality analysis was based on the Information Component (IC), implemented as IC025 > 0.
Results: Spuriousness rates were below 0.15 for all 110 included countries regardless of subset size, with only seven countries (6%) exceeding the empirical threshold of 0.10 observed for large subsets. All 21 excluded countries had < 500 reports. For random subsets containing 3000-5000 or more reports, the higher end of observed spuriousness rates was close to 0.10. In the clinical assessment, the proportion of labelled or otherwise known drug-event combinations was very high (87-100%) across all countries and time points studied.
Conclusions: To mitigate the risk of highlighting spurious associations with disproportionality analysis, a minimum size of 500 reports is recommended for national databases. For databases or subsets that are not country-specific, our recommendation is 5000 reports. This study does not consider sensitivity, which is expected to be poor in smaller databases.
Conflict of interest statement
Ola Caster, Yasunori Aoki, Lucie Gattepaille and Birgitta Grundmark declare that they have no conflicts of interest that are directly relevant to the content of this study.
Figures
References
-
- Caster O, Norén GN, Madigan D, Bate A. Large-scale regression-based pattern discovery: the example of screening the WHO global drug safety database. Stat Anal Data Min. 2010;3:197–208.
MeSH terms
LinkOut - more resources
Full Text Sources
Medical
