. 2021 Mar-Apr;19(2):159-177.
doi: 10.1080/15402002.2020.1721501. Epub 2020 Feb 2.

Socioeconomic Status and Sleep among Couples

Affiliations

Socioeconomic Status and Sleep among Couples

Ekjyot K Saini et al. Behav Sleep Med. 2021 Mar-Apr.

Abstract

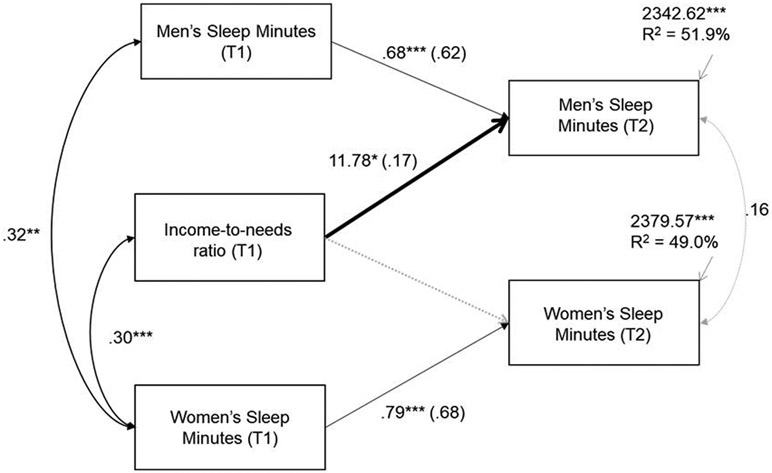
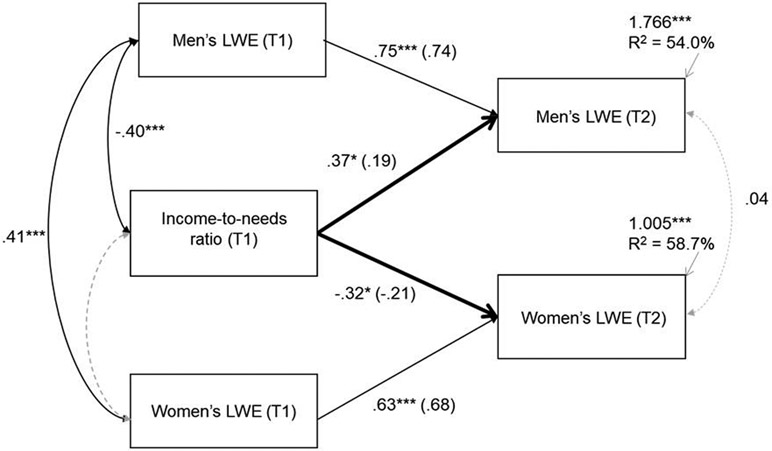
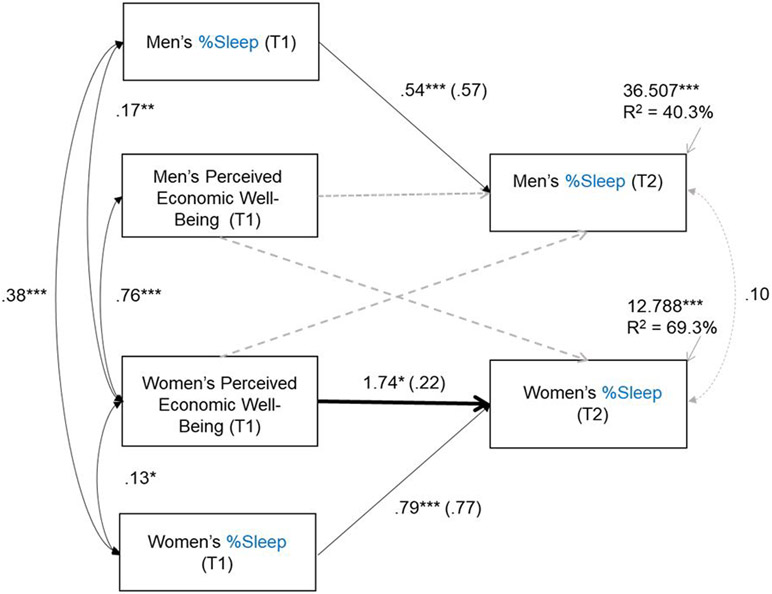
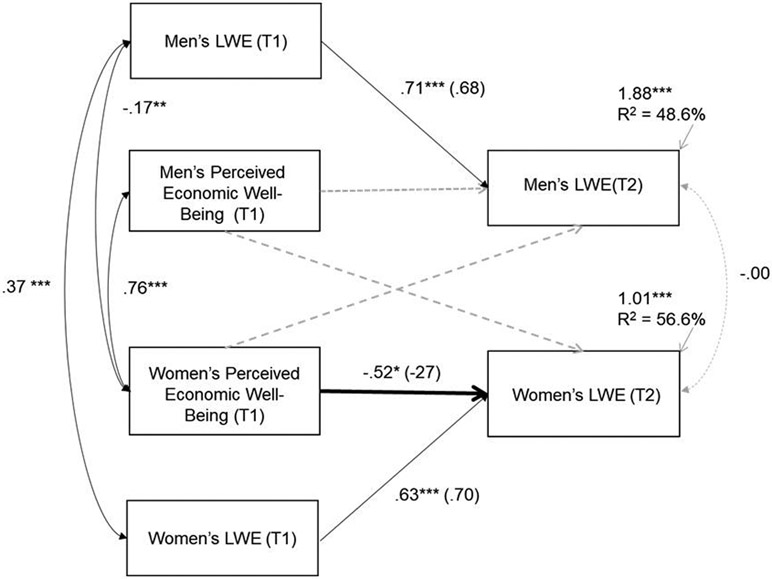
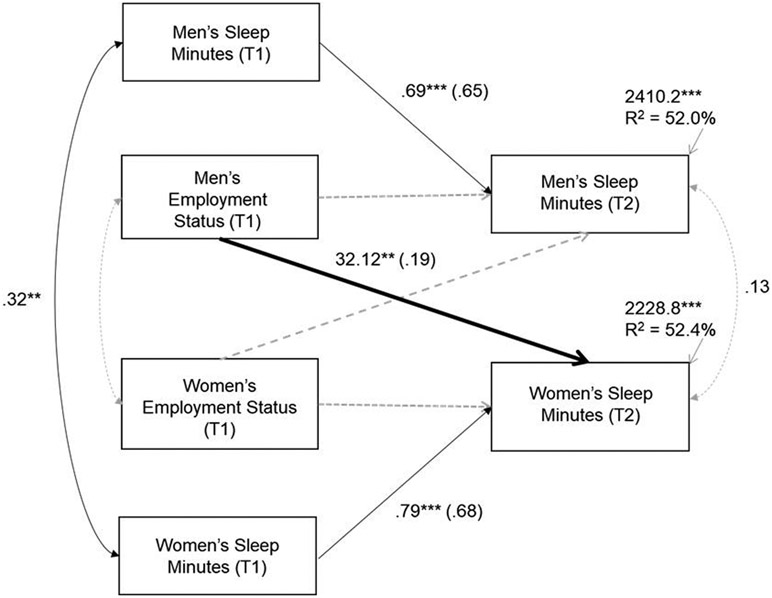
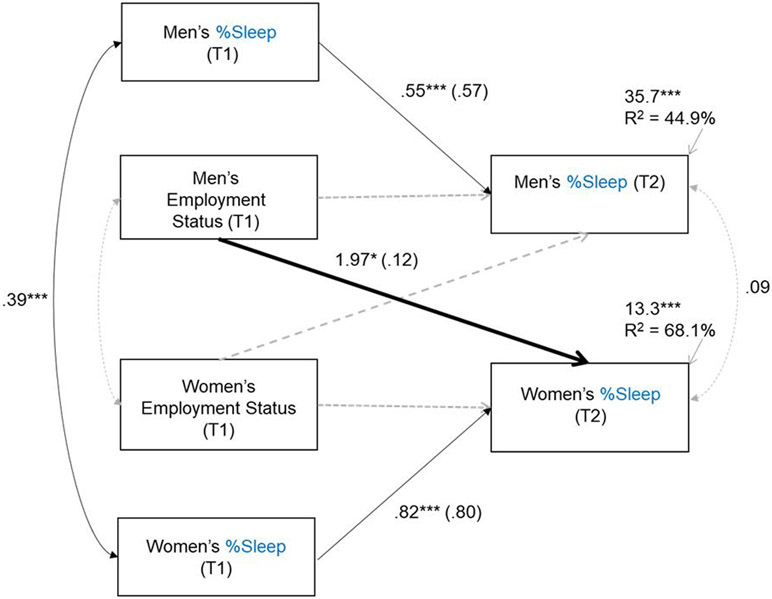
Objective/Background: Lower socioeconomic status (SES) is generally associated with poor sleep but little is known about how different SES indices are associated with sleep duration and quality, or about these relations longitudinally or in cohabiting couples. The main objective was to examine longitudinal associations between multiple SES and sleep parameters in cohabiting adults. Participants: Participants were cohabiting couples (N = 135) of women (M age = 37.2 years, SD = 5.93; 76% White/European American, 18% Black/African American) and men (M = 39.9 years, SD = 7.33; 78% White, 18% Black). Methods: Men and women participated twice with a 1-year lag. At Time (T1), participants reported on multiple SES indices including their income, perceived economic well-being, education, employment status, and occupation. Sleep at T1 and T2 was assessed with self-reports and actigraphs (sleep duration from onset to wake time, %sleep from onset to wake, long wake episodes). Results: Actor effects on actigraphy-assessed sleep parameters were evident for both men and women; low SES was associated with shorter duration and poor quality (%sleep, long wake episodes) sleep. These associations were most pronounced for income-to-needs ratio (men and women) and perceived economic well-being (women only). Partner effects were also evident such that men's employment status was associated with women's longer sleep duration and greater sleep quality (%sleep) whereas women's employment predicted increased subjective sleep problems for men. Conclusion: Findings illustrate the need to consider multiple SES and sleep indices, as well as the family context in studies addressing linkages between SES and sleep.


Figures

Figure 1.
Figure 1.
Solid bold lines represent significant actor/partner pathways, solid lines represent significant paths, and dashed lines indicate non-significant pathways. Unstandardized and standardized (in parentheses) coefficients are provided for pathways. Correlations are provided for covarying pathways. All models control for age, race, medication use, cohabitation length, season of assessment, and autoregressive effects for sleep (T1). Note: * p < .05, ** p < .01, *** p < .001.
Figure 2.
Figure 2.
Solid bold lines represent significant actor/partner pathways, solid lines represent significant paths, and dashed lines indicate non-significant pathways. Unstandardized and standardized (in parentheses) coefficients are provided for pathways. Correlations are provided for covarying pathways. All models control for age, race, medication use, cohabitation length, season of assessment, and autoregressive sleep effects (T1). Note: * p < .05, ** p < .01, *** p < .001; LWE = long wake episodes.
Figure 3.
Figure 3.
Solid bold lines represent significant actor/partner pathways, solid lines represent significant paths, and dashed lines indicate non-significant pathways. Unstandardized and standardized (in parentheses) coefficients are provided for pathways. Correlations are provided for covarying pathways. All models control for age, race, medication use, cohabitation length, season of assessment, and autoregressive sleep effects (T1). Note: * p < .05, ** p < .01, *** p < .001. %Sleep = percentage of epochs asleep from sleep onset to wake.
Figure 4.
Figure 4.
Solid bold lines represent significant actor/partner pathways, solid lines represent significant paths, and dashed lines indicate non-significant pathways. Unstandardized and standardized (in parentheses) coefficients are provided for pathways. Correlations are provided for covarying pathways. All models control for age, race, medication use, cohabitation length, season of assessment, and autoregressive sleep effects (T1). Note: * p < .05, ** p < .01, *** p < .001; LWE = Long wake episodes.
Figure 5.
Figure 5.
Solid bold lines represent significant actor/partner pathways, solid lines represent significant paths, and dashed lines indicate non-significant pathways. Unstandardized and standardized (in parentheses) coefficients are provided for pathways. Correlations are provided for covarying pathways. All models control for age, race, medication use, cohabitation length, season of assessment, and autoregressive sleep (T1). Note: * p < .05, ** p < .01, *** p < .001.
Figure 6.
Figure 6.
Solid bold lines represent significant actor/partner pathways, solid lines represent significant paths, and dashed lines indicate non-significant pathways. Unstandardized and standardized (in parentheses) coefficients are provided for pathways. Correlations are provided for covarying pathways. All models control for age, race, medication use, cohabitation length, season of assessment, and autoregressive sleep (T1). Note: * p < .05, ** p < .01, *** p < .001. %Sleep = percentage of epochs asleep from sleep onset to wake.
Figure 7.
Figure 7.
Solid bold lines represent significant actor/partner pathways, solid lines represent significant paths, and dashed lines indicate non-significant pathways. Unstandardized and standardized (in parentheses) coefficients are provided for pathways. Correlations are provided for covarying pathways. All models control for age, race, medication use, cohabitation length, season of assessment, and autoregressive sleep. Note: * p < .05, ** p < .01, *** p < .001; Subj. Sleep Problems = Subjective sleep problems.

References

    1. Acebo C, & Carskadon MA (2001). Scoring actigraph data using ACTION-W 2. Providence, RI: Bradley Sleep Center, Brown University.
    1. Acebo C, Sadeh A, Seifer R, Tzischinsky O, Wolfson A, Hafer A, & Carskadon MA (1999). Estimating sleep patterns with actigraphy monitoring in children and adolescents: How many nights are necessary for reliable measures? Sleep, 22(1), 95–103. doi:10.1093/sleep/22.1.95 - DOI - PubMed
    1. Acock AC (2005). Working with missing values. Journal of Marriage and Family, 67(4), 1012–1028. doi:10.1111/j.1741-3737.2005.00191.x - DOI
    1. Ancoli-Israel S, Martin JL, Blackwell T, Buenaver L, Liu L, Meltzer LJ, ... & Taylor DJ (2015). The SBSM guide to actigraphy monitoring: clinical and research applications. Behavioral Sleep Medicine, 13(sup1), S4–S38. doi: 10.1080/15402002.2015.1046356 - DOI - PubMed
    1. Arber S, Bote M, & Meadows R (2009). Gender and socio-economic patterning of self-reported sleep problems in Britain. Social Science & Medicine, 68(2), 281–289.doi: 10.1016/j.socscimed.2008.10.016 - DOI - PubMed

Publication types