Comparison of Chemical Exchange Saturation Transfer Imaging with Diffusion-weighted Imaging and Magnetic Resonance Spectroscopy in a Rat Model of Hypoxic-ischemic Encephalopathy
- PMID: 32009063
- PMCID: PMC7809148
- DOI: 10.2463/mrms.mp.2019-0128
Comparison of Chemical Exchange Saturation Transfer Imaging with Diffusion-weighted Imaging and Magnetic Resonance Spectroscopy in a Rat Model of Hypoxic-ischemic Encephalopathy
Abstract
Purpose: This study aimed to evaluate the effect of chemical exchange saturation transfer (CEST) on the ischemic regions in hypoxic-ischemic encephalopathy (HIE) in comparison with diffusion-weighted imaging (DWI) and magnetic resonance spectroscopy (MRS) using a 7T-MRI.
Methods: We used neonatal rats (n = 8), aged 8 days, to clarify the progression of HIE. The rat model of HIE was developed by ligating and severing the left common carotid artery, followed by 45 minutes of recovery, and 60 minutes of hypoxia (8% O2/92% N2; 34°C). At 0-2 and 24 hours after the onset of HIE, CEST imaging, DWI, and MRS were performed with a 7T-MRI. The magnetization transfer ratio (MTR) asymmetry curves and four MTR asymmetry maps at 0.5, 1.0, 2.0, and 3.5 ppm were calculated using the CEST images. Fractional anisotropy (FA) and apparent diffusion coefficient (ADC) maps were calculated by DWI, and brain metabolites were assessed by MRS.
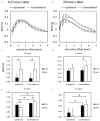
Results: In the ischemic regions of neonatal rats, FA was significantly increased at 0-2 hours and decreased at 24 hours after the onset of HIE. ADC in the ipsilateral side was significantly lower than that of contralateral side. All rats with HIE showed hypointense areas on MTR asymmetry maps (2.0 and 3.5 ppm), that did not correspond with the hyperintense areas on DWI. In addition, a significant increase in lactate levels was observed at 0-2 and 24 hours after the onset of HIE.
Conclusion: CEST MTR maps did not correspond with the hyperintense areas on DWI at 0-2 and 24 hours after the onset of HIE. The change of multi offset CEST signal may be primarily related to the brain metabolites and pH alterations, such as that caused by lactate, after the onset of HIE.
Keywords: chemical exchange saturation transfer; hypoxic-ischemic encephalopathy; magnetic resonance spectroscopy.
Conflict of interest statement
The authors declare no financial or commercial conflicts of interest.
Figures


References
-
- Douglas-Escobar M, Weiss MD. Hypoxic-ischemic encephalopathy: a review for the clinician. JAMA Pediatr 2015; 169:397–403. - PubMed
-
- Ferriero DM. Neonatal brain injury. N Engl J Med 2004; 351:1985–1995. - PubMed
-
- Kumral A, Ozer E, Yilmaz O, et al. Neuroprotective effect of erythropoietin on hypoxic-ischemic brain injury in neonatal rats. Biol Neonate 2003; 83:224–228. - PubMed

