

Causal Diagrams: Pitfalls and Tips
- PMID: 32009103
- PMCID: PMC7064555
- DOI: 10.2188/jea.JE20190192
Causal Diagrams: Pitfalls and Tips
Abstract
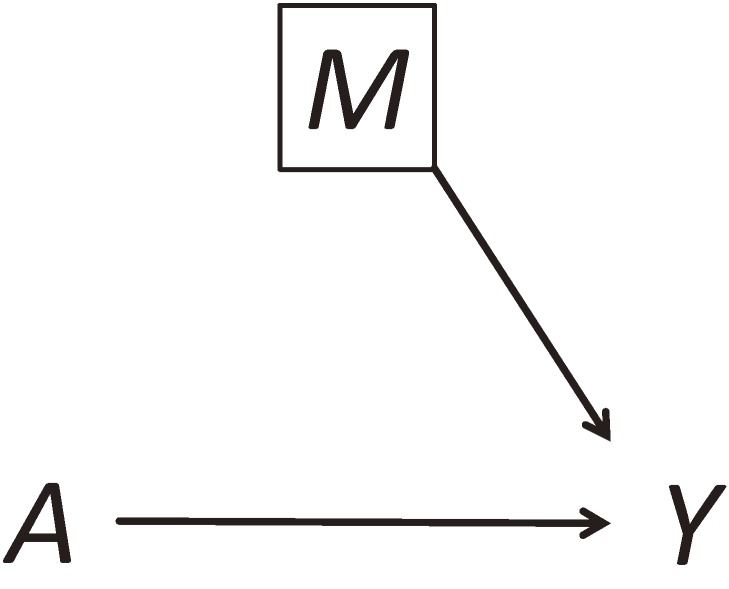
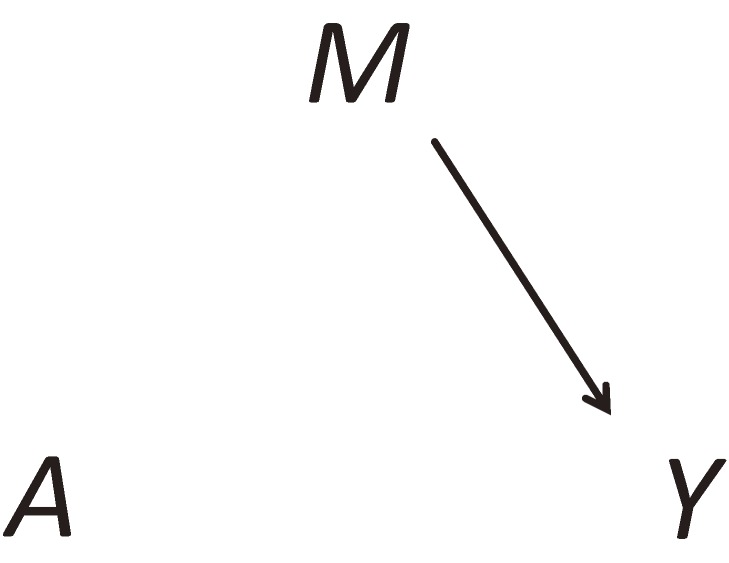
Graphical models are useful tools in causal inference, and causal directed acyclic graphs (DAGs) are used extensively to determine the variables for which it is sufficient to control for confounding to estimate causal effects. We discuss the following ten pitfalls and tips that are easily overlooked when using DAGs: 1) Each node on DAGs corresponds to a random variable and not its realized values; 2) The presence or absence of arrows in DAGs corresponds to the presence or absence of individual causal effect in the population; 3) "Non-manipulable" variables and their arrows should be drawn with care; 4) It is preferable to draw DAGs for the total population, rather than for the exposed or unexposed groups; 5) DAGs are primarily useful to examine the presence of confounding in distribution in the notion of confounding in expectation; 6) Although DAGs provide qualitative differences of causal structures, they cannot describe details of how to adjust for confounding; 7) DAGs can be used to illustrate the consequences of matching and the appropriate handling of matched variables in cohort and case-control studies; 8) When explicitly accounting for temporal order in DAGs, it is necessary to use separate nodes for each timing; 9) In certain cases, DAGs with signed edges can be used in drawing conclusions about the direction of bias; and 10) DAGs can be (and should be) used to describe not only confounding bias but also other forms of bias. We also discuss recent developments of graphical models and their future directions.
Keywords: bias; causal inference; causality; confounding; directed acyclic graphs.
Figures
Comment in
-
Pitfalls and Tips for Statistical Methods in Epidemiology: A New Series of Special Articles Has Started.J Epidemiol. 2020 Apr 5;30(4):151-152. doi: 10.2188/jea.JE20190360. Epub 2020 Feb 1. J Epidemiol. 2020. PMID: 32009105 Free PMC article. No abstract available.
References
-
- Pearl J. Causality: Models, Reasoning, and Inference. 2nd ed. New York, NY. Cambridge University Press; 2009.
-
- Glymour MM, Greenland S. Causal diagram. In: Rothman KJ, Greenland S, Lash TL, eds. Modern Epidemiology. 3rd ed. Philadelphia, PA: Lippincott Williams & Wilkins; 2008:183–209.
-
- Glymour MM. Using causal diagrams to understand common problems in social epidemiology. In: Oakes JM, Kaufman JS, eds. Methods in Social Epidemiology. 2nd ed. San Francisco, CA: Jossey-Bass; 2017:458–492.
-
- Hernán MA, Robins JM. Causal Inference: What If. Boca Raton, FL. Chapman & Hall/CRC; 2020.