

Stable expansion of high-grade serous ovarian cancer organoids requires a low-Wnt environment
- PMID: 32009247
- PMCID: PMC7073464
- DOI: 10.15252/embj.2019104013
Stable expansion of high-grade serous ovarian cancer organoids requires a low-Wnt environment
Abstract
High-grade serous ovarian cancer (HGSOC) likely originates from the fallopian tube (FT) epithelium. Here, we established 15 organoid lines from HGSOC primary tumor deposits that closely match the mutational profile and phenotype of the parental tumor. We found that Wnt pathway activation leads to growth arrest of these cancer organoids. Moreover, active BMP signaling is almost always required for the generation of HGSOC organoids, while healthy fallopian tube organoids depend on BMP suppression by Noggin. Fallopian tube organoids modified by stable shRNA knockdown of p53, PTEN, and retinoblastoma protein (RB) also require a low-Wnt environment for long-term growth, while fallopian tube organoid medium triggers growth arrest. Thus, early changes in the stem cell niche environment are needed to support outgrowth of these genetically altered cells. Indeed, comparative analysis of gene expression pattern and phenotypes of normal vs. loss-of-function organoids confirmed that depletion of tumor suppressors triggers changes in the regulation of stemness and differentiation.
Keywords: BMP signaling; Wnt signaling; patient-derived HGSOC organoids; stemness; tumor suppressor knockdown.
© 2020 The Authors. Published under the terms of the CC BY NC ND 4.0 license.
Conflict of interest statement
The authors declare that they have no conflict of interest.
Figures
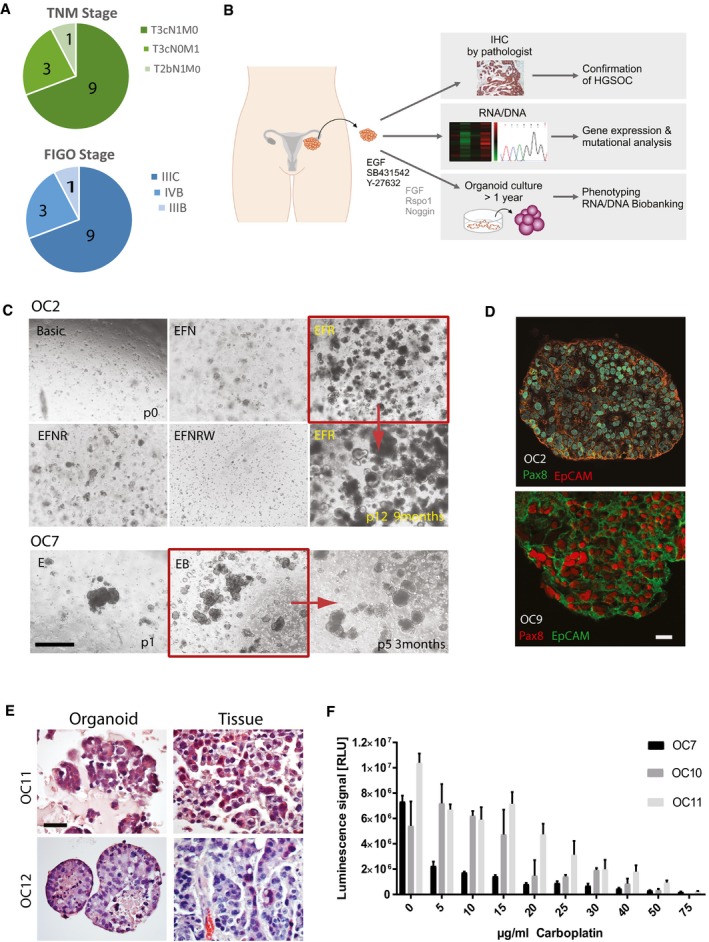
Summary of cancer patient data with TNM and FIGO classifications showing advanced stage of disease at the time of surgery.
Graphic representation of the standard experimental procedure for tumor patient material. Samples were obtained at the time of primary debulking surgery from the high purity tumor deposits in peritoneum/omentum.
In vitro niche dependency of HGSOC tumor cells. Phase‐contrast pictures illustrate that isolated ovarian cancer cells rely on EGF supplementation for growth, while they do not grow at all in Wnt3a‐supplemented medium. Also, inhibition of BMP signaling through Noggin has strong negative effect on the initial growth. Scale bar: 500 μm. E—EGF, F—FGF10, N—Noggin, R—R‐spondin1, B—Basic medium, P—Passage.
Cancer organoids express HGSOC markers Pax8 and EpCAM and have lost the cystic phenotype suggesting complete breakdown of epithelial polarity as seen on confocal images from two representative organoid lines. Scale bar: 20 μm.
HE staining of organoids and respective tissue confirms high similarity in cellular structure and tissue organization. Scale bar: 100 μm.
HGSOC organoids show differential response to carboplatin treatment, confirming patient‐specific sensitivity of the cultures. Cell viability assay was performed after 5 days of treatment with different concentrations of carboplatin on mature organoids from three different donors. Data represent mean ± SD of technical triplicates.
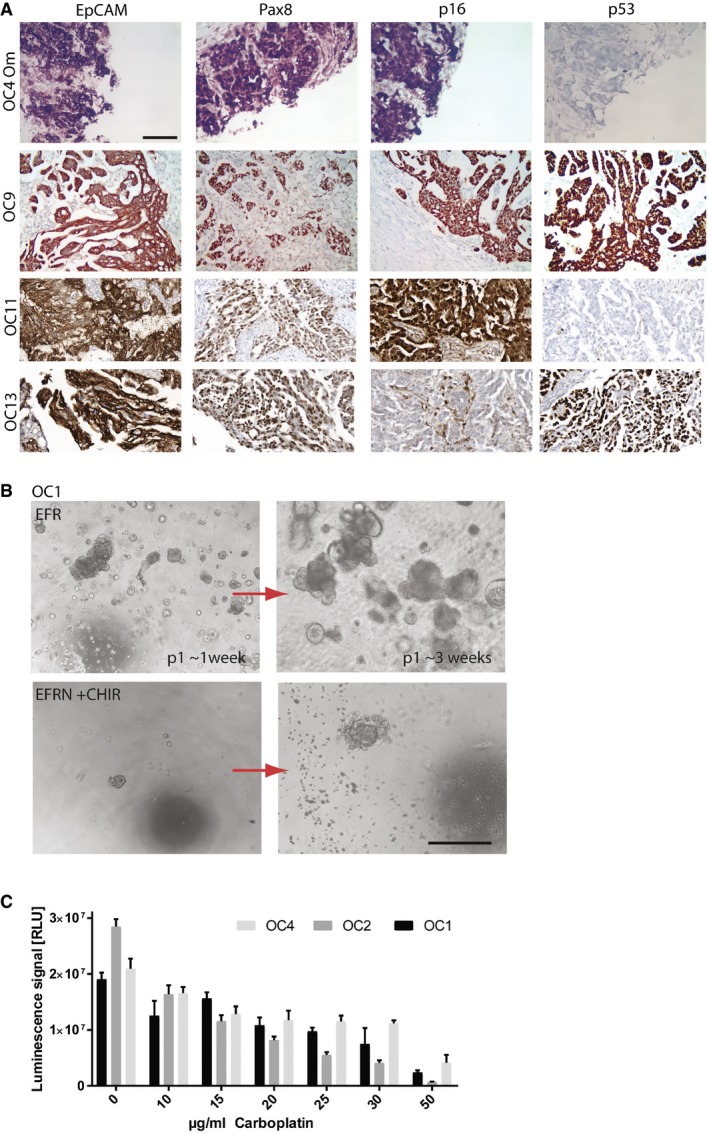
Diagnosis of ovarian cancer in tissue fragments used for organoid generation was confirmed by experienced pathologists to be of HGSOC phenotype, being marked by strong EpCAM, Pax8, and p16 expression. Depicted are four examples of the pathology stainings. Scale bar: 100 μm.
Phase‐contrast images of the establishment of HGSOC organoid culture (OC1) showing strong negative effect of low‐BMP (presence of Noggin) and high‐Wnt signaling, achieved here by the addition of GSK3‐β inhibitor CHIR (3 μM) (lower panel). While isolates seeded in EFR medium gave rise to expanding organoids (upper panel), only small aggregates formed in the presence of CHIR (lower left) and entered growth arrest with prominent cell debris indicative of cell death (lower right). This culture could not be further maintained. Scale bar: 500 μm.
Three HGSOC organoid lines were tested for their response to the drug carboplatin showing slightly different responses as determined by cell viability assay. Data represent mean ± SD of technical triplicates.
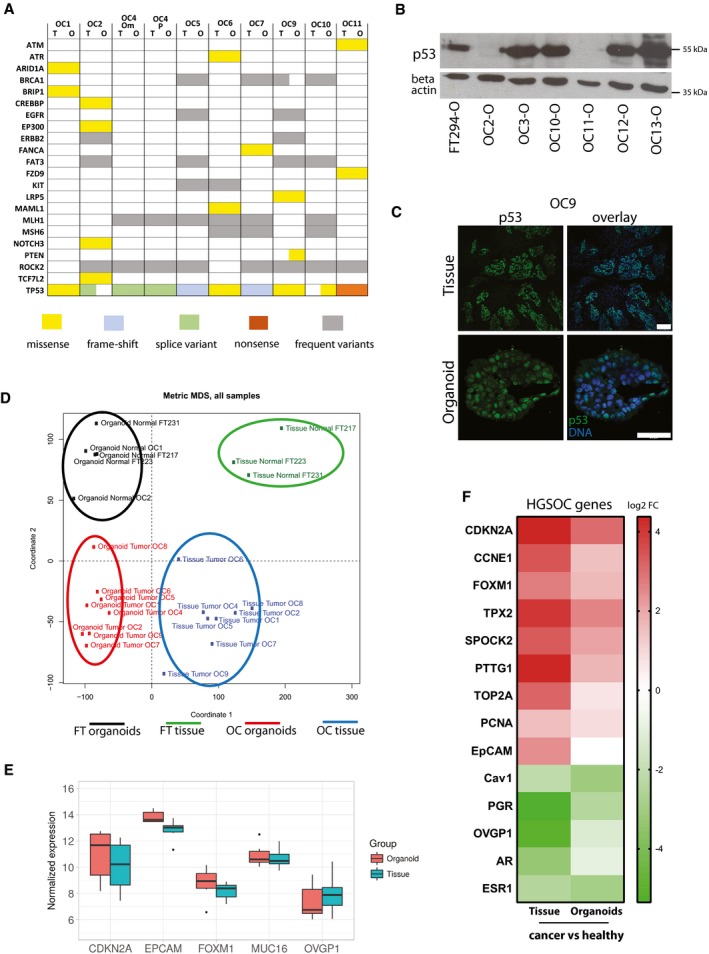
Overview of mutations found in organoid cultures and matching tumor tissue obtained by targeted sequencing of 121 HGSOC‐related genes confirms almost identical profile between parental tissue and in vitro long‐term organoid culture. Color code indicates type of mutations which were detected.
Representative Western blot showing loss or overexpression of p53 in individual organoid lines.
Strong nuclear p53 signal in immunostainings of HGSOC organoids is indicative of a gain‐of‐function TP53 mutation. Scale bars: 100 μm (tissue) and 50 μm (organoid).
Multi‐dimensional scaling (MDS) plot based on the gene expression profiles (microarrays) of three healthy FT and eight tumor tissue samples and their respective organoid cultures shows four clusters: normal FT tissue, normal FT organoids, cancer organoids, and cancer tissue.
Box plots depicting overall constant level in normalized expression of major HGSOC marker genes between organoids and parental tissue. Data represent the median, quartiles, maximum, and minimum of the normalized expression from eight different donors.
Heat map of differentially expressed genes between cancer and healthy tissue/organoids reveals up‐regulation of several HGSOC biomarkers and reduction in FT differentiation markers in the cancer samples. Differential expression determined by single‐color microarray for eight different patient samples was significant for all genes with P < 0.05 except for OVGP1 and TOP2A in organoids.
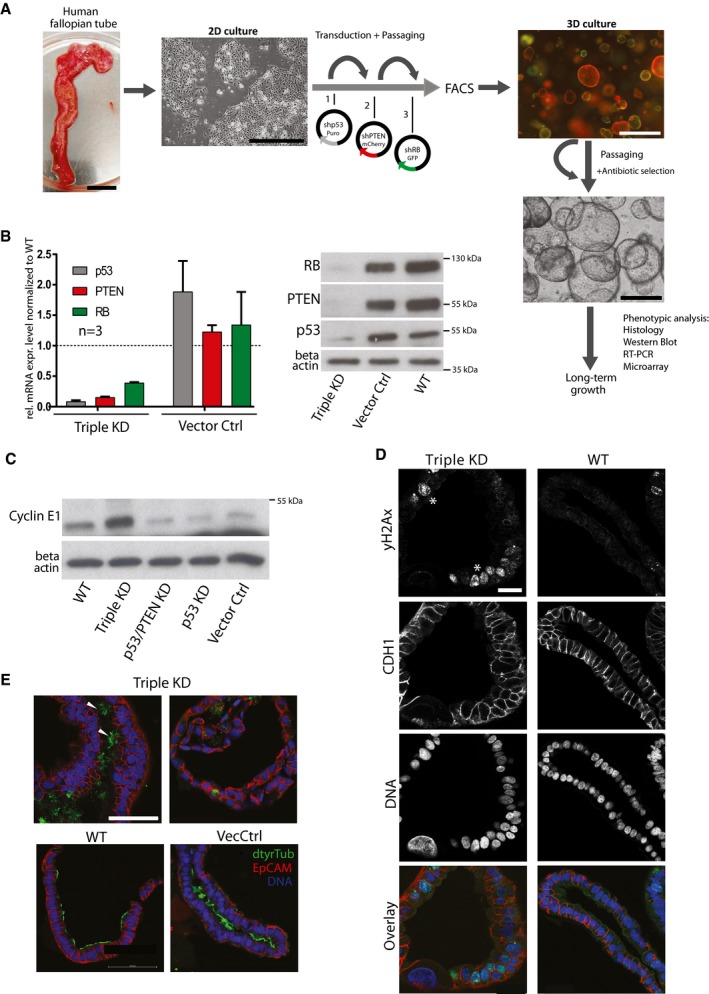
Experimental approach for genetic manipulation of FT epithelial cells (FTECs). FTECs were sequentially transduced in 2D culture with replication‐deficient viruses containing specific shRNAs and different selection markers. After sorting, cells were seeded in Matrigel for organoid formation. Scale bars: 2 cm (tissue), 200 μm (2D culture), and 500 μm (3D culture).
Confirmation of robust knockdowns of p53, PTEN, and RB in FT organoids on RNA and protein level. Relative mRNA levels were normalized to the WT mRNA level and are given as the mean ± SEM from three different donors. A representative Western blot from one donor is depicted. RNA and protein samples were taken at passage 1 or 2 of each organoid line. KD—knockdown, Vec Ctrl—vector control, WT—wild type.
Cyclin E1 overexpression as a downstream effect of RB knockdown was confirmed by Western blot analysis.
Confocal images of triple KD organoids reveal increased DNA damage (yH2AX, marked by asterisks), atypic nuclei (DRAQ5), and loss of apicobasal polarity. Scale bar: 20 μm.
Presence of ciliated cells (arrowheads), as revealed by immunostaining against detyrosinated Tubulin (dtyrTub) in triple KD organoids, proves capacity for terminal differentiation. Scale bar: 50 μm.
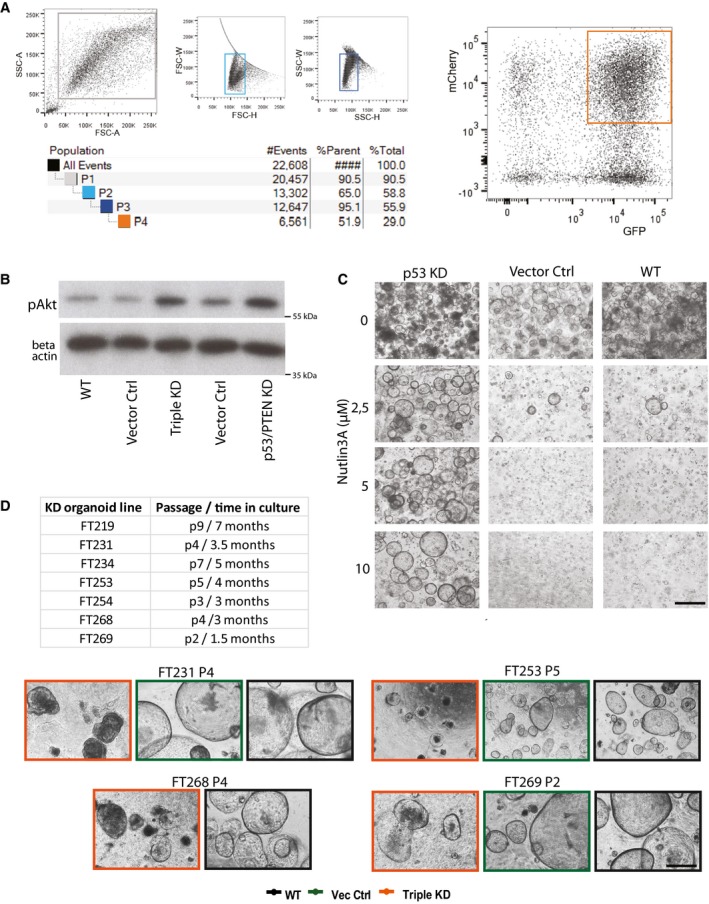
Gating strategy to sort GFP/mCherry double‐positive single cells derived from transduced FT epithelial cells.
Activation of the AKT pathway as indicated by increased levels of phospho‐Akt (pAkt) protein proves functional disruption of the AKT/PI3K pathway due to PTEN knockdown.
P53 KD organoids, but not the control cultures, are resistant to treatment with MDM2 inhibitor Nutlin‐3A, confirming functional disruption of p53 signaling. Scale bar: 500 μm.
Summary table and representative phase‐contrast images of the seven triple KD organoid lines that were generated from different donors, all of which showed a premature growth arrest. Scale bar: 500 μm.
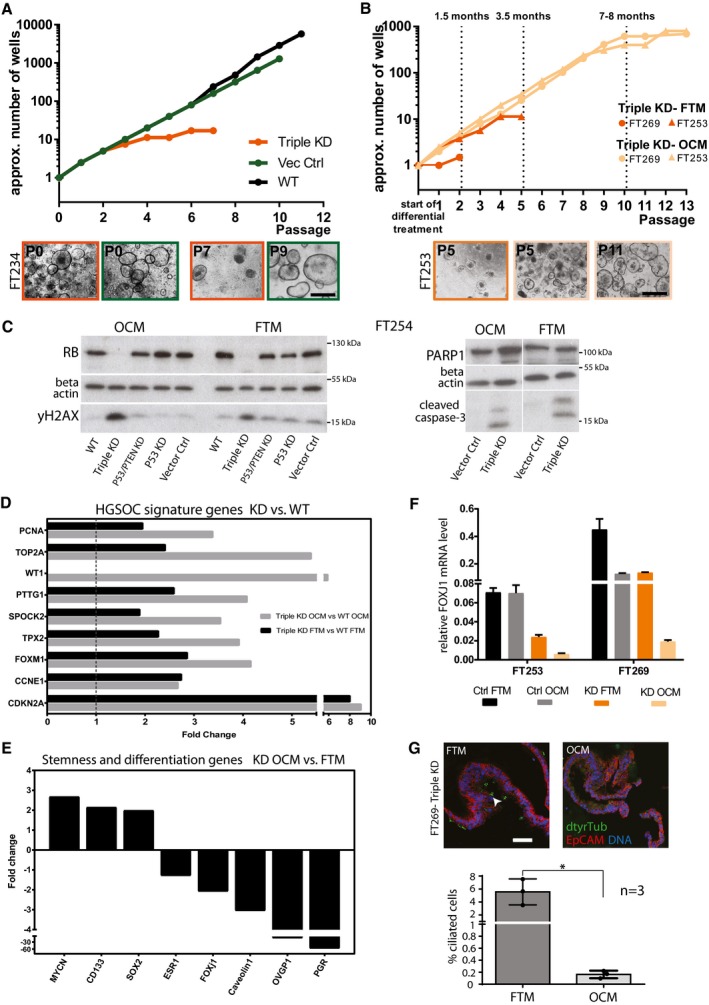
In long‐term 3D culture, triple KD organoids show loss of growth capacity and premature growth arrest compared to the controls as indicated by the representative growth curves of FT234. Scale bar: 500 μm.
Growth curves and phase‐contrast images of triple KD organoids grown in OCM compared to FTM reveal successful rescue of long‐term growth capacity. Scale bar: 500 μm.
Levels of DNA damage (yH2AX) and apoptosis (cleaved caspase‐3, PARP1) do not differ among the different media as shown by representative Western blots comparing triple KD organoids and their controls.
Triple KD (p53/PTEN/RB) organoids are characterized by a HGSOC gene expression signature as revealed by microarray analysis comparing WT and KD organoids grown in either OCM or FTM. Differential expression determined by dual‐color microarray for two biological replicates was significant for all genes with P < 0.00005.
Differential expression of stemness‐ and differentiation‐related genes of triple KD organoids grown in OCM vs. FTM. Fold changes were derived from microarray data and indicate an increase in stemness (CD133, SOX2, MYCN) and a drop in differentiation (OVGP1, PGR, FOXJ1) under OCM conditions. Differential expression determined by dual‐color microarray for two biological replicates was significant for all genes with P < 0.05.
FOXJ1 expression determined by qPCR was significantly diminished in triple KD organoids grown in OCM compared to FTM, suggesting a decrease in differentiation capacity. Data represent the mean ± SEM from technical triplicates for two independent knockdown cultures.
Proportion of ciliated cells (detyrosinated tubulin; dtyrTub) is significantly reduced in KD organoids under OCM growth conditions, confirming inhibition of differentiation as illustrated by confocal images (Scale bar: 50 μm). The quantification plot depicts the mean ± SEM from three independent biological replicates, based on quantification of the average number of ciliated cells per counted nuclei. 1,000 cells were counted per individual experiment. *P < 0.05, two‐sided Student's t‐test.
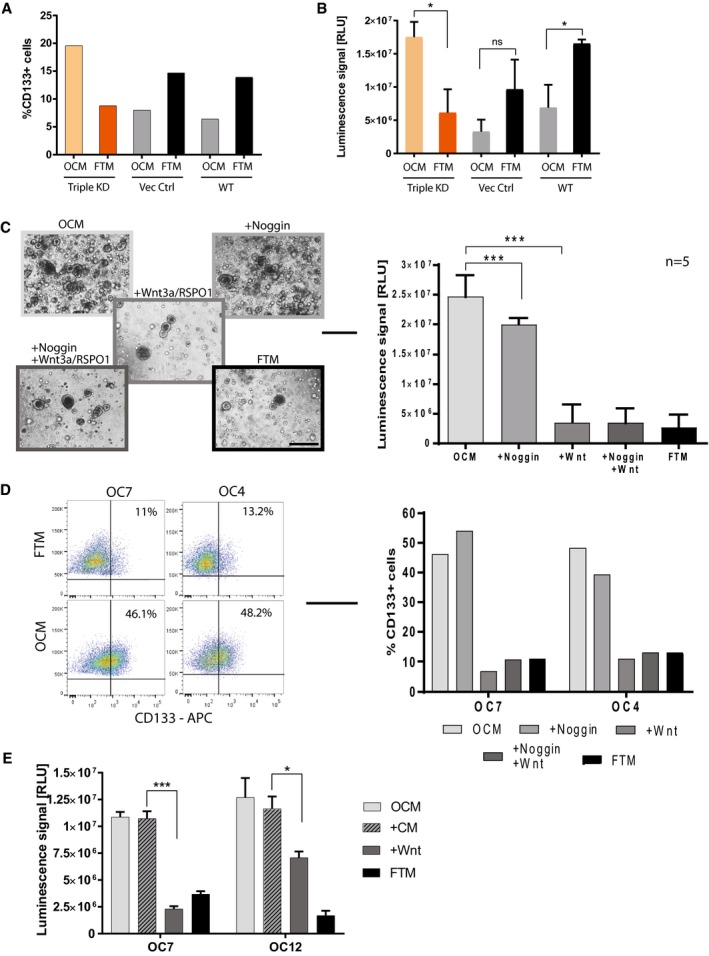
The proportion of CD133+ cells was determined by FACS analysis after growing triple KD and control cells in FTM vs. OCM for two passages. The graph is representative of two biological replicates.
Growth capacity increases when KD organoids are grown in OCM medium as shown by difference in total viable cell number (representative graph of three independent experiments). The luminescent cell viability assay was performed in triplicate, and the bar plot depicts the mean ± SEM. *P < 0.05, two‐sided Student's t‐test; KD—knockdown, Vec Ctrl—vector control, WT—wild type.
Phase‐contrast images of cancer organoids which entered growth arrest upon treatment with Wnt agonists (Wnt3a/RSPO1) over two passages (Scale bar: 500 μm). Differences in cell number were confirmed by the respective cell viability assays (performed in technical triplicates). Data represent the mean ± SEM for five different OC organoid lines (n = 5). ***P < 0.001, two‐sided Student's t‐test.
The number of CD133+ cells determined by FACS for OC7 and OC4 organoids grown in different media with or without Wnt3a/RSPO1 and with or without Noggin over two passages confirms a sharp drop in stemness in the presence of Wnt agonists.
Addition of conditioned medium collected from the parental Wnt3a cell line did not suppress growth of cancer organoids, proving that the growth inhibitory effect is due to the presence of Wnt agonists. The bar plot represents the mean ± SEM of triplicates performed with a luminescent cell viability assay. *P < 0.05, ***P < 0.001, two‐sided Student's t‐test.
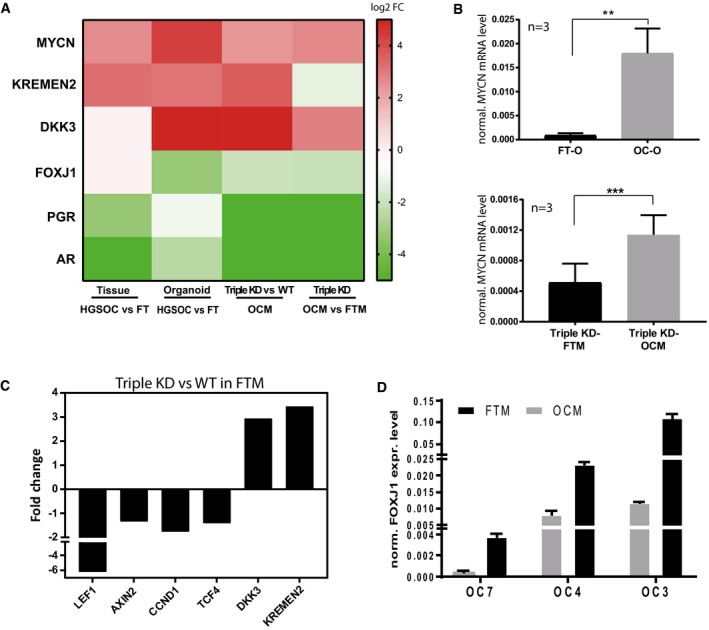
Comparative analysis of microarray data revealed consistent up‐regulation of MYCN and the canonical Wnt inhibitors KREMEN2 and DKK3 as well as down‐regulation of differentiation marker FOXJ1, AR, and PGR in HGSOC cancer organoids as well as triple KD FT organoids. Differential expression was determined either by single‐color microarray for the cancer samples (eight replicates) or by dual‐color microarray for the knockdowns (two replicates) and is significant for all genes with P < 0.05.
Transcriptional induction of MYCN is confirmed by qPCR for three patients between cancer organoids and normal FT organoids as well as triple KD organoids grown in OCM vs. FTM conditions. Depicted is the mean ± SEM of the normalized MYCN mRNA expression level of three biological replicates (n = 3). **P < 0.01, ***P < 0.001, two‐sided Student's t‐test.
Microarray data revealed that the expression levels of Wnt target genes are downregulated in triple KD compared to WT control FT organoids. Differential expression determined by dual‐color microarray for two biological replicates was significant for all genes with P ≤ 0.005.
FOXJ1 expression was upregulated in HGSOC organoids in FTM compared to OCM as shown by qPCR analysis of three different patient samples. Data represent the mean ± SEM of technical triplicates.
Similar articles
-
Human Fallopian Tube-Derived Organoids with TP53 and RAD51D Mutations Recapitulate an Early Stage High-Grade Serous Ovarian Cancer Phenotype In Vitro.Int J Mol Sci. 2024 Jan 10;25(2):886. doi: 10.3390/ijms25020886. Int J Mol Sci. 2024. PMID: 38255960 Free PMC article.
-
Probing the tumorigenic potential of genetic interactions reconstituted in murine fallopian tube organoids.J Pathol. 2021 Oct;255(2):177-189. doi: 10.1002/path.5752. Epub 2021 Jul 21. J Pathol. 2021. PMID: 34184756
-
Human fallopian tube epithelial cells exhibit stemness features, self-renewal capacity, and Wnt-related organoid formation.J Biomed Sci. 2020 Feb 8;27(1):32. doi: 10.1186/s12929-019-0602-1. J Biomed Sci. 2020. PMID: 32035490 Free PMC article.
-
Pathogenesis and heterogeneity of ovarian cancer.Curr Opin Obstet Gynecol. 2017 Feb;29(1):26-34. doi: 10.1097/GCO.0000000000000340. Curr Opin Obstet Gynecol. 2017. PMID: 27898521 Free PMC article. Review.
-
Fallopian tube precursors of ovarian low- and high-grade serous neoplasms.Histopathology. 2013 Jan;62(1):44-58. doi: 10.1111/his.12046. Histopathology. 2013. PMID: 23240669 Review.
Cited by
-
Human Fallopian Tube-Derived Organoids with TP53 and RAD51D Mutations Recapitulate an Early Stage High-Grade Serous Ovarian Cancer Phenotype In Vitro.Int J Mol Sci. 2024 Jan 10;25(2):886. doi: 10.3390/ijms25020886. Int J Mol Sci. 2024. PMID: 38255960 Free PMC article.
-
Beyond 2D cell cultures: how 3D models are changing the in vitro study of ovarian cancer and how to make the most of them.PeerJ. 2024 Aug 29;12:e17603. doi: 10.7717/peerj.17603. eCollection 2024. PeerJ. 2024. PMID: 39221267 Free PMC article. Review.
-
Patient-Derived In Vitro Models of Ovarian Cancer: Powerful Tools to Explore the Biology of the Disease and Develop Personalized Treatments.Cancers (Basel). 2023 Jan 5;15(2):368. doi: 10.3390/cancers15020368. Cancers (Basel). 2023. PMID: 36672318 Free PMC article. Review.
-
Human alveolar progenitors generate dual lineage bronchioalveolar organoids.Commun Biol. 2022 Aug 25;5(1):875. doi: 10.1038/s42003-022-03828-5. Commun Biol. 2022. PMID: 36008580 Free PMC article.
-
Clinical applications of human organoids.Nat Med. 2025 Feb;31(2):409-421. doi: 10.1038/s41591-024-03489-3. Epub 2025 Feb 3. Nat Med. 2025. PMID: 39901045 Review.
References
-
- Brummelkamp TR, Bernards R, Agami R (2002) Stable suppression of tumorigenicity by virus‐mediated RNA interference. Cancer Cell 2: 243‐247 - PubMed
-
- Callahan MJ, Crum CP, Medeiros F, Kindelberger DW, Elvin JA, Garber JE, Feltmate CM, Berkowitz RS, Muto MG (2007) Primary fallopian tube malignancies in BRCA‐positive women undergoing surgery for ovarian cancer risk reduction. J Clin Oncol 25: 3985–3990 - PubMed
MeSH terms
Substances
Associated data
- Actions
- Actions
LinkOut - more resources
Full Text Sources
Medical
Molecular Biology Databases
Research Materials
Miscellaneous
