

Outer membrane lipoprotein NlpI scaffolds peptidoglycan hydrolases within multi-enzyme complexes in Escherichia coli
- PMID: 32009249
- PMCID: PMC7049810
- DOI: 10.15252/embj.2019102246
Outer membrane lipoprotein NlpI scaffolds peptidoglycan hydrolases within multi-enzyme complexes in Escherichia coli
Abstract
The peptidoglycan (PG) sacculus provides bacteria with the mechanical strength to maintain cell shape and resist osmotic stress. Enlargement of the mesh-like sacculus requires the combined activity of peptidoglycan synthases and hydrolases. In Escherichia coli, the activity of two PG synthases is driven by lipoproteins anchored in the outer membrane (OM). However, the regulation of PG hydrolases is less well understood, with only regulators for PG amidases having been described. Here, we identify the OM lipoprotein NlpI as a general adaptor protein for PG hydrolases. NlpI binds to different classes of hydrolases and can specifically form complexes with various PG endopeptidases. In addition, NlpI seems to contribute both to PG elongation and division biosynthetic complexes based on its localization and genetic interactions. Consistent with such a role, we reconstitute PG multi-enzyme complexes containing NlpI, the PG synthesis regulator LpoA, its cognate bifunctional synthase, PBP1A, and different endopeptidases. Our results indicate that peptidoglycan regulators and adaptors are part of PG biosynthetic multi-enzyme complexes, regulating and potentially coordinating the spatiotemporal action of PG synthases and hydrolases.
Keywords: bacterial cell envelope; endopeptidase; outer membrane lipoprotein; penicillin-binding protein; peptidoglycan.
© 2020 The Authors. Published under the terms of the CC BY 4.0 license.
Conflict of interest statement
The authors declare that they have no conflict of interest.
Figures
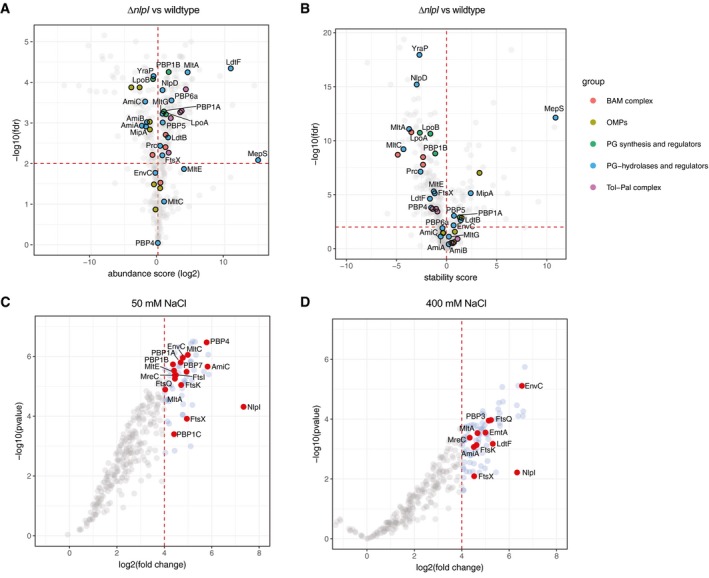
- A, B
Wild‐type and ΔnlpI cells were heated at a range of temperatures, and the soluble components were labelled by TMT, combined and quantified by LC‐MS, using the published 2D‐TPP protocol (Mateus et al, 2018). Shown are volcano plots of two replicates depicting changes in protein abundance (A) and thermostability (B). A local FDR (false discovery rate) < 0.01 was set as a threshold for significance. Highlighted proteins: outer membrane proteins (OMPs, light green), β‐barrel assembly machinery (BAMs, red), PG synthases/regulators (green), PG hydrolases and regulators (blue) and the Tol‐Pal complex (violet). All other proteins were coloured grey and not labelled to increase the plot clarity. Full results can be found in Tables EV1 and EV2.
- C, D
Affinity chromatography with immobilized NlpI. Membrane extracts from E. coli were incubated in low and high salt binding conditions (50 and 400 mM NaCl, respectively), and then eluted with 1 M NaCl or 2 M NaCl to identify possible interaction partners by label‐free LC‐MS analysis. The plot shows the log2 fold enriched proteins when compared to those eluted from a parallel empty column control, versus the log10 P‐value, in low (4 replicates) (C) and high (2 replicates) (D) salt. Highlighted points are all interactions with PG enzymes and their regulators, as well as members of the divisome. All other proteins were coloured grey and not labelled to increase the plot clarity; many were non‐physiological interactions with abundant cytoplasmic proteins. Full results can be found in Tables EV3 and EV4. GO enrichments can be found in Tables EV9 and EV10.
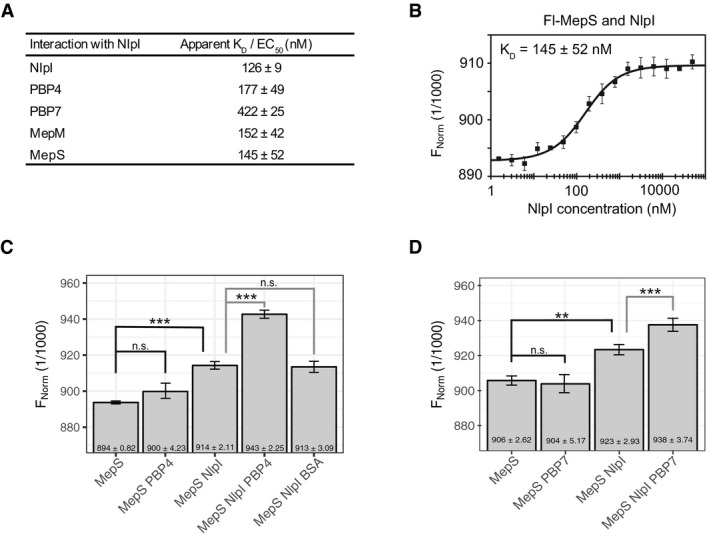
- A
Dissociation constants for interactions between NlpI with MepM, MepS, PBP4, PBP7 as determined by microscale thermophoresis (MST). The values are mean ± SD of three independent experiments. The corresponding MST binding curves are shown in Appendix Fig S2B.
- B
MepS‐NlpI interaction by MST as an example plot for Fig 2A. The same plot is also shown in Appendix Fig S2B. MST curve plotted is the mean data ± SD of three independent experiments. Fl, fluorescently labelled; FNorm, normalized fluorescence.
- C, D
NlpI has different binding sites for MepS and PBP4, and MepS and PBP7 as shown by the ability of labelled MepS to bind pre‐formed NlpI‐PBP4 (C) and NlpI‐PBP7 (D) complexes by a fixed concentration MST assay. Values are mean ± SD of 3–6 independent experiments. To calculate significance, the data were fit using a linear model. Calculated means were compared using Tukey's HSD test, resulting in P‐values corrected for multiple testing. Relevant P‐values are highlighted directly in the figure (*< 0.05; **< 0.01, ***< 0.001), and all P‐values can be found in Table EV7.

HPLC‐based PG digestion assay representing EPase activity. The graph shows the relative percentage of the muropeptide TetraTetra present at the end of the incubation period for each protein as described in Materials and Methods. MepM and PBP4 were incubated with sacculi, whilst MepS and PBP7 were incubated with soluble muropeptides, both from E. coli MC1061, respectively. Values are mean ± SD of three independent experiments. Representative chromatograms are shown in Appendix Fig S4. To calculate significance, the data were fit using a linear model. Calculated means were compared using Tukey's HSD test, resulting in P‐values corrected for multiple testing. Relevant P‐values are highlighted directly in the figure (*< 0.05; **< 0.01, ***< 0.001), and all P‐values can be found in Table EV8.
Genetic interactions of nlpI with EPase genes. Strains were arrayed using a Rotor HDA replicator on Lennox LB agar plates and incubated for 12 h at 37°C. Each plate contained 384 colonies, 96 from the wild type, single mutants and double mutants. An example of a 384‐well plate is shown. Double mutants were made twice, swapping the resistance markers to the two single mutants. Colony integral opacity was quantified as a fitness readout, using the image analysis software Iris (Kritikos et al, 2017). Bar plots show the averaged values of 2 biological experiments, each having 96 technical replicates (i = 2, n = 192). The error bars represent the 95% confidence interval. Full results can be found in Table EV5.
nlpI deletion changes the morphology of EPase‐mutant strains. The graph shows the cell width of single‐ and double‐deletion strains (800 < n < 2,000 cells). The box has a medium between 25 and 75%. The whiskers with the upper and lower vertical line indicating the 95 and 5%. The dots are individual points outside the 5 and 95% range. Above the graph are representative images of cells lacking MepS or PBP4 in combination with a deletion of NlpI. The same images for control and NlpI mutant strains have been reused in Fig 4C. The scale bar equals 2 μm. Gene encoding protein legend: nlpI encodes NlpI, dacB encodes PBP4, pbpG encodes PBP7, mepM encodes MepM, meps encodes MepS. Cell length of mutants is displayed in Appendix Fig S12c.
Inducible mepS expression system (pBAD30) strongly overproduces MepS. Strains were grown in LB at 30°C, and cells were collected at OD600≈0.4. The level of MepS contained in the membrane fraction was detected using purified anti‐MepS antibody.
Visualization of the effect of MepS absence or its overexpression on cell width by phase‐contrast microscopy. Cultures were grown in LB at 30°C, and aliquots of culture were taken at OD600≈0.1. The scale bar equals 5 μm.
MepS level modulates cell width. The graph shows the distribution of mean cell width for each cell, with n corresponding to the number of cells measured for each strain and the median width for the population being indicated by a dotted line and referred to as w.
Relative fitness of ΔnlpI, ΔmepS and ΔnlpIΔmepS mutants. Strains were arrayed using a Rotor HDA replicator on Lennox LB agar plates supplemented 10% sucrose, or LB agar plates containing 0 mM or 500 mM NaCl. Plates were incubated for 12 h at 37°C. Each plate contained 384 colonies, 96 from the wild type, single mutants and double mutants. Fitness ratios, bar plots and error bars were calculated/made as in (B). Full results can be found in Table EV5.
Cells of wild type (WT), ΔnlpI, ΔmepS and ΔnlpIΔmepS containing multicopy plasmids with lacZ were grown onto CPRG indicator agar to assay envelope integrity. CPRG (yellow) cannot penetrate intact Gram‐negative envelopes. Its conversion by intracellular β‐galactosidase to CPR (red) indicates loss of envelope integrity.
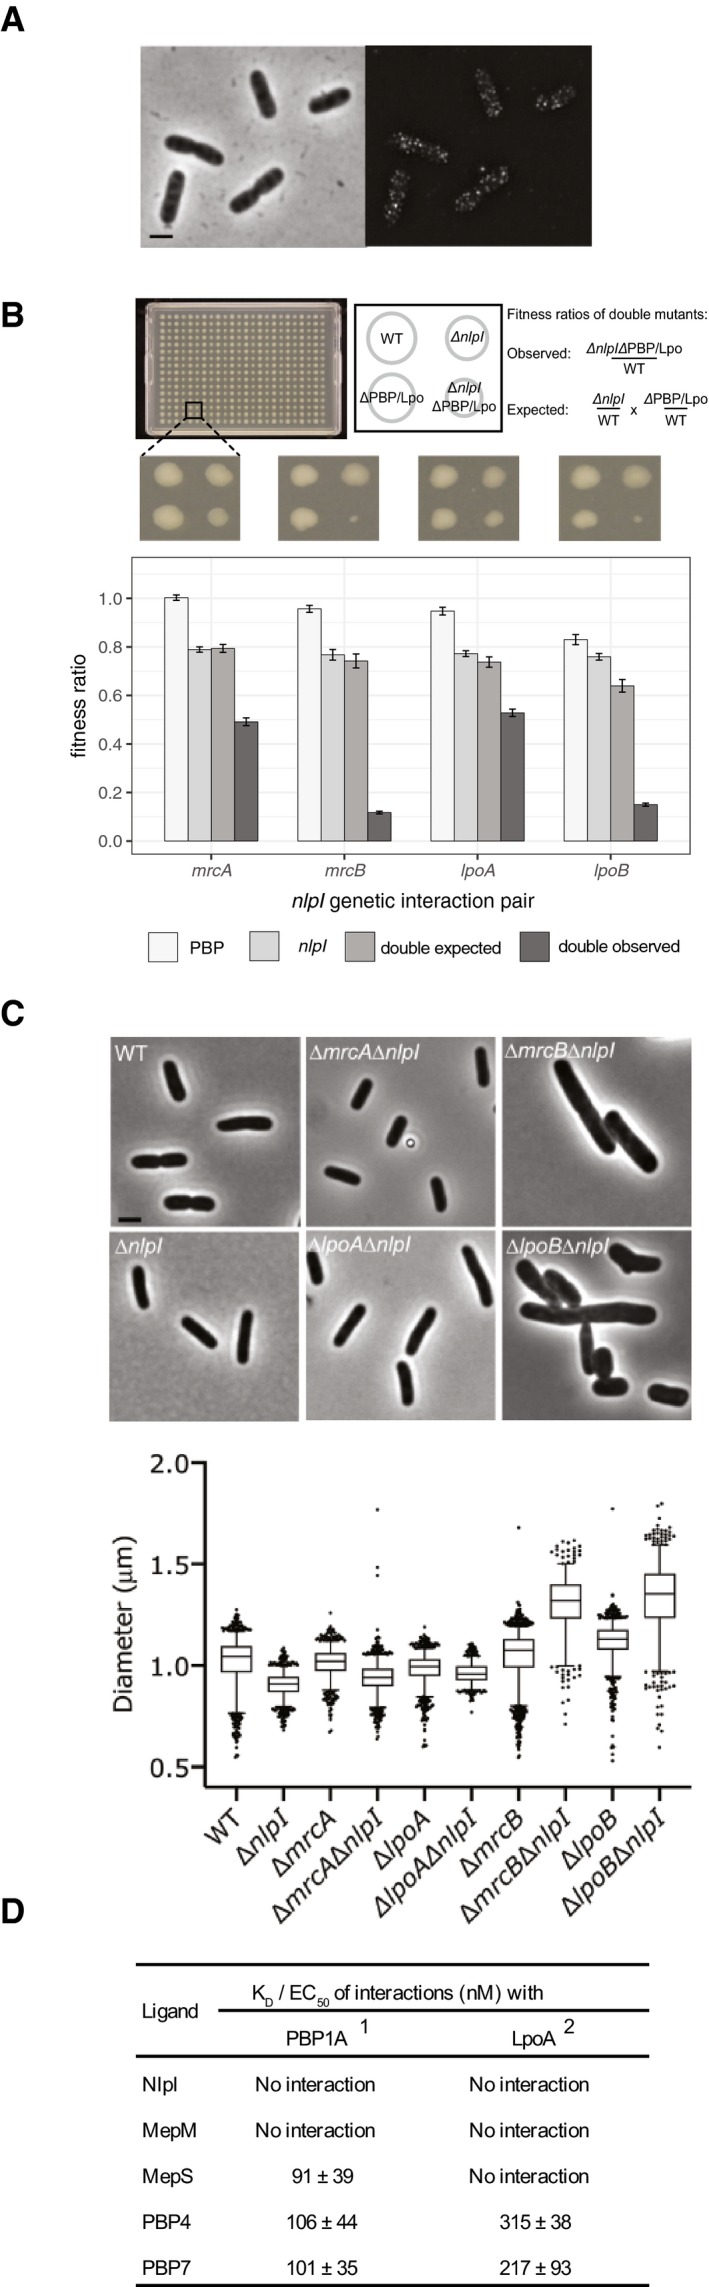
Phase‐contrast image and corresponding fluorescence SIM image of BW25113 cells that have been grown in LB at 37°C and immunolabelled with specific antibodies against NlpI. Scale bar equals 2 μm. See Appendix Fig S5 for further details.
Genetic interactions of NlpI with PG machineries. Strains were arrayed and assessed as in Fig 3b. An example of a 384 plate is shown. Bar plots show the averaged values of 2 experiments (i = 2, n = 192). Error bars denote the 95% confidence interval of the mean. Full results can be found in Table EV5.
NlpI deletion exacerbates the morphological defects of the PBP1B/LpoB‐mutant strains. The graph shows the cell width of single‐ and double‐deletion strains (800 < n < 2,000 cells). The box has a medium between 25 and 75%. The whiskers with the upper and lower vertical line indicating the 95 and 5%. The dots are individual points outside the 5 and 95% range. Representative images of the strains are shown above the graph. The same images for control and NlpI mutant strains have been reused in Fig 3C. The scale bar equals 2 μm. Gene encoding protein legend: nlpI encodes NlpI, mrcA encodes PBP1A, lpoA encodes LpoA, mrcB encodes PBP1B, lpoB encodes LpoB. Cell length of mutants is displayed in Appendix Fig S12D.
Dissociation constants for interactions between PBP1A and LpoA with NlpI, MepM, MepS, PBP4 and PBP7 as determined by MST. The values are mean ± SD of three independent experiments. 1PBP1A was used as fluorescently labelled protein in all assays. 2LpoA was used as unlabelled ligand in all combinations, except with MepM and PBP4. Binding curves are shown in Appendix Fig S6.
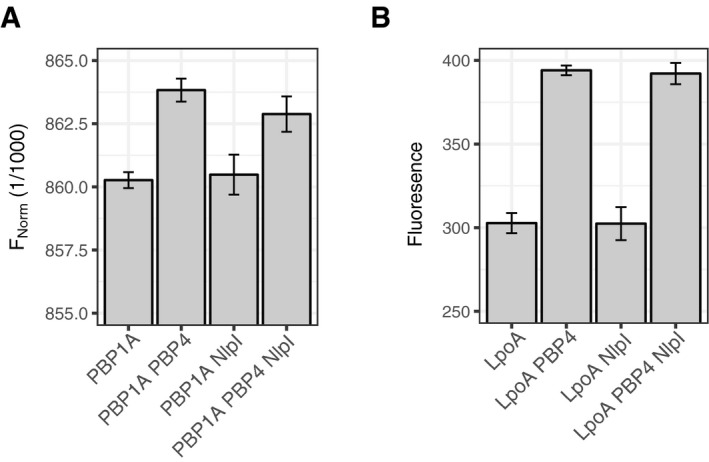
- A, B
PBP4 has different interaction sites for PBP1A/LpoA and NlpI as shown by a single concentration MST assay. Plots show the FNorm or fluorescence values of fluorescently labelled PBP1A or LpoA with or without PBP4, NlpI or PBP4‐NlpI. Values are mean ± SD of three independent experiments.
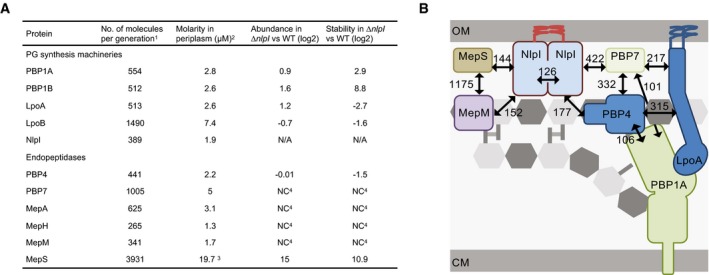
Estimated number of molecules and molarity of PBP1a/LpoA and EPases. 1Numbers obtained by ribosomal profiling in rich growth medium (Li et al, 2014). 2Concentration of monomer. 3Decreases in the presence of NlpI (Singh et al, 2015). 4“no change detected”. The periplasmic concentrations of proteins were estimated for a cell with periplasmic volume of 3.33 × 10⁻¹⁶ l, where 1 molecule corresponds to 5 nM.
Hypothetical model of NlpI scaffolding endopeptidases during cell elongation. Black arrows indicate interacting proteins with numbers indicating apparent EC50/KD values. OM, outer membrane; CM, cytoplasmic membrane. MepS–PBP1A interaction is not represented due to illustrative restrictions.
References
-
- Banzhaf M, van den Berg van Saparoea B, Terrak M, Fraipont C, Egan A, Philippe J, Zapun A, Breukink E, Nguyen‐Disteche M, den Blaauwen T et al (2012) Cooperativity of peptidoglycan synthases active in bacterial cell elongation. Mol Microbiol 85: 179–194 - PubMed
-
- Bertsche U, Breukink E, Kast T, Vollmer W (2005) In vitro murein peptidoglycan synthesis by dimers of the bifunctional transglycosylase‐transpeptidase PBP1B from Escherichia coli . J Biol Chem 280: 38096–38101 - PubMed
Publication types
MeSH terms
Substances
Grants and funding
- Volkswagen Foundation (VolkswagenStiftung)/International
- 664726/European Molecular Biology Laboratory (EMBL)/International
- 679980/EC|H2020|H2020 Priority Excellent Science|H2020 European Research Council (ERC)/International
- RGS\R1\191041/Royal Society/International
- MR/N501840/1/MRC_/Medical Research Council/United Kingdom
LinkOut - more resources
Full Text Sources
Other Literature Sources
Molecular Biology Databases
Research Materials
