. 2020 Jul;72(7):1170-1183.
doi: 10.1002/art.41215. Epub 2020 May 31.

Muscle Weakness in Myositis: MicroRNA-Mediated Dystrophin Reduction in a Myositis Mouse Model and Human Muscle Biopsies

Affiliations

Muscle Weakness in Myositis: MicroRNA-Mediated Dystrophin Reduction in a Myositis Mouse Model and Human Muscle Biopsies

Travis B Kinder et al. Arthritis Rheumatol. 2020 Jul.

Abstract

Objective: Muscle inflammation is a feature in myositis and Duchenne muscular dystrophy (DMD). Autoimmune mechanisms are thought to contribute to muscle weakness in patients with myositis. However, a lack of correlation between the extent of inflammatory cell infiltration and muscle weakness indicates that nonimmune pathologic mechanisms may play a role. The present study focused on 2 microRNA (miRNA) sets previously identified as being elevated in the muscle of patients with DMD-an "inflammatory" miRNA set that is dampened with glucocorticoids, and a "dystrophin-targeting" miRNA set that inhibits dystrophin translation-to test the hypothesis that these miRNAs are similarly dysregulated in the muscle of patients with myositis, and could contribute to muscle weakness and disease severity.

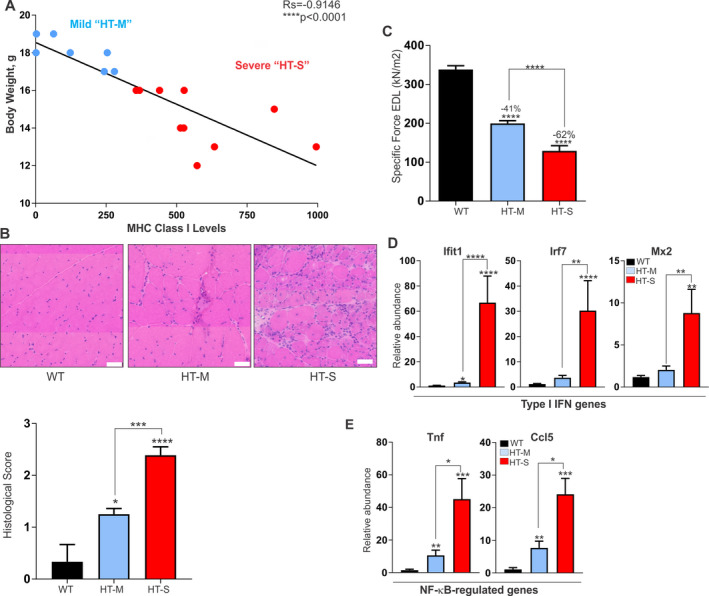
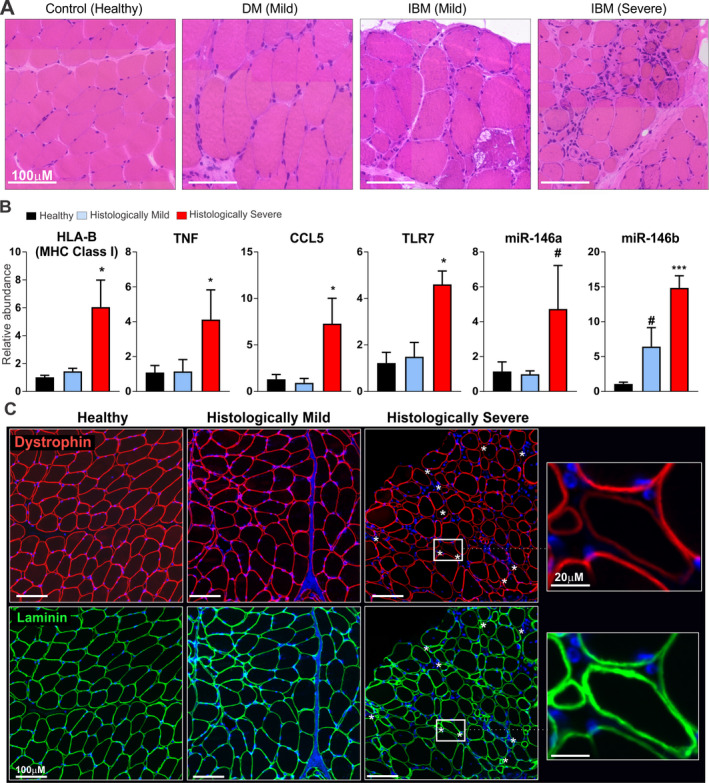
Methods: A major histocompatibility complex class I-transgenic mouse model of myositis was utilized to study gene and miRNA expression and histologic features in the muscle tissue, with the findings validated in human muscle biopsy tissue from 6 patients with myositis. Mice were classified as having mild or severe myositis based on transgene expression, body weight, histologic disease severity, and muscle strength/weakness.

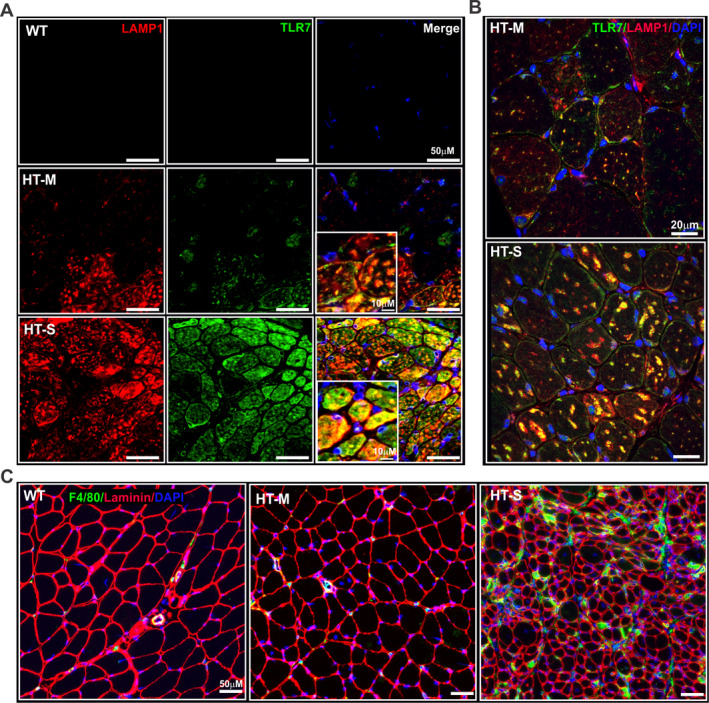
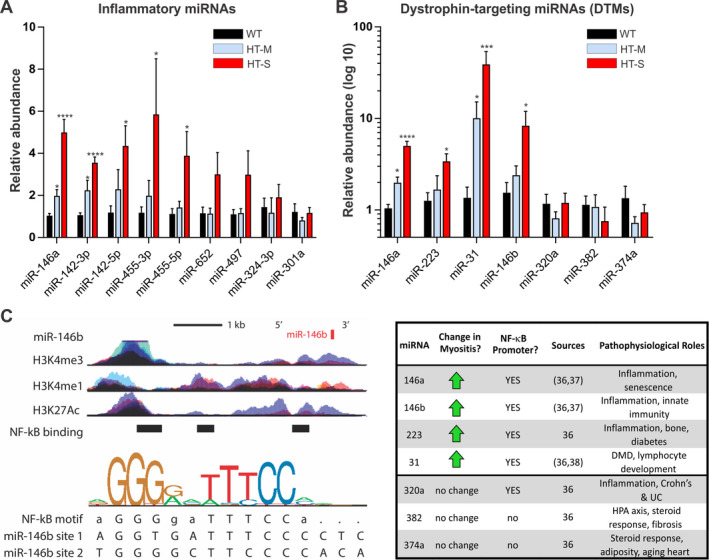
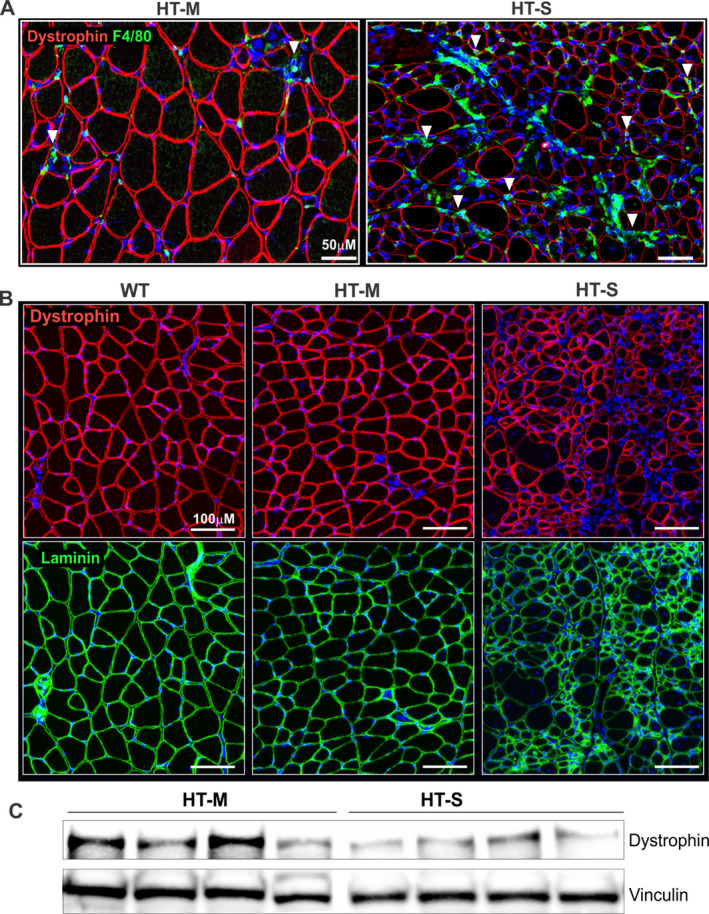
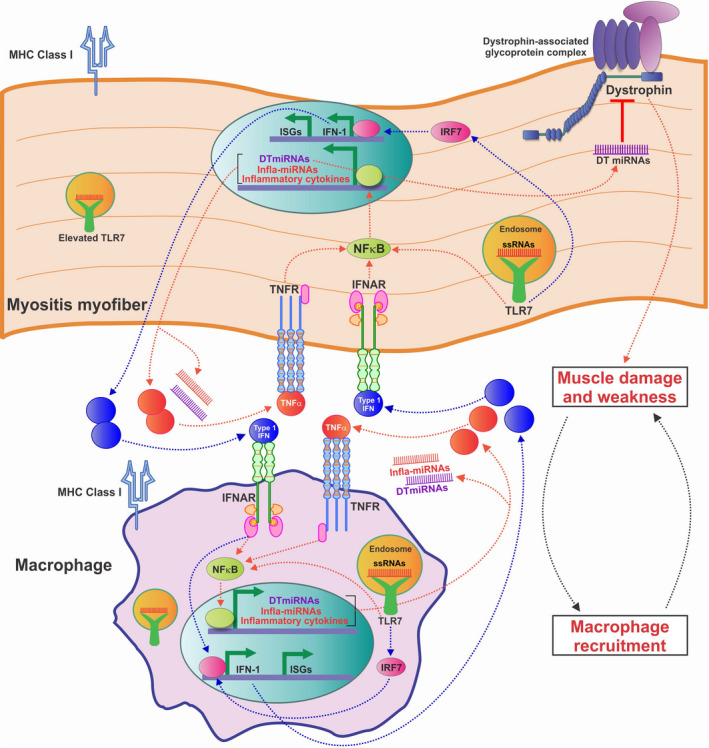
Results: In mice with severe myositis, muscle tissue showed mononuclear cell infiltration along with elevated expression of type I interferon and NF-κB-regulated genes, including Tlr7 (3.8-fold increase, P < 0.05). Furthermore, mice with severe myositis showed elevated expression of inflammatory miRNAs (miR-146a, miR-142-3p, miR-142-5p, miR-455-3p, and miR-455-5p; ~3-40-fold increase, P < 0.05) and dystrophin-targeting miRNAs (miR-146a, miR-146b, miR-31, and miR-223; ~3-38-fold increase, P < 0.05). Bioinformatics analyses of chromatin immunoprecipitation sequencing (ChIP-seq) data identified at least one NF-κB consensus element within the promoter/enhancer regions of these miRNAs. Western blotting and immunofluorescence analyses of the muscle tissue from mice with severe myositis demonstrated reduced levels of dystrophin. In addition, elevated levels of NF-κB-regulated genes, TLR7, and miRNAs along with reduced dystrophin levels were observed in muscle biopsy tissue from patients with histologically severe myositis.

Conclusion: These data demonstrate that an acquired dystrophin deficiency may occur through NF-κB-regulated miRNAs in myositis, thereby suggesting a unifying theme in which muscle injury, inflammation, and weakness are perpetuated both in myositis and in DMD.


Figures

Figure 1
Figure 1
Variable disease severity in the HT mouse model of myositis. A, Classification system used for grouping HT mice according to the severity of myositis, based on body weight plotted against the extent of major histocompatibility complex (MHC) class I transgene expression. HT‐M = mice with mild myositis, body weight of >16 grams, and MHC class I expression of ≤300‐fold relative to wild‐type (WT) mice. HT‐S = mice with severe myositis, body weight of <16 grams, and MHC class I expression of >300‐fold relative to WT mice. Correlations were determined using Spearman's correlation coefficients. B, Representative images of histologic staining with hematoxylin and eosin (top) and histologic scores of staining (bottom) of the quadriceps muscle from WT mice and mice in the mild or severe myositis groups (n = 5 WT, n = 7 HT‐M, and n = 10 HT‐S). Bars = 50 μM. C, Isolated measurements of specific force contractions of the extensor digitorum longus (EDL) muscle in each group of mice (n ≥ 10 per group). D and E, Type I interferon (IFN) gene expression levels (genes for IFN‐induced protein with tetratricopeptide repeats 1 [Ifit], IFN regulatory factor 7 [Irf7], and MX dynamin like GTPase 2 [Mx2]) (D) and NF‐κB–induced gene expression (genes for tumor necrosis factor [Tnf] and C–C motif chemokine ligand 5 gene [Ccl5]) (E) in the quadriceps muscle of WT, HT‐M, and HT‐S mice (n = 5 WT, n = 7 HT‐M, and n = 10 HT‐S). Data were normalized to the values for 18S ribosomal RNA. Results in BE are the mean ± SEM. * = P < 0.05; ** = P < 0.01; *** = P < 0.001; **** = P < 0.0001 for the indicated comparisons or versus WT mice, by analysis of variance.
Figure 2
Figure 2
Increased Toll‐like receptor 7 (TLR‐7) staining and macrophage infiltration in the muscle of mice with severe myositis. A and B, Representative images of the quadriceps muscle of a WT mouse, mouse with mild myositits, and mouse with severe myositis, immunolabeled with an antibody against TLR‐7 (green) and lysosome‐associated membrane protein 1 (LAMP‐1) (red). DAPI counterstaining was used to visualize nuclei (blue). Images in A were obtained with a VS‐120 scanning microscope at 20× magnification, and images in B are from a second set of immunostained muscle tissue sections visualized using confocal microscopy. In both A and B, colocalization of TLR‐7 and LAMP‐1, a marker of late endosomes/early lysosomes, is an indication that TLR‐7 is localized to the endosomes and is in an activated state. C, Muscle tissue from HT‐M and HT‐S mouse quadriceps stained with an antibody against F4/80, which recognizes a glycoprotein expressed by murine macrophages (green), and with an antibody against laminin (red), which confirms the integrity of the muscle tissue, with DAPI counterstaining of the nuclei (blue). See Figure 1 for other definitions.
Figure 3
Figure 3
Expression of inflammatory microRNAs (miRNAs) and dystrophin‐targeting miRNAs (DTMs) in the quadriceps muscle of mice classified as having severe or mild myositis disease. A and B, The relative abundance of inflammatory miRNAs (A) and DTMs (B) was analyzed by quantitative reverse transcription–polymerase chain reaction in the quadriceps muscle from each group of mice. Data were normalized to the values for sno202. Results are the mean ± SEM (n = 5 WT, n = 6 HT‐M, and n = 8 HT‐S). * = P < 0.05; *** = P < 0.001; **** = P < 0.0001 versus WT mice, by analysis of variance. C, Transcription factor (NF‐κB) binding sites and histone (H3) modifications that mark regulatory regions were examined using chromatin immunoprecipitation sequencing data from ENCODE. Binding motifs for each transcription factor were identified through the Factorbook repository. Left Top, Schematic diagram of the gene locus for miR‐146b, illustrating the binding sites of 3 neighboring DNA loci bound directly by NF‐κB. Epigenetic modification maps show the location of histone modifications associated with active promoters (H3K4me3) and poised/active enhancers (H3K4me1/H3K27Ac). Left Bottom, Sequence logo pictogram of the base frequency at NF‐κB binding sites with the consensus NF‐κB motif. Two representative NF‐κB binding site sequences near miR‐146b are also shown. Right, Summary of promoter analysis and literature data for all DTMs, indicating each miRNA and known factors associated with its transcriptional regulation. DMD = Duchenne muscular dystrophy; UC = ulcerative colitis; HPA = hypothalamic–pituitary–adrenal axis (see Figure 1 for other definitions).
Figure 4
Figure 4
Reduced dystrophin levels in mice with severe myositis. A, Representative images of the quadriceps muscle of mice in the mild or severe myositis groups, immunolabeled with an antibody against dystrophin (red) and macrophage staining (F4/80; green). Arrowheads indicate regions with high macrophage infiltration (F4/80; green) where neighboring myofibers are observed to show diminished dystrophin levels (red). B, Representative images of the quadriceps muscle of mice in the mild or severe myositis groups compared to WT mice, using immunolabeling with an antibody against dystrophin (red). An anti‐laminin antibody (green) was used as a control to show sarcolemnal integrity of the muscle tissue. DAPI counterstaining was used to visualize nuclei (blue). C, Western blotting for dystrophin, using protein extracts from the tibialis anterior muscle of mice in the mild or severe myositis groups (n = 4 per group). Vinculin was used as a loading control and was run on the same Western blot. See Figure 1 for definitions.
Figure 5
Figure 5
Elevations in major histocompatibility complex (MHC) class I expression, NF‐κB–driven gene expression, and dystrophin‐targeting microRNAs (miRNAs) and reduction in dystrophin levels in histologically severe human muscle biopsy tissue. A, Representative images of hematoxylin and eosin–stained human muscle biopsy tissue obtained from a healthy control, a patient with dermatomyositis (DM) classified as having histologically mild muscle disease, and 2 patients with inclusion body myositis (IBM), of whom 1 was classified as having histologically mild muscle disease and 1 as having histologically severe muscle disease. B, Gene and miRNA expression levels in human muscle biopsy tissue from each group (n = 3 per group). Data for mRNAs were normalized to the values for Hprt, and data for miRNAs were normalized to the values for RNU48. # = P < 0.10; * = P < 0.05; *** = P < 0.001 versus healthy controls, by Student's t‐test. C, Representative images of human muscle biopsy tissue from a healthy control, a patient with histologically mild muscle disease, and a patient with histologically severe muscle disease, using immunolabeling with an antibody against dystrophin (red). An anti‐laminin antibody (green) was used as a control to show sarcolemnal integrity of the muscle tissue. Asterisks in the histologically severe muscle highlight muscle fibers in which laminin staining is uniform, but dystrophin staining is either reduced, discontinuous, or absent. DAPI counterstaining was used to visualize nuclei (blue). TNF = human gene for tumor necrosis factor; TLR7 = human gene for Toll‐like receptor 7.
Figure 6
Figure 6
Model of the hypothesized self‐amplifying feedback loop between macrophages and myofibers in myositis. Progression of myositis is driven by myofibers that adopt a more immune‐like state, as evidenced by inappropriate expression of Toll‐like receptor 7 (TLR‐7) and major histocompatibility complex (MHC) class I. TLR‐7 activates NF‐κB–driven gene expression, eliciting the release of inflammatory cytokines and promoting macrophage recruitment. Activation of NF‐κB–driven genes such as tumor necrosis factor (TNF) and interferon‐α/β (IFN) genes leads to a feed–forward loop in which these cytokines activate their receptors (TNFR and IFNAR, respectively), thereby enhancing NF‐κB activation. TLR‐7 additionally activates the IFN regulatory factor 7 gene (IRF7), driving production of IFN‐1, which in turn activates IFNAR and expression of type I IFN–stimulated genes (ISGs), which includes IRF7. NF‐κB also triggers expression of inflammatory and dystrophin‐targeting microRNAs (miRNAs) (infla‐miRNA and DT‐miRNA, respectively), leading to reduction in the levels of dystrophin and muscle weakness, which in turn causes increased release of proinflammatory signals. All of these components contribute to a positive, self‐amplifying inflammatory feedback loop. ssRNAs = single‐stranded RNAs.

Similar articles

Cited by

References

    1. Meyer A, Meyer N, Schaeffer M, Gottenberg JE, Geny B, Sibilia J. Incidence and prevalence of inflammatory myopathies: a systematic review. Rheumatology (Oxford) 2015;54:50–63. - PubMed
    1. Li CK, Knopp P, Moncrieffe H, Singh B, Shah S, Nagaraju K, et al. Overexpression of MHC class I heavy chain protein in young skeletal muscle leads to severe myositis: implications for juvenile myositis. Am J Pathol 2009;175:1030–40. - PMC - PubMed
    1. Nagaraju K, Casciola‐Rosen L, Rosen A, Thompson C, Loeffler L, Parker T, et al. The inhibition of apoptosis in myositis and in normal muscle cells. J Immunol 2000;164:5459–65. - PubMed
    1. Dalakas MC. Inflammatory muscle diseases. N Engl J Med 2015;373:393–4. - PubMed
    1. Karpati G, Pouliot Y, Carpenter S. Expression of immunoreactive major histocompatibility complex products in human skeletal muscles. Ann Neurol 1988;23:64–72. - PubMed

Publication types

MeSH terms