. 2017;135(1):155-182.
doi: 10.1007/s10533-017-0367-0. Epub 2017 Sep 7.

Comparing benthic biogeochemistry at a sandy and a muddy site in the Celtic Sea using a model and observations

Affiliations

Comparing benthic biogeochemistry at a sandy and a muddy site in the Celtic Sea using a model and observations

J N Aldridge et al. Biogeochemistry. 2017.

Abstract

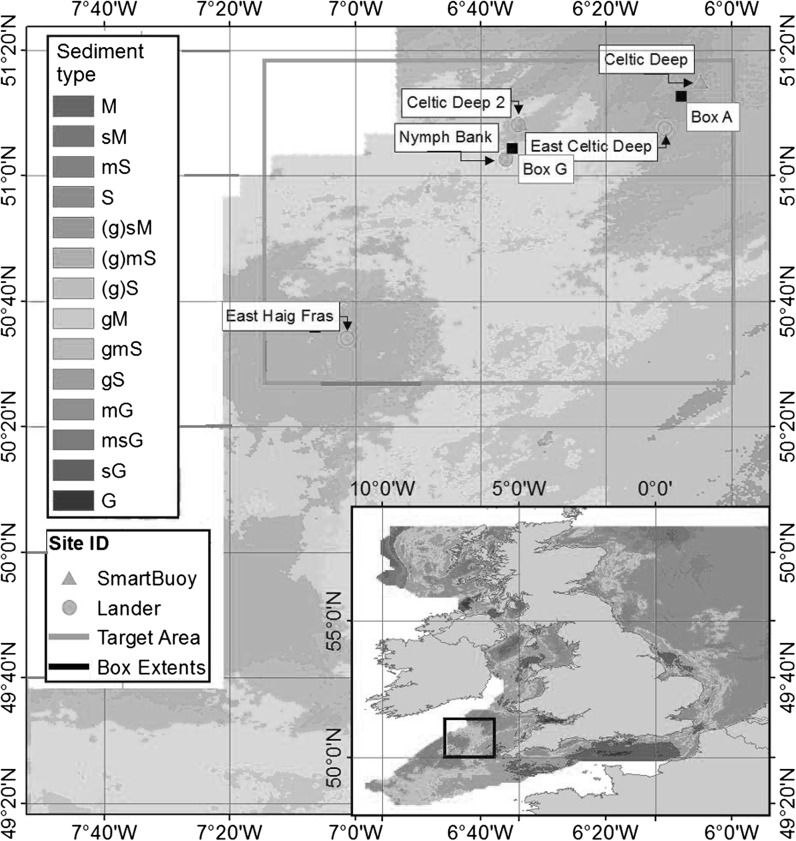
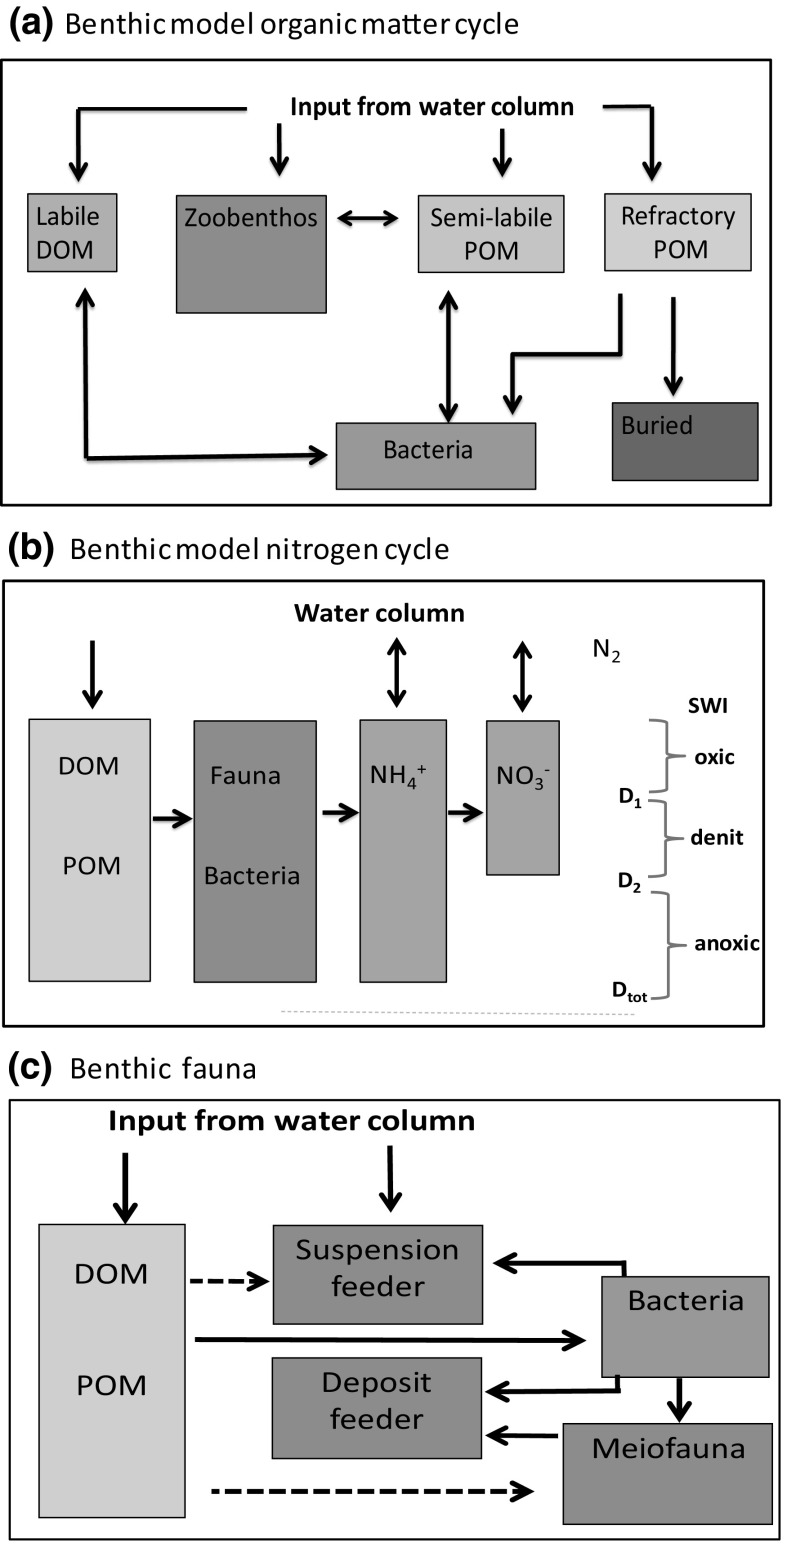
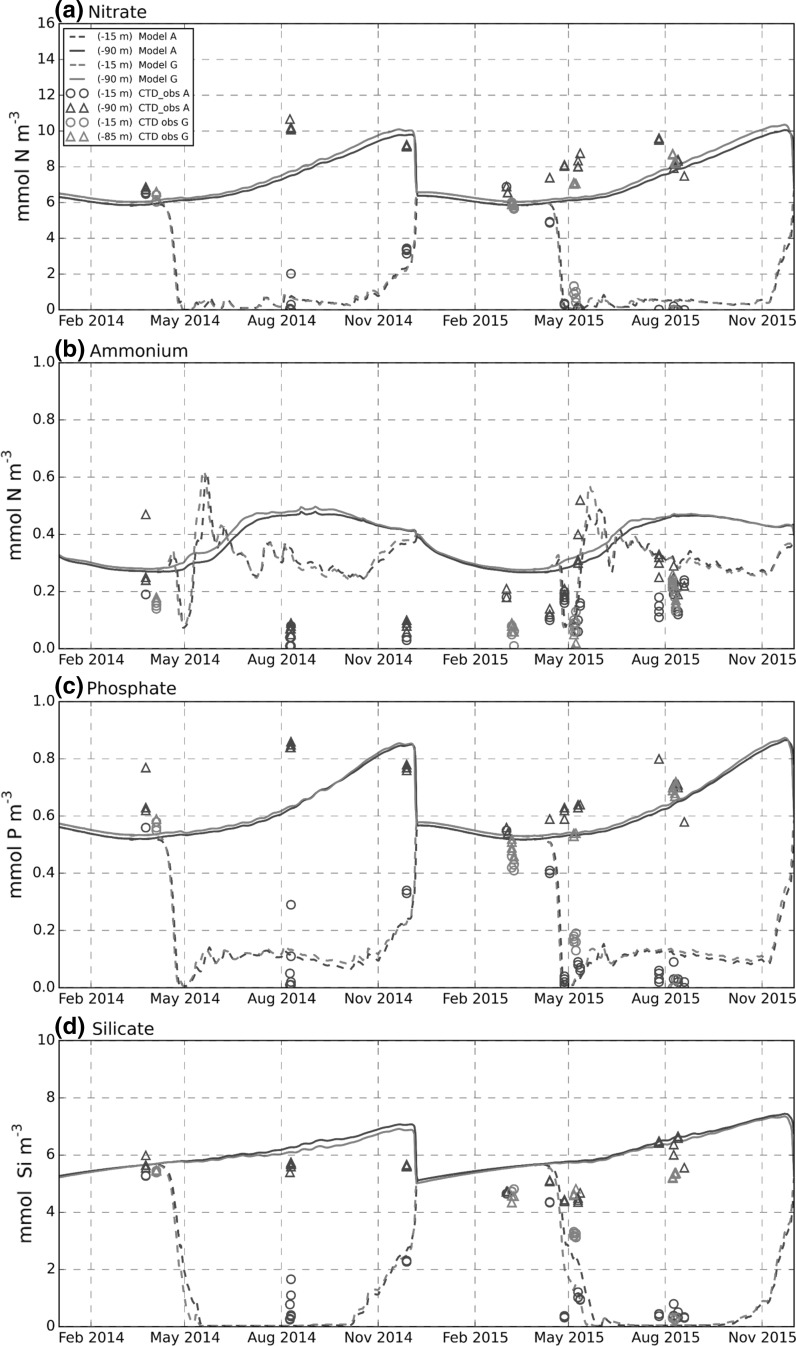
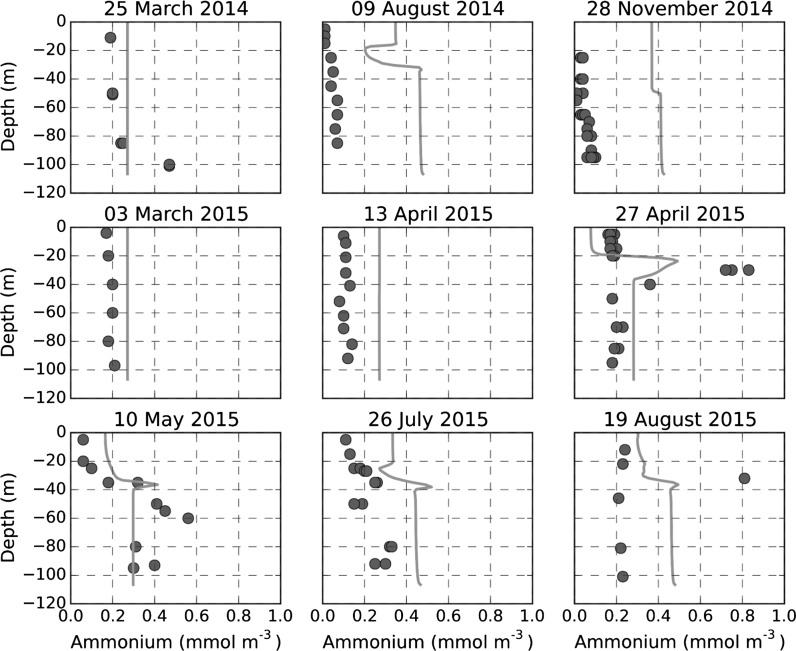
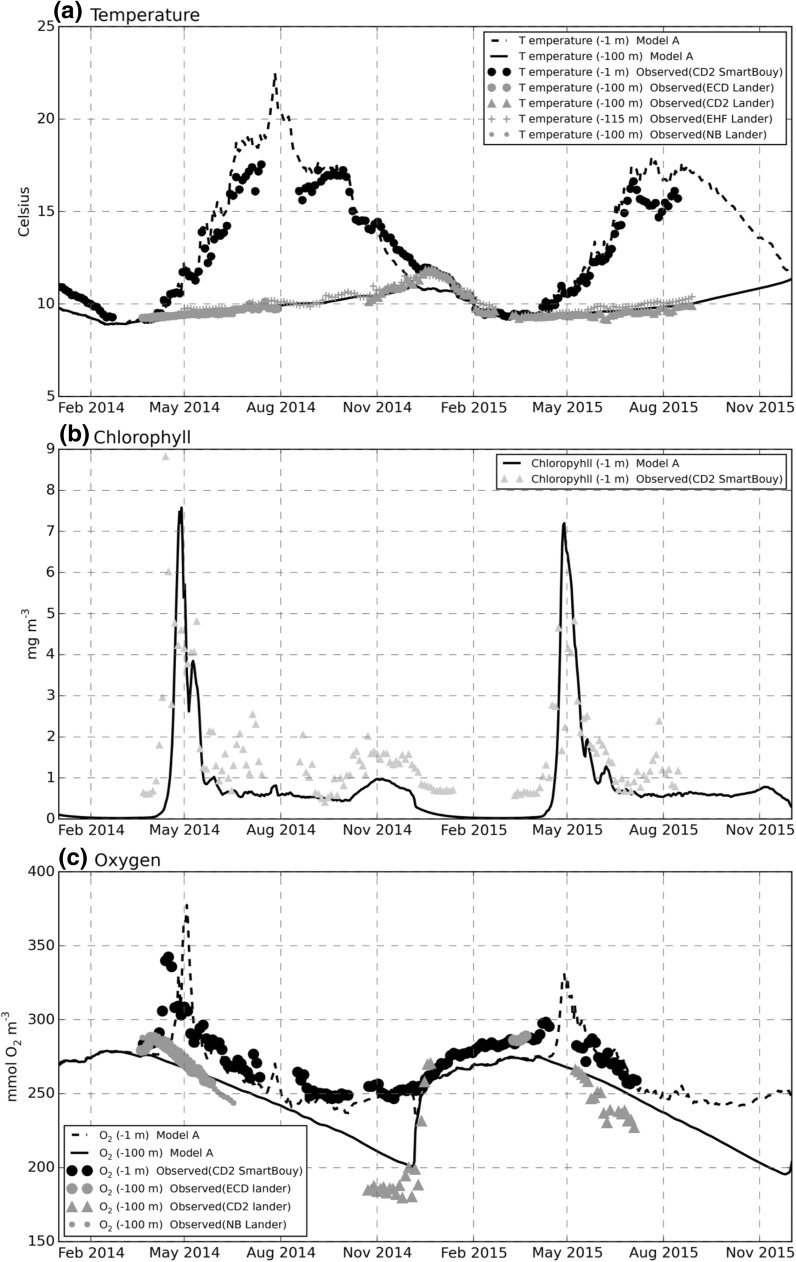
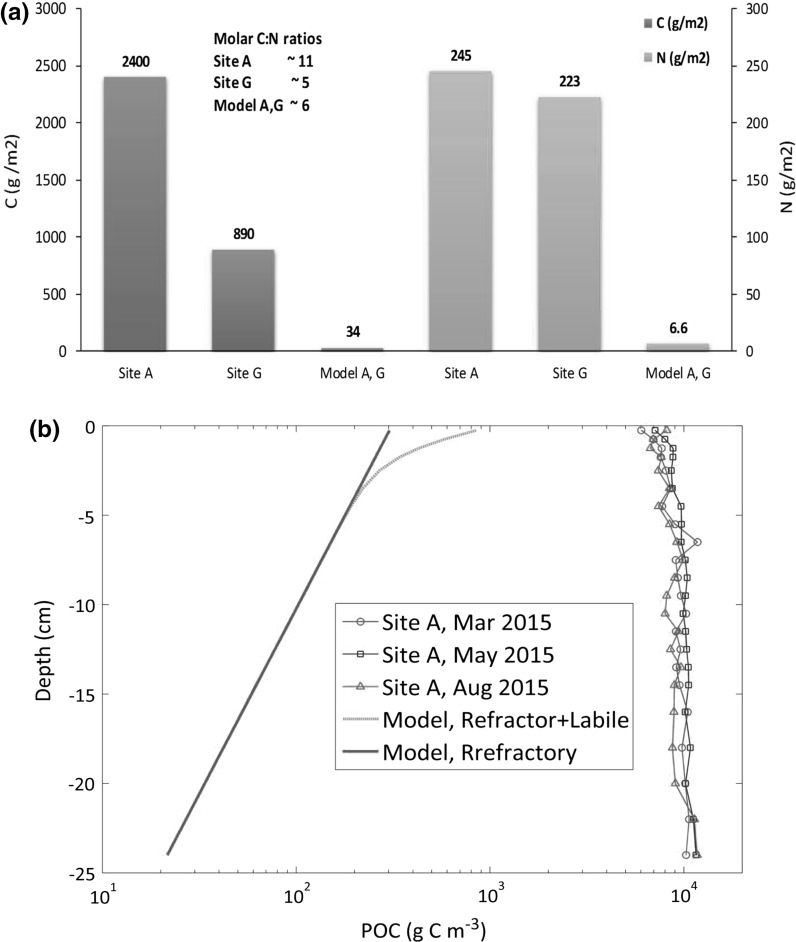
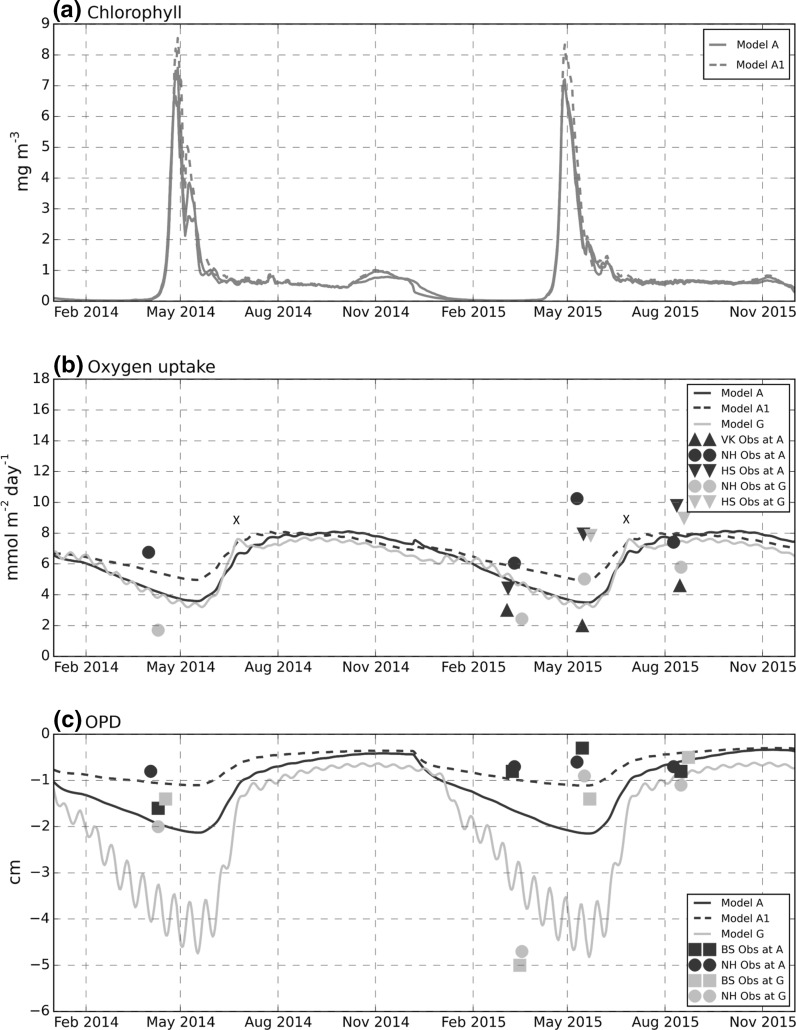
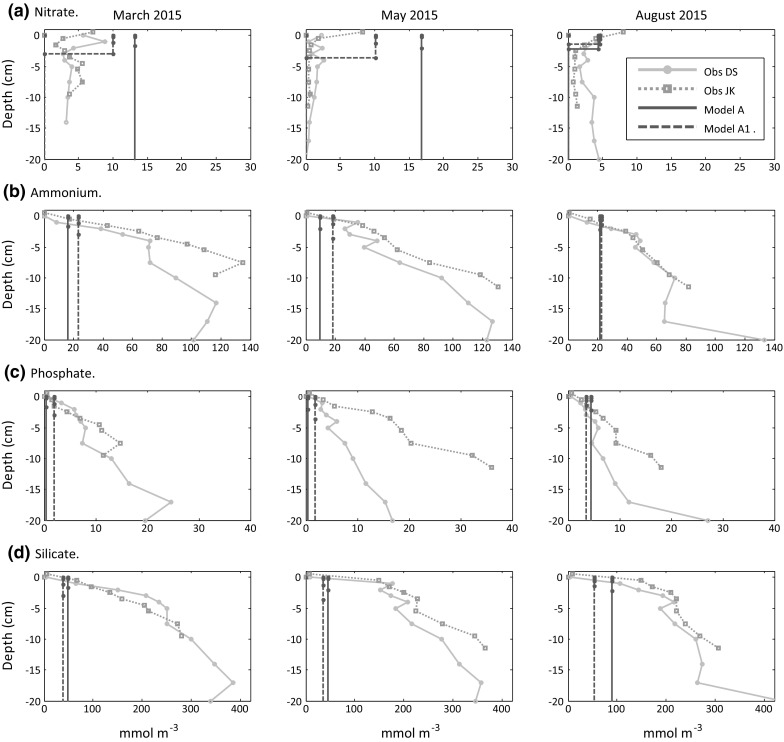
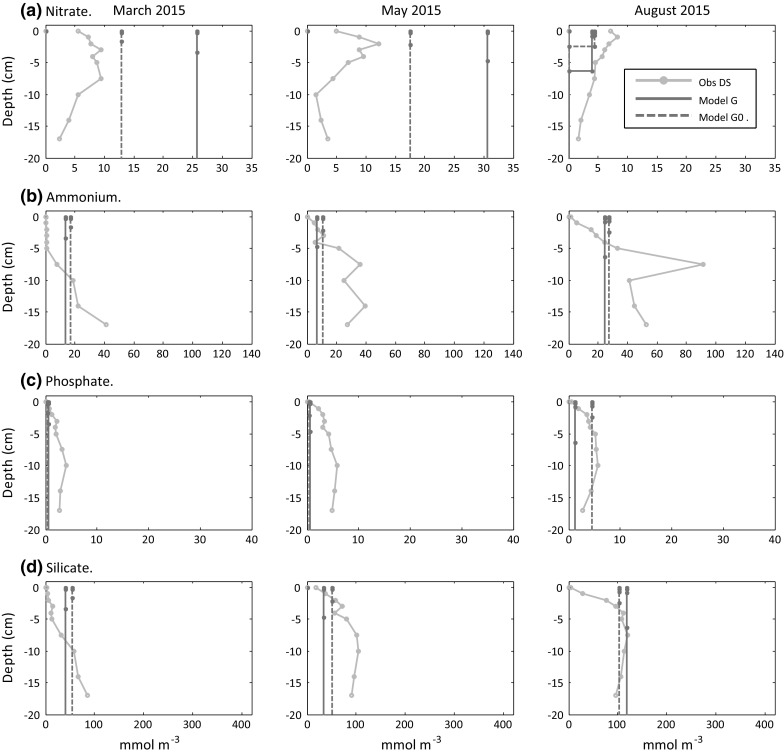
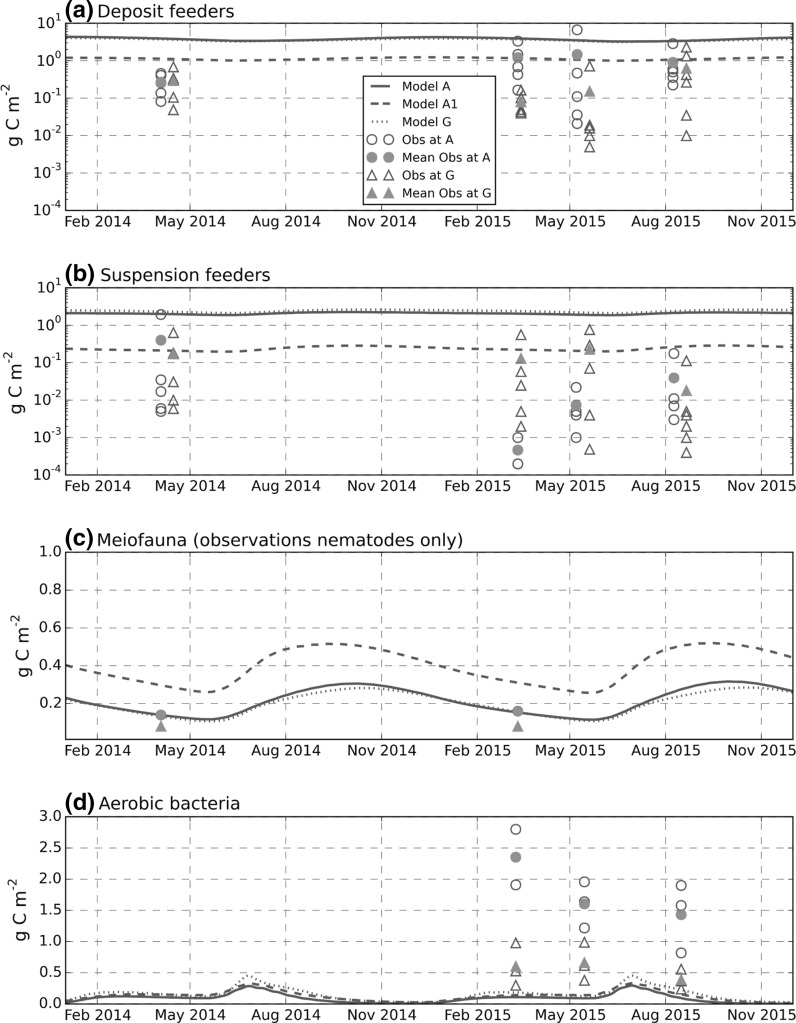
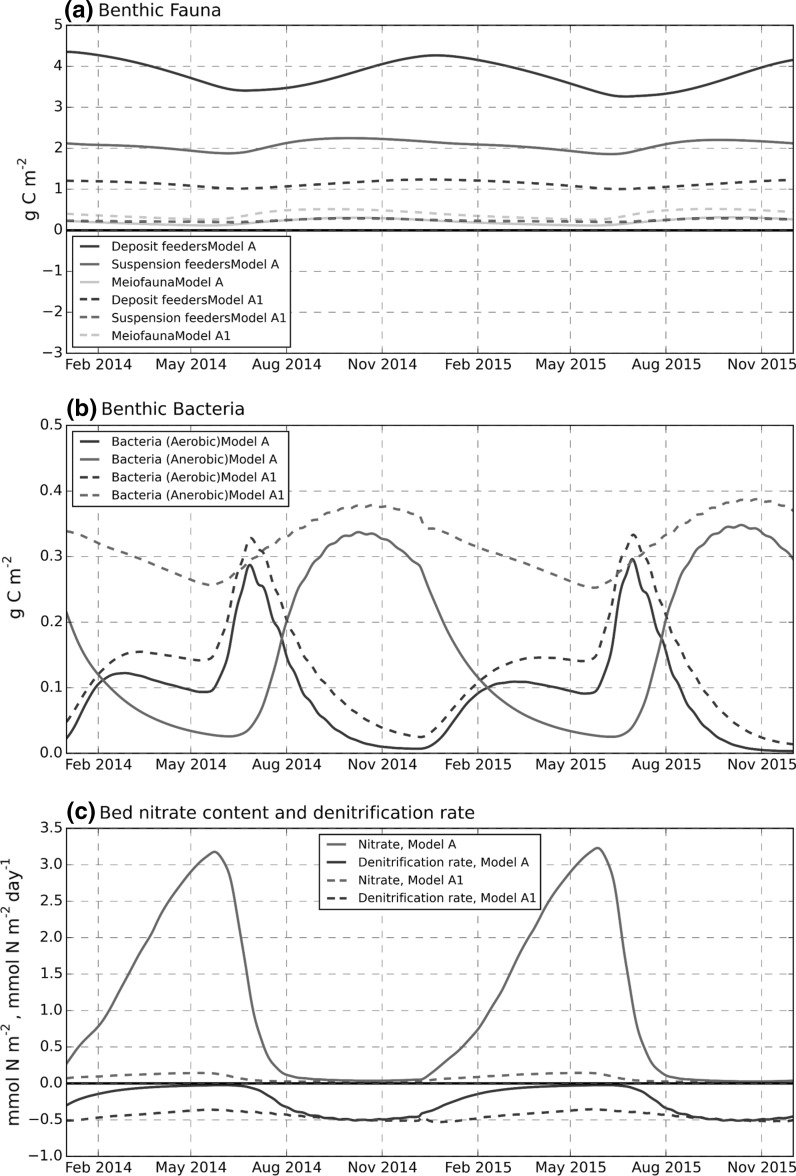
Results from a 1D setup of the European Regional Seas Ecosystem Model (ERSEM) biogeochemical model were compared with new observations collected under the UK Shelf Seas Biogeochemistry (SSB) programme to assess model performance and clarify elements of shelf-sea benthic biogeochemistry and carbon cycling. Observations from two contrasting sites (muddy and sandy) in the Celtic Sea in otherwise comparable hydrographic conditions were considered, with the focus on the benthic system. A standard model parameterisation with site-specific light and nutrient adjustments was used, along with modifications to the within-seabed diffusivity to accommodate the modelling of permeable (sandy) sediments. Differences between modelled and observed quantities of organic carbon in the bed were interpreted to suggest that a large part (>90%) of the observed benthic organic carbon is biologically relatively inactive. Evidence on the rate at which this inactive fraction is produced will constitute important information to quantify offshore carbon sequestration. Total oxygen uptake and oxic layer depths were within the range of the measured values. Modelled depth average pore water concentrations of ammonium, phosphate and silicate were typically 5-20% of observed values at the muddy site due to an underestimate of concentrations associated with the deeper sediment layers. Model agreement for these nutrients was better at the sandy site, which had lower pore water concentrations, especially deeper in the sediment. Comparison of pore water nitrate with observations had added uncertainty, as the results from process studies at the sites indicated the dominance of the anammox pathway for nitrogen removal; a pathway that is not included in the model. Macrofaunal biomasses were overestimated, although a model run with increased macrofaunal background mortality rates decreased macrofaunal biomass and improved agreement with observations. The decrease in macrofaunal biomass was compensated by an increase in meiofaunal biomass such that total oxygen demand remained within the observed range. The permeable sediment modification reproduced some of the observed behaviour of oxygen penetration depth at the sandy site. It is suggested that future development in ERSEM benthic modelling should focus on: (1) mixing and degradation rates of benthic organic matter, (2) validation of benthic faunal biomass against large scale spatial datasets, (3) incorporation of anammox in the benthic nitrogen cycle, and (4) further developments to represent permeable sediment processes.

Keywords: Benthic; Biogeochemistry; Celtic Sea; Modelling; Permeable sediments.


Figures

Fig. 1
Fig. 1
Location map of the SSB Celtic Sea study sites superimposed on sediment type information based on Folk classification (Folk 1954). Note at the Celtic Deep 2 site there are superimposed lander and Cefas SmartBuoy deployments, Box A, G etc. are synonymous with ‘site A’ and ‘site G’ in the text
Fig. 2
Fig. 2
a ERSEM 15.06 model benthic organic matter classes and relationships. b Simplified schematic of main ERSEM 15.06 benthic nitrogen cycle. D1 is the oxygen penetration depth, D2 is depth at which the nitrate concentration becomes zero. c Benthic food web. Dotted arrows indicate less preferred paths. SWI sediment water interface. Note faunal groups also excrete material to the POM/DOM pool (not shown)
Fig. 3
Fig. 3
Pelagic nutrients, model-data comparison at sites A and G. Observed nutrients from water samples taken during CTD casts. Line/symbol colour indicates site, Circles near-surface (−15 m), triangles near-bottom values (−85– −90 m). Model, dashed curves near-surface values, solid curves near-bottom values
Fig. 4
Fig. 4
Ammonium water column profiles, model-data comparison near site A. Model (line); observations CTD casts (circles)
Fig. 5
Fig. 5
Temperature, chlorophyll, oxygen, model-data comparison for pelagic variables near site A. a Temperature (°C), near-surface (−1 m) and near-bottom (−100, −115m). b Surface (−1 m) chlorophyll (mg Chl m−3). c Oxygen concentration (mmol m−3), near-surface (−1 m) and near-bottom (−100 m). Model site G values are almost identical to A and not shown. Surface values from Cefas SmartBuoy. Bottom values from seabed lander deployments. Celtic Deep 2 (CD2); East Celtic Deep (ECD); East Haig Fras (EHF); Nymph Bank (NB). See Fig. 1 for locations
Fig. 6
Fig. 6
Particulate organic carbon and nitrogen model-data comparison. a Total bed inventory (annual average, g C m−2, g N m−2). Observations, 25 cm deep cores at site A and 10 cm deep cores at G, with site G values scaled to 25 cm assuming uniform values with depth. Model values, sum of semi-labile and refractory concentrations integrated down to 25 cm. b POC profiles (g C m−3) at site A. Model curves are annual average values for site A. See "Methods" section and Fig. 2 for definition of refractory and semi labile POM in the model
Fig. 7
Fig. 7
Benthic oxygen, model-data comparison at sites A and G. a Water column, near-surface chlorophyll (mg Chl m−3) included for temporal reference in interpreting benthic variables. b Total (benthic) oxygen uptake (mmol O2 m−2 day−1) plotted as a positive value (NB as a flux into the bed, this is often given a negative value). c Oxygen penetration depth (cm), negative from the SWI. Observational data NH, HS, VK, BS denotes data from independent measurements of this quantity as described in the "Methods" section. Note dates of observations have been adjusted slightly to avoid overlapping of symbols. Periods of enhanced oxygen consumption in model G marked by X
Fig. 8
Fig. 8
Site A, pore-water nutrient profiles (mmol m−3), model-data comparison. Observations, average over three replicates (error bars omitted for clarity). Model results are depth average concentrations. Solid line (Model A); Dashed line (Model A1). Nitrate concentrations are zero below the nitrate penetration depth (e.g. run A1 in March 2015)
Fig. 9
Fig. 9
Site G, pore-water nutrient profiles (mmol m−3), model-data comparison. Observations, average over three replicates (error bars omitted for clarity). Model results are depth averaged concentrations. Solid line run with permeable modification (Model G); Dashed line no permeable sediment modification (Model G0). Nitrate, concentrations are zero below the nitrate penetration depth (e.g. run G, G0 in Aug 2015)
Fig. 10
Fig. 10
Benthic fauna and aerobic bacteria biomass (g C m−2). For the latter, observed values are on the top 1 cm, modelled values are over the oxygenated later depth which is variable in range 0.5–2.0 cm (Fig. 7). Solid line (Model A) site A with original parameter settings; dashed line (Model A1) site A with refractory POM modification; dotted line is model site G with permeable sediment formulation. Observed deposit and suspension feeder biomass shown for all replicates. Average over replicates also plotted (solid symbols). Meiofauna is mean value only (three replicates). Some dates offset (within a 2-week window) to avoid over-plotting of symbols
Fig. 11
Fig. 11
Modelled seasonal variation: a benthic fauna (g C m−2); b benthic bacteria (g C m−2); c bed nitrate content (mmol N m−2) and nitrification rate (mmol N m−2 day−1), the latter shown as a negative flux (also note mixed vertical axis units). Solid line (Model A) run with original parameter settings. Dashed line (Model A1)

References

    1. Anonymous (1964) Effects of polluting discharges on the Thames estuary. Dept. Sci. Ind. Research, Technical paper 11, HMSO, London, pp. 1–587
    1. Arndt S, Jørgensen BB, LaRowe DE, Middelburg JJ, Pancost RD, Regnier P. Quantifying the degradation of organic matter in marine sediments: a review and synthesis. Earth Sci Rev. 2013;123:53–86. doi: 10.1016/j.earscirev.2013.02.008. - DOI
    1. Baretta JW, Ruardij P. Tidal flat estuaries: simulation and analysis of the Ems estuary. Ecol Stud. 1988;71:353.
    1. Blackford JC. An analysis of benthic biological dynamics in a North Sea ecosystem model. J Sea Res. 1997;38:213–230. doi: 10.1016/S1385-1101(97)00044-0. - DOI
    1. Blackford JC, Allen JI, Gilbert FJ. Ecosystem dynamics at six contrasting sites: a generic modelling study. J Mar Syst. 2004;52(1):191–215. doi: 10.1016/j.jmarsys.2004.02.004. - DOI

LinkOut - more resources