. 2020 Jan 15:10:1527.
doi: 10.3389/fphys.2019.01527. eCollection 2019.

Reactive Jumps Preserve Skeletal Muscle Structure, Phenotype, and Myofiber Oxidative Capacity in Bed Rest

Affiliations

Reactive Jumps Preserve Skeletal Muscle Structure, Phenotype, and Myofiber Oxidative Capacity in Bed Rest

Dieter Blottner et al. Front Physiol. .

Abstract

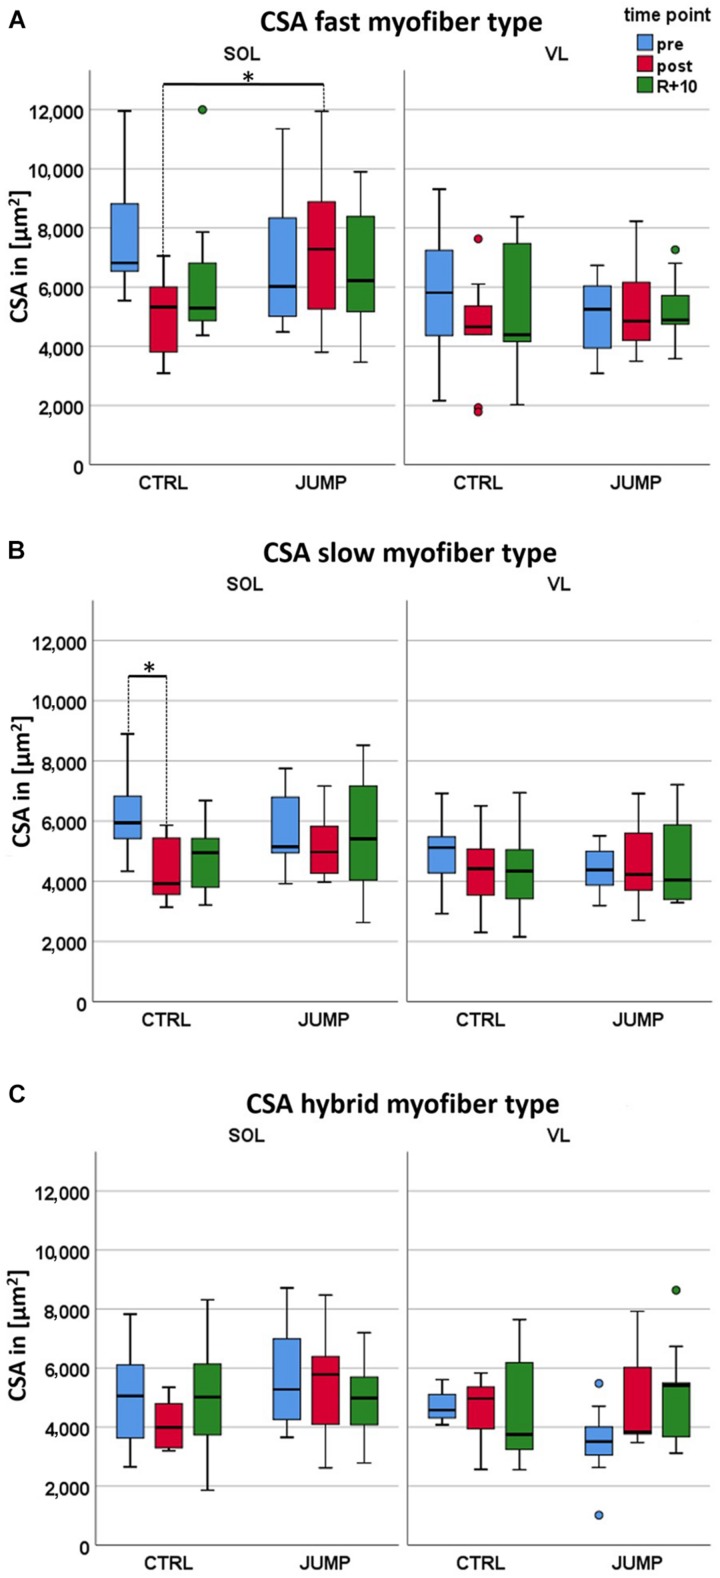
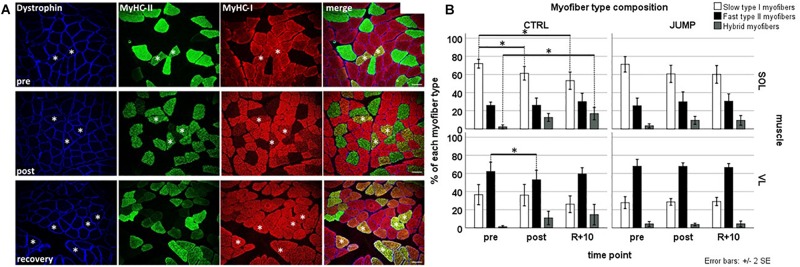
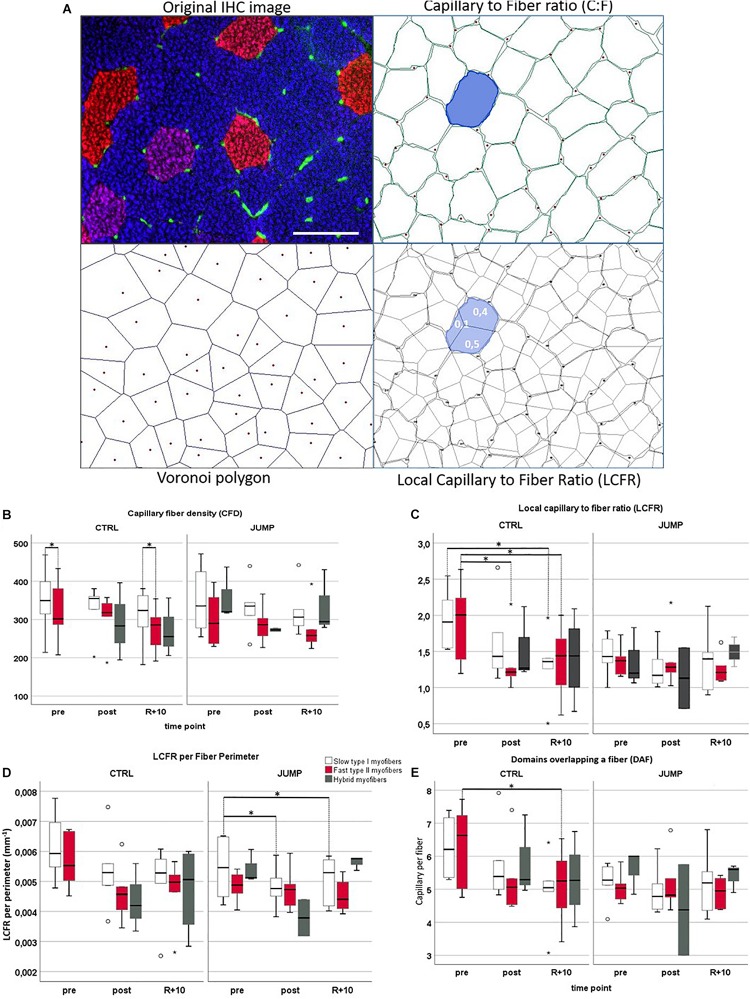
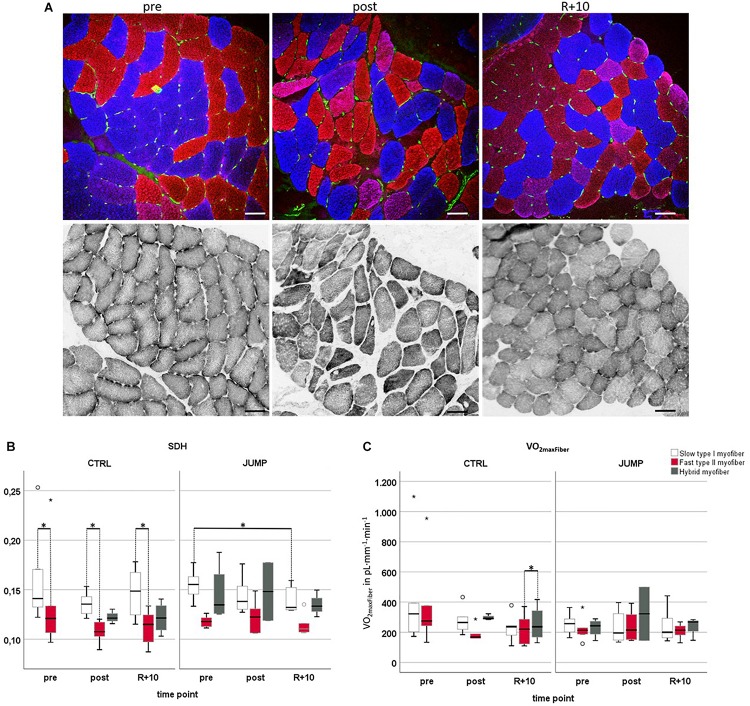
Identification of countermeasures able to prevent disuse-induced muscle wasting is crucial to increase performance of crew members during space flight as well as ameliorate patient's clinical outcome after long immobilization periods. We report on the outcome of short but high-impact reactive jumps (JUMP) as countermeasure during 60 days of 6° head-down tilt (HDT) bed rest on myofiber size, type composition, capillarization, and oxidative capacity in tissue biopsies (pre/post/recovery) from the knee extensor vastus lateralis (VL) and deep calf soleus (SOL) muscle of 22 healthy male participants (Reactive jumps in a sledge, RSL-study 2015-2016, DLR:envihab, Cologne). Bed rest induced a slow-to-fast myofiber shift (type I ->II) with an increased prevalence of hybrid fibers in SOL after bed rest without jumps (control, CTRL, p = 0.016). In SOL, JUMP countermeasure in bed rest prevented both fast and slow myofiber cross-sectional area (CSA) decrements (p = 0.005) in CTRL group. In VL, bed rest only induced capillary rarefaction, as reflected by the decrease in local capillary-to-fiber ratio (LCFR) for both type II (pre vs. post/R + 10, p = 0.028/0.028) and type I myofibers (pre vs. R + 10, p = 0.012), which was not seen in the JUMP group. VO2 max Fiber (pL × mm-1 × min-1) calculated from succinate dehydrogenase (SDH)-stained cryosections (OD660 nm) showed no significant differences between groups. High-impact jump training in bed rest did not prevent disuse-induced myofiber atrophy in VL, mitigated phenotype transition (type I - >II) in SOL, and attenuated capillary rarefaction in the prime knee extensor VL however with little impact on oxidative capacity changes.

Keywords: bed rest; capillarization; countermeasure; disuse; muscle atrophy; oxidative capacity.


Figures

FIGURE 1
FIGURE 1
Effect of 60 days RSL study bed rest on soleus (SOL) and vastus lateralis (VL) myofiber cross-sectional area (CSA) with and without JUMP training as countermeasure at three different time points (pre/post/recovery). (A) Box plots showing fast myofiber II mean CSA (μm2) of control (CTRL) (SOL n = 10, VL n = 9) and JUMP (SOL n = 12, VL n = 12). (B) Box plots showing slow myofiber I mean CSA (μm2) of CTRL (SOL n = 10, VL n = 9) and JUMP (SOL n = 12, VL n = 12). CSA values denote pre bed rest before (pre, blue), at end (post, red), and at 10 days of recovery after bed rest (R + 10, green). (C) Box plots showing fast (blue) and slow MyHCs (red) vs. hybrids (expressing both MyHCs, green) mean CSA (μm2) of CTRL (SOL n = 6, VL n = 4) and JUMP (SOL n = 11, VL n = 8). Significance p < 0.0001.
FIGURE 2
FIGURE 2
Representative subject-matched/paired images of myofiber type composition (slow/fast/hybrid) in RSL biopsies from one bed rest participant. (A) Triple immunostained cross sections [soleus (SOL)] with anti-dystrophin (blue) anti-type II (green) anti-type I (red) MyHC before (pre; upper panel), at end of head-down tilt (HDT) BR (post; middle panel), and recovery (R + 10, lower panel). Some hybrid myofibers (yellow immunostain, coexpressing both type I and type II MyHCs) are marked with white asterisks. Bar = 75 μm. (B) Quantification (bar graph) of myofiber phenotype composition (percent of total) between groups and time points. Upper panel (SOL), lower panel [vastus lateralis (VL)]; open bars (left column) control (CTRL) group, closed bar (right column) JUMP group. Percentage of slow type I, fast type II, and hybrid myofibers (expressing both markers) in SOL and VL muscle of BR subjects without (CTRL, type I/II SOL n = 10, VL n = 9, hybrid SOL n = 6, VL n = 4) and with exercise (JUMP, type I/II SOL n = 12, VL n = 12, hybrid SOL n = 11, VL n = 8) as countermeasure. A pre > post/recovery decrease in CTRL SOL type I myofibers (p = 0.001/0.001), pre > post decrease in CTRL VL type I myofibers (p = 0.037), and simultaneous increase in CTRL SOL hybrids (pre < rec p = 0.016) was observed. No changes were found in SOL and VL muscles from JUMP. Significance at p < 0.05, SPSS GLM with post hoc Bonferroni correction, bar graph/box plots (means) with median ± 2 SE.
FIGURE 3
FIGURE 3
Capillarization in vastus lateralis (VL) muscle from RSL study groups at three different time points (pre/post/R + 10). (A) Representative VL cryosection [head-down tilt (HDT) + 58, upper left] immunostained with slow MyHC-I (red), fast MyHC-II (blue), and platelet endothelial cell adhesion molecule 1 (PECAM-1, green), identifying capillary structures. Upper right shows automatically drawn myofiber borders (green) and capillaries (red dots) using BTablet Software (BaLoH). Lower left shows calculated Voronoi polygons (VP, also referred to as capillary domains; gray lines) representing the area of tissue closer to a given capillary (red dots) than neighboring capillaries. Lower right shows overlap of VP with myofiber borders, local capillary-to-fiber ratio (LCFR) illustrated in blue with fraction size supplied through different capillaries indicated as numbers (0.1, 0.4). Scale bar (top left): 100 μm. (B–E) Box plots for different capillarity parameters: (B) capillary fiber density (CFD), (C) local capillary-to-fiber ratio (LCFR), (D) LCFR per fiber perimeter, and (E) domains overlapping a fiber (DAF) in different myofibers (slow = no color/fast = red/hybrids = gray), groups (CTLR vs. JUMP), and time points (pre/post/R + 10). Significant differences p < 0.05; non-parametric Friedman with post hoc Dunn-Bonferroni correction, box plots (means) with median ± 2 SE; small circles (o) = statistical outliers.
FIGURE 4
FIGURE 4
Oxidative capacity analyzed by semiquantitative histochemical succinate dehydrogenase optical density analysis (ODSDH) using RSL study biopsy cryosections. (A) Representative subject-matched/paired microscopic images at three different time points [vastus lateralis (VL), pre/post/R + 10]. Upper panel, immunostaining for slow MyHC-I (red), fast MyHC-II (blue), and capillary platelet endothelial cell adhesion molecule 1 (PECAM-1; green). Lower panel, adjacent cryosections with matched area stained for SDH histochemical activity at 37°C, index of mitochondrial activity (gray values). Scale bars = 75 μm. (B) Determination of optical density of SDH marker at 660 nm (OD660) in control (CTRL) (myofiber type I/II n = 6, hybrid pre n = 0 post n = 3 R + 10 n = 4) or exercise (JUMP, VL myofiber type I/II n = 6, hybrid pre n = 4, post n = 2, R + 10 = 3). The specific SDH activity (ODSDH) was always higher in CTRL pre/post/recovery (R + 10) type I vs. type II myofibers (pre p = 0.028, post p = 0.043, recovery p = 0.014). In the JUMP group, the amount of SDH activity was significantly different (reduced) in slow myofibers at R + 10 vs. pre (p = 0.028). (C) VO2maxFiber values showed a significant difference between recovery fast < hybrid (p = 0.014) with no changes in JUMP. CTRL group (left, myofiber type I/II n = 6, hybrid pre n = 0, post n = 3, R + 10 n = 4), JUMP group (right, myofiber type I/II n = 6, hybrid pre n = 4, post n = 2, R + 10 = 3). SDH and VO2maxFiber of slow type 1 (red), fast type 2 (blue), and hybrid myofibers (green) in participants without (CTRL) and with exercise (JUMP) at pre/post/recovery time points of head-down tilt (HDT) bed rest. Significance at p < 0.05, box plots (means) with median ± 2 SE.

Similar articles

Cited by

References

    1. Abdulai R. M., Jensen T. J., Patel N. R., Polkey M. I., Jansson P., Celli B. R., et al. (2018). Deterioration of limb muscle function during acute exacerbation of Chronic Obstructive Pulmonary Disease. Am. J. Respir. Crit. Care Med. 197 433–449. 10.1164/rccm.201703-0615CI - DOI - PMC - PubMed
    1. Adams G. R., Caiozzo V. J., Baldwin K. M. (2003). Skeletal muscle unweighting: spaceflight and ground-based models. J. Appl. Physiol. 95 2185–2201. - PubMed
    1. Alkner B. A., Tesch P. A. (2004). Knee extensor and plantar flexor muscle size and function following 90 days of bed rest with or without resistance exercise. Eur. J. Appl. Physiol. 93 294–305. 10.1007/s00421-004-1172-1178 - DOI - PubMed
    1. Al-Shammari A. A., Gaffney E. A., Egginton S. (2012). Re-evaluating the use of voronoi tessellations in the assessment of oxygen supply from capillaries in muscle. Bull. Math. Biol. 74 2204–2231. 10.1007/s11538-012-9753-x - DOI - PubMed
    1. Andersen J. L. (2003). Muscle fibre type adaptation in the elderly human muscle. Scand. J. Med. Sci. Sports 13 40–47. - PubMed