. 2020 Jan 17:10:3045.
doi: 10.3389/fmicb.2019.03045. eCollection 2019.

Analysis of an Intrinsic Mycovirus Associated With Reduced Virulence of the Human Pathogenic Fungus Aspergillus fumigatus

Affiliations

Analysis of an Intrinsic Mycovirus Associated With Reduced Virulence of the Human Pathogenic Fungus Aspergillus fumigatus

Azusa Takahashi-Nakaguchi et al. Front Microbiol. .

Abstract

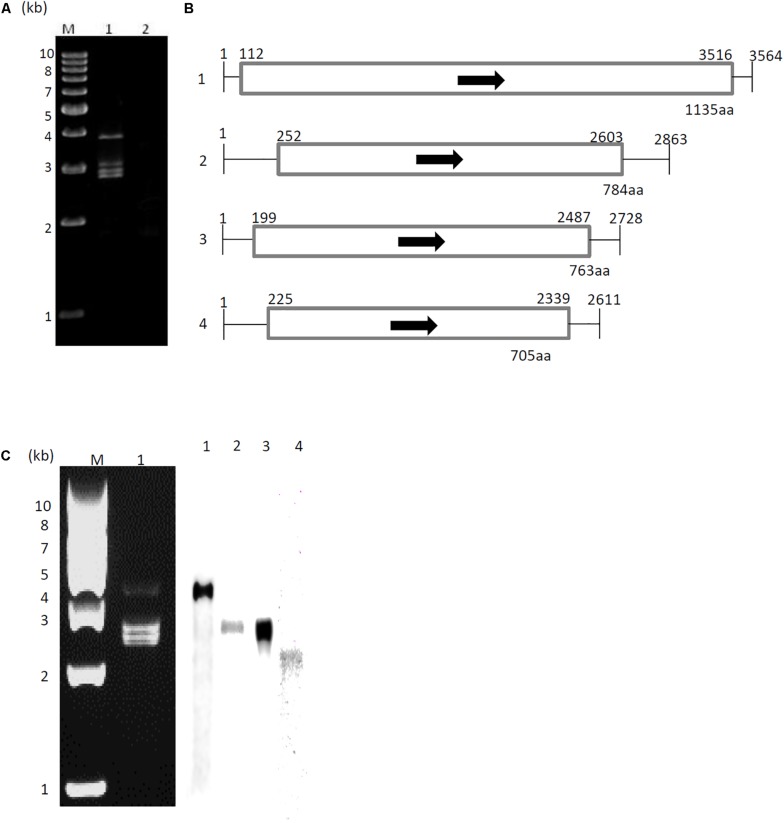
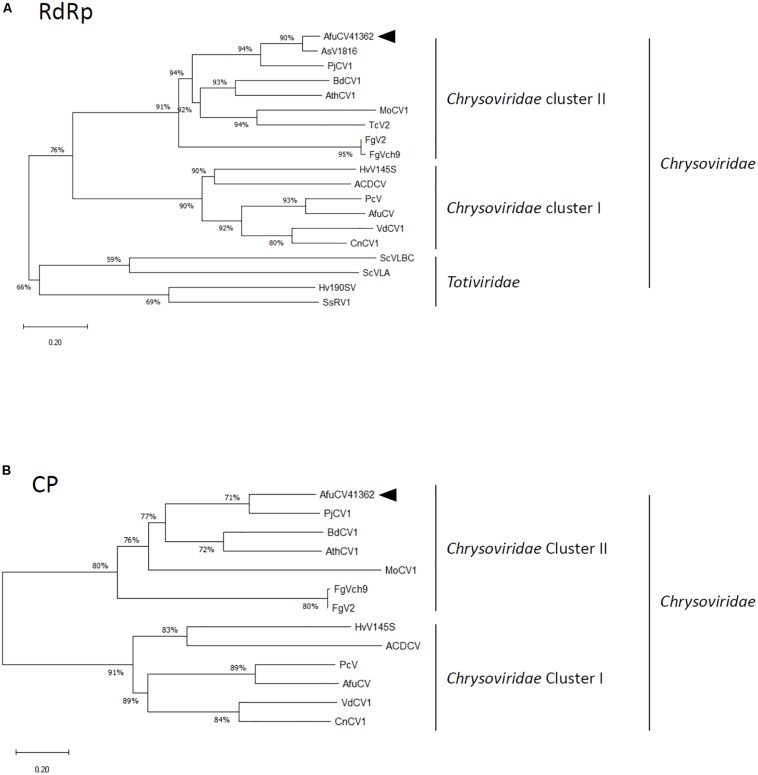
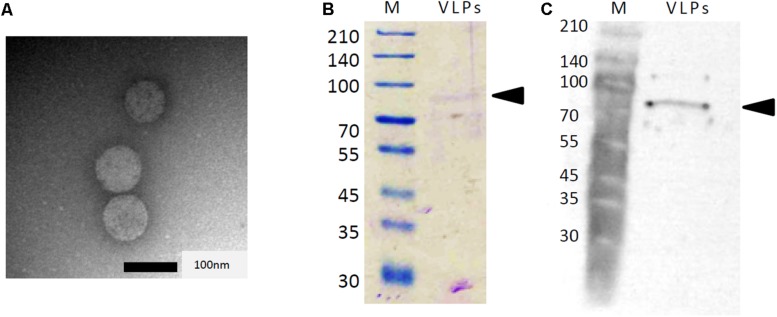
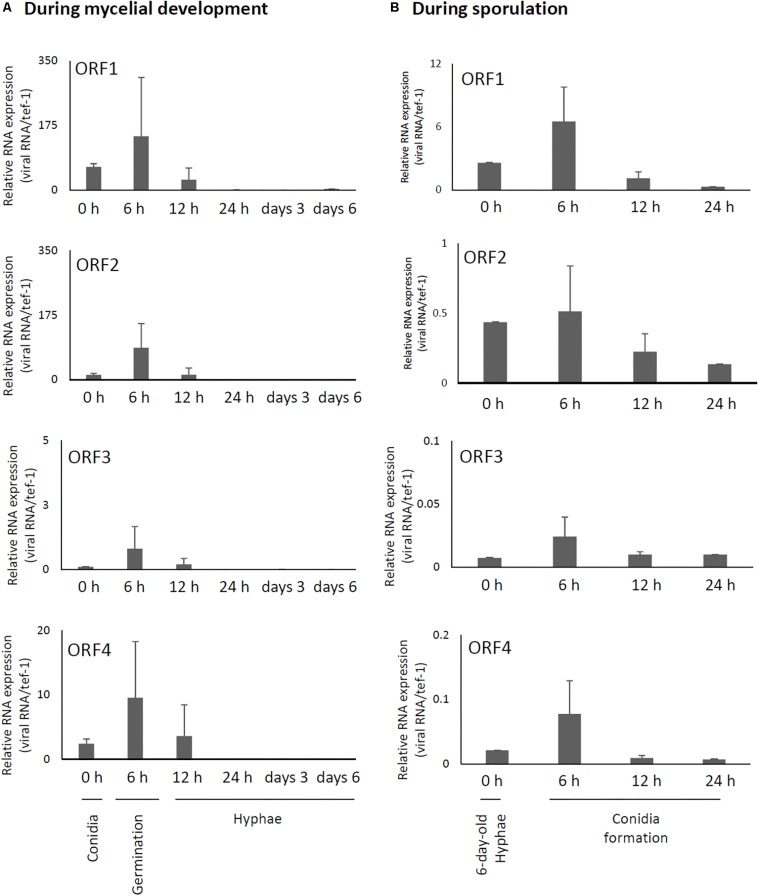
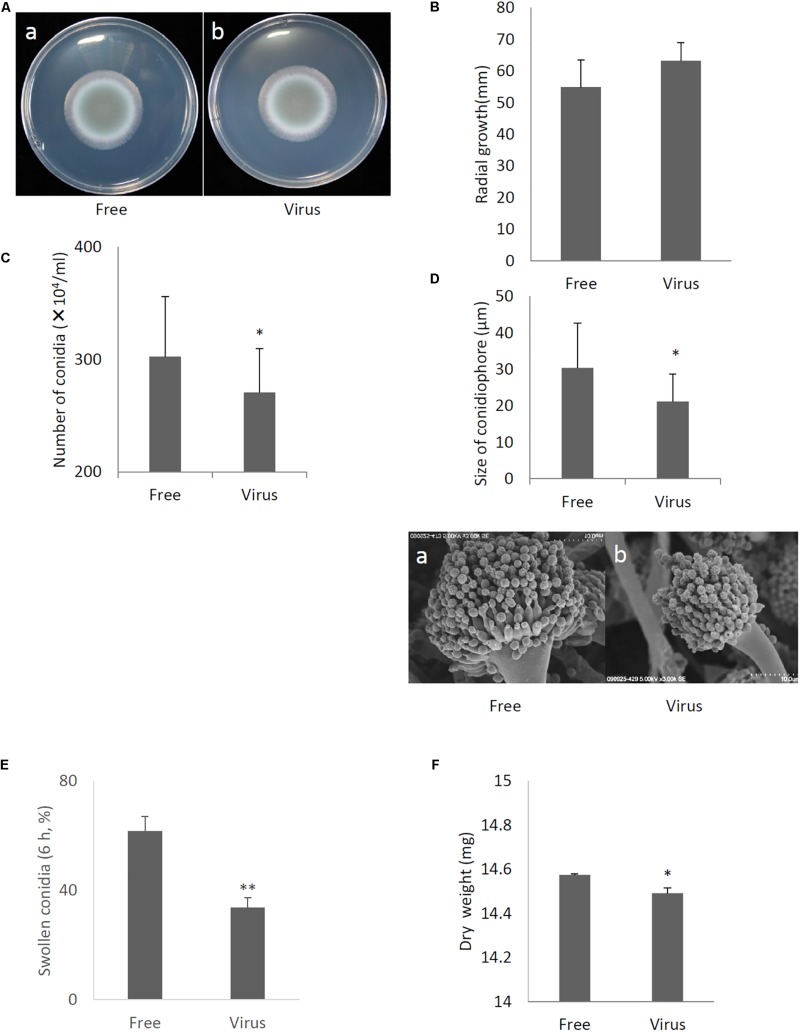
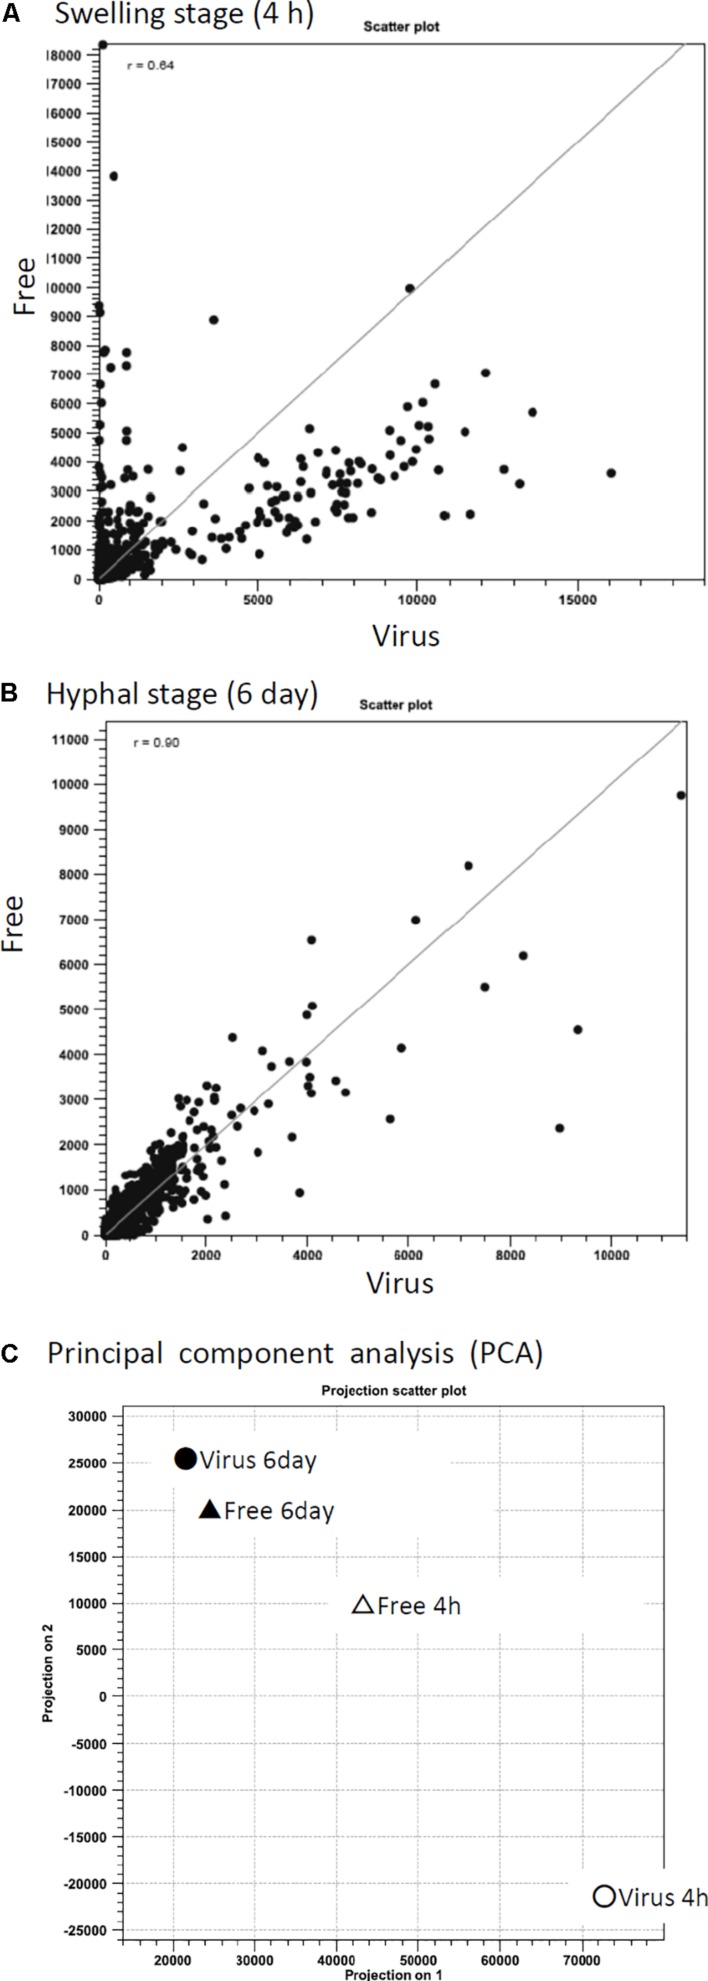
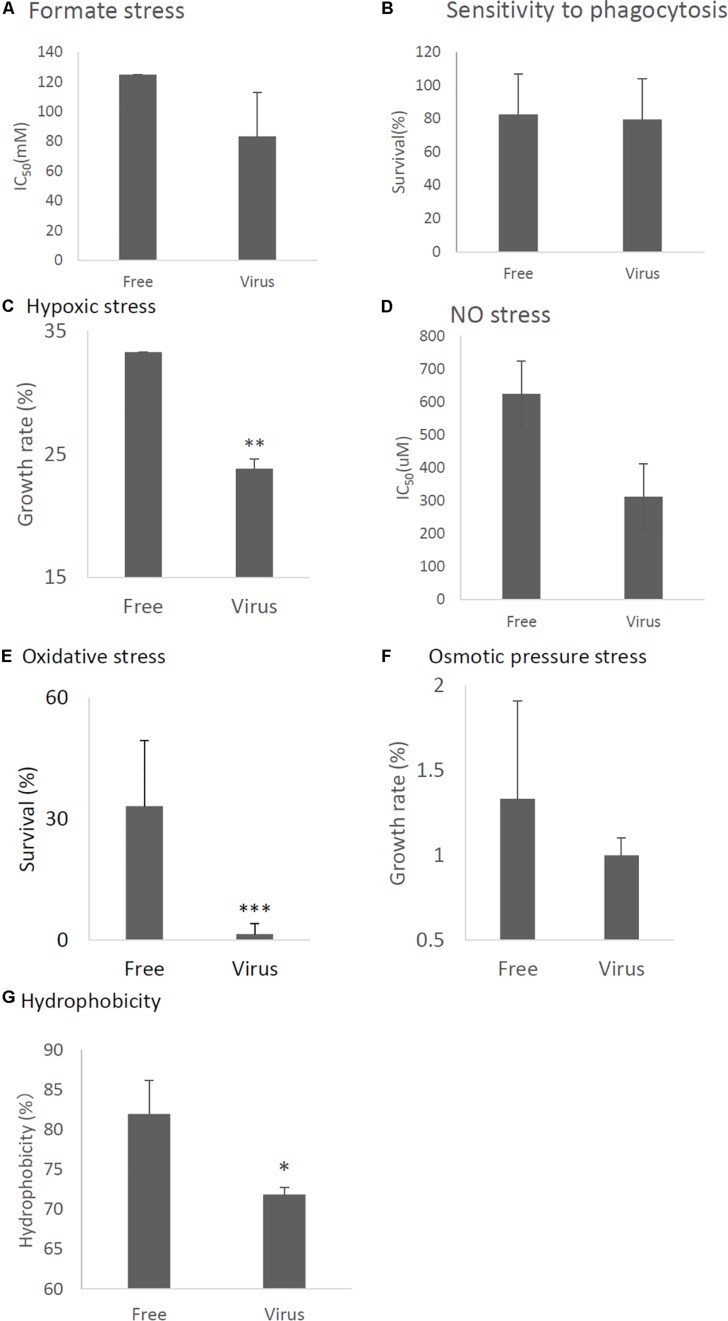
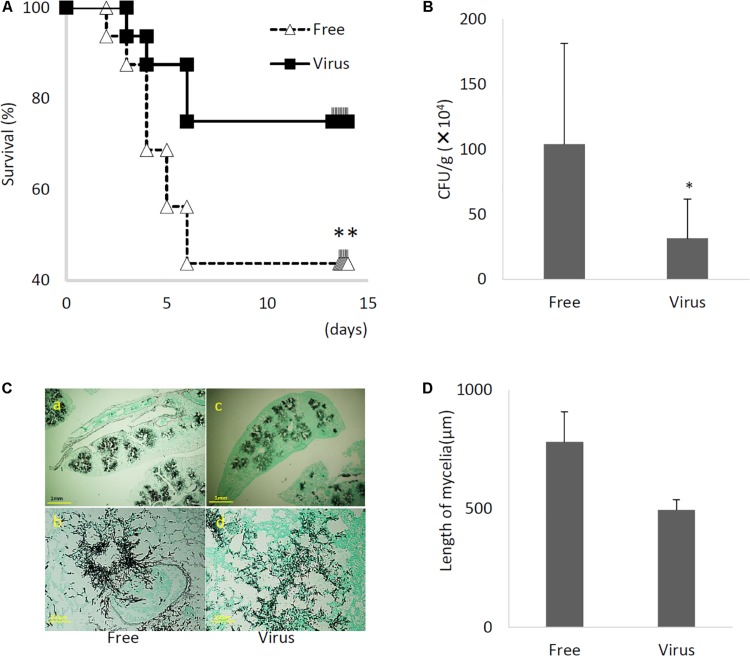
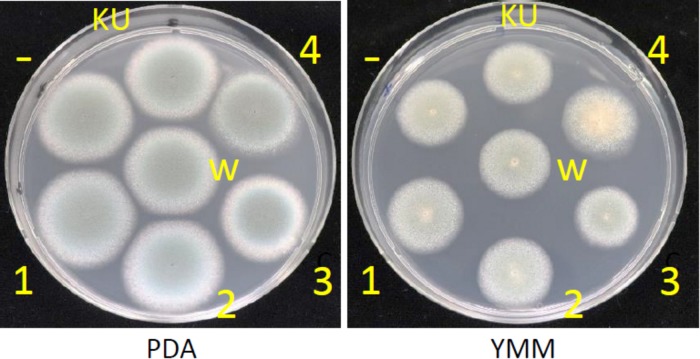
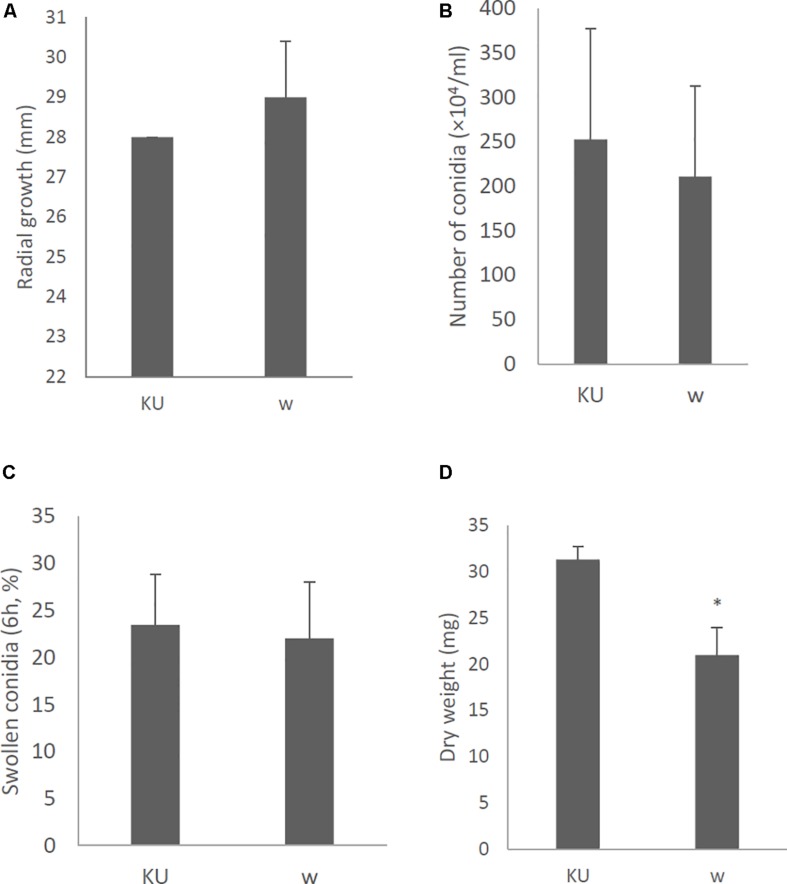
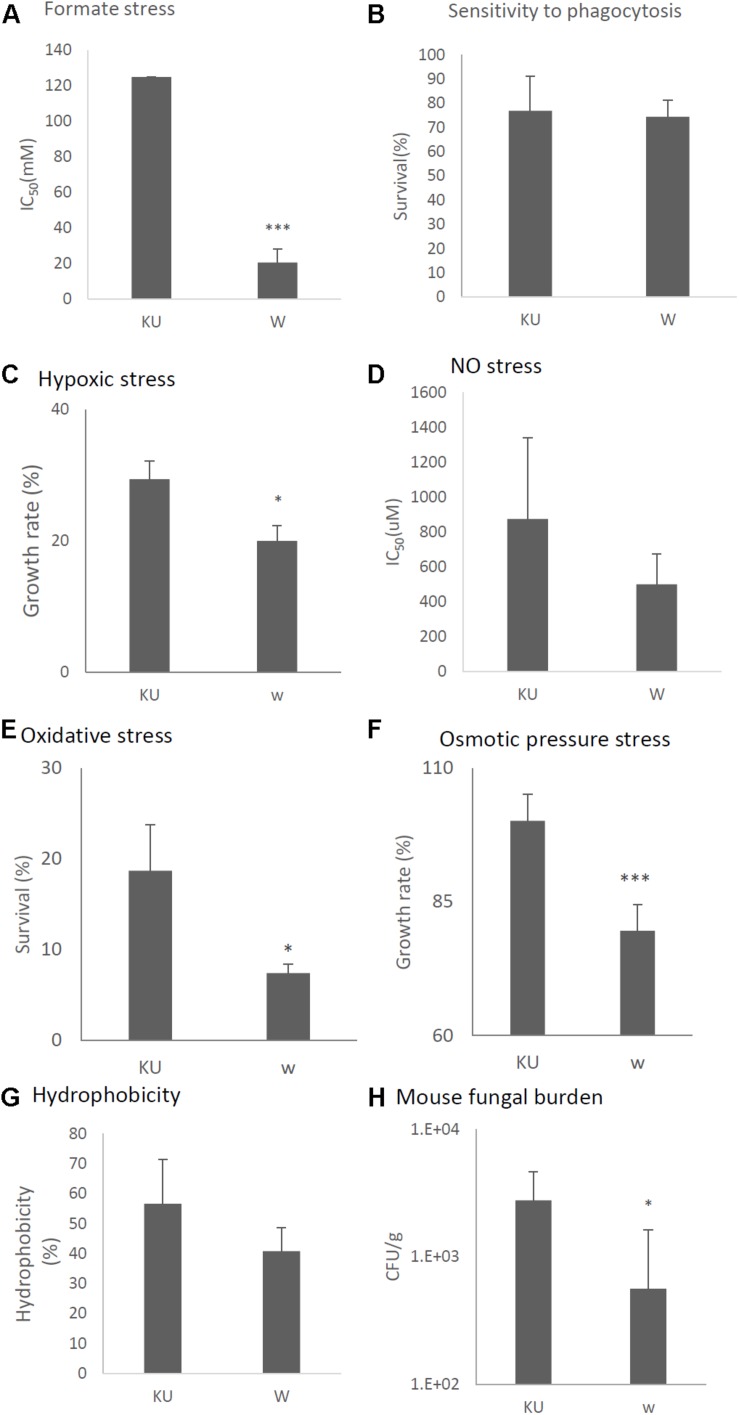
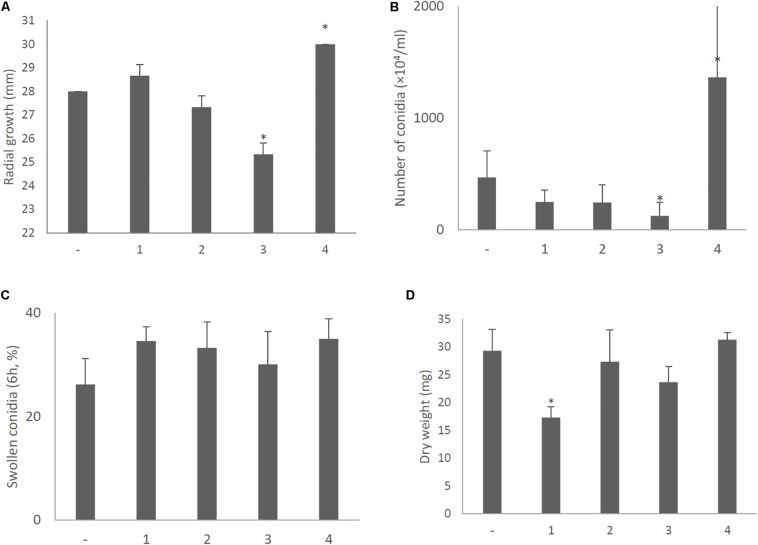
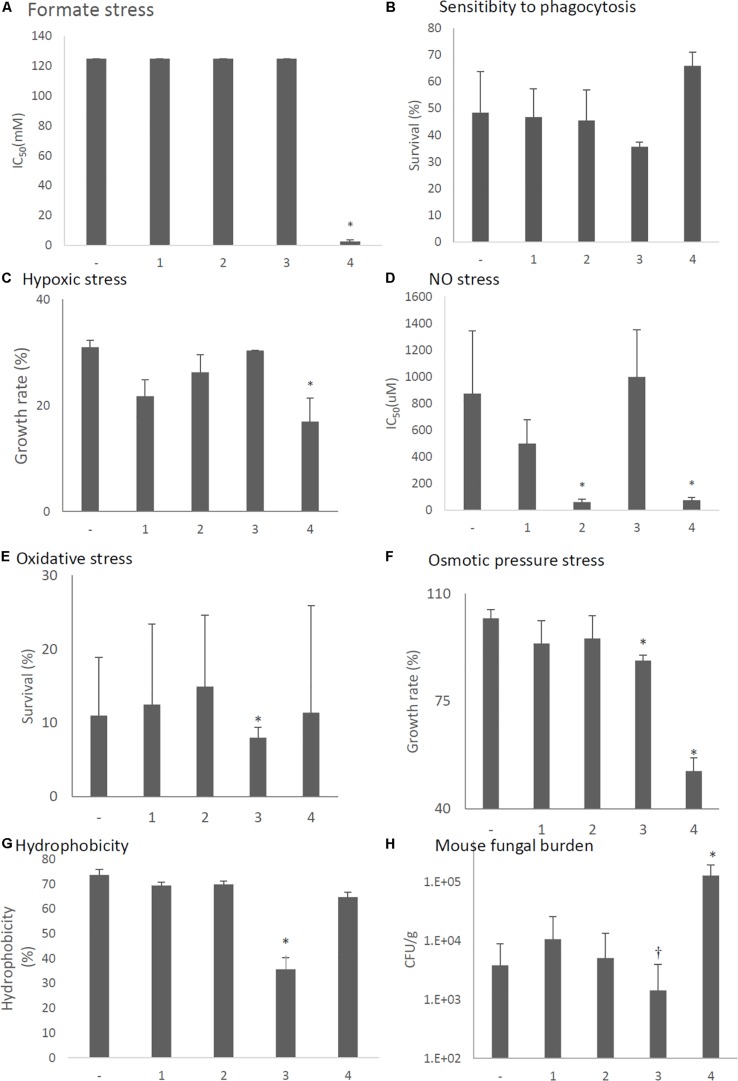
Aspergillus fumigatus is an airborne fungal pathogen that causes severe infections with invasive growth in immunocompromised patients. Several mycoviruses have recently been isolated from A. fumigatus strains, but there are presently no reports of mycoviral-mediated reduction or elimination of fungal pathogenicity in vertebrate models. Here, we report the biological features of a novel mycovirus, A. fumigatus chrysovirus 41362 (AfuCV41362), isolated from the hypovirulent A. fumigatus strain IFM 41362. The AfuCV41362 genome is comprised of four dsRNAs, each of which contains a single ORF (ORF1-4). ORF1 encodes a protein with sequence similarity to RNA-dependent RNA polymerases of viruses in the family Chrysoviridae, while ORF3 encodes a putative capsid protein. Viral RNAs are expressed primarily during the germination stage, and RNA-seq analysis of virus-infected A. fumigatus at the germination stage suggested that the virus suppressed expression of several pathogenicity-associated host genes, including hypoxia adaptation and nitric oxide detoxification genes. In vitro functional analysis revealed that the virus-infected strain had reduced tolerance to environmental stressors. Virus-infected A. fumigatus strain IFM 41362 had reduced virulence in vivo compared to the virus-free strain in a mouse infection model. Furthermore, introduction of the mycovirus to a natively virus-free KU A. fumigatus strain induced virus-infected phenotypes. To identify mycovirus genes responsible for the reduced virulence of A. fumigatus, each viral ORF was ectopically expressed in the virus-free KU strain. Ectopic expression of the individual ORFs only nominally reduced virulence of the host fungus in a mouse infection model. However, we found that ORF3 and ORF4 reduced tolerance to environmental stresses in in vitro analysis. Based on these results, we suggest that the AfuCV41362 mycovirus ORF3 and ORF4 reduce fungal virulence by suppressing stress tolerance together with other viral genes, rather than alone.

Keywords: Aspergillus fumigatus; Chrysoviridae; dsRNA; hypovirulence; mycovirus.


Figures

FIGURE 1
FIGURE 1
Genome organization of AfuCV41362. (A) dsRNA was extracted and electrophoresed on a 5% (wt/vol) polyacrylamide gel. Lane M, molecular weight maker; Lanes 1 and 2, extracts from AfuCV41362-infected and virus-free strains, respectively. (B) Schematic drawing of the genomic organization of AfuCV41362. The numbers 1–4 on the left indicate revealed contigs. The horizontal lines and boxes indicate full dsRNA lengths and ORFs, respectively. Arrows indicate ORF sense orientations. Numbers on the lines and boxes indicate nucleotide numbers. Numbers under the boxes indicate amino acid (aa) lengths. (C) Left: Agarose gel electrophoresis of dsRNAs purified from A. fumigatus strain AfuCV41362. Lane M, molecular weight marker; Lane 1, strain harboring AfuCV41362. Right: Northern blot detection of dsRNA fragments using digoxigenin-labeled DNA probes against dsRNA fragments 1–4. dsRNA samples were electrophoresed on four different lanes of a single gel and blotted. The four blotted lanes were separated and hybridized with the probes for each dsRNA. Lanes 1–4 of panel C were then reconstituted from the hybridized strips.
FIGURE 2
FIGURE 2
Phylogenetic analysis of (A) the putative RNA-dependent RNA polymerase (RdRp) and (B) capsid protein (CP) sequences of AfuCV41362 and other selected dsRNA mycoviruses belonging to the families Chrysoviridae and Totiviridae. The phylogenetic tree was generated using the Neighbor Joining (NJ) method. Datasets were subjected to 1000 bootstrap replicates. The scale bars indicate the number of replacements per site. The numbers at the branch points indicate the bootstrap percentage. The full names and sequence information are given in Supplementary Tables S1A,B. The arrowhead in each panel indicates the novel virus described in the present study.
FIGURE 3
FIGURE 3
Analysis of AfuCV41362 particles isolated from A. fumigatus strain IMF 41362. (A) Transmission electron microscope (TEM) photograph negative staining of AfuCV41362 virus particles. (B) SDS-PAGE of proteins purified from AfuCV41362. Lane M, molecular weight markers. The gel was stained with Coomassie Brilliant Blue R-250. VLPs, virus-like particles. Arrowheads are indicative of ORF3 band positions. (C) Western blot detection of a band by anti-virus ORF3 protein antibody raised against a synthetic peptide for a partial ORF3 sequence.
FIGURE 4
FIGURE 4
Changes in viral ORF transcript levels at different stages of growth in the AfuCV41362-infected strain. (A) RNA levels were analyzed by real-time PCR during the fungal life-cycle, with time points after expose to liquid medium as follows: 0 h (conidia), 6 h (germination), and later stages of mycelial development (12 h, 24 h, and days 3 and 6). (B) RNA levels were analyzed by real-time PCR during sporulation, with time points as follows: 0 (day 6, mycelia), 6 (vesicle formation), 12 (phialide formation), and 24 h (conidial formation). Data values were normalized to that of the internal control tef-1, and presented as mean ± SD of three independent experiments.
FIGURE 5
FIGURE 5
Comparisons of colony morphology and conidial formation of virus-free (Free) and virus-infected (Virus) strains. (A) Colony morphology of AfuCV41362 virus-free (a) and virus-infected (b) A. fumigatus strains (cultured for 2 days). (B) Radial growth of colonies formed by virus-free and AfuCV41362 virus-infected A. fumigatus strains. (C) Numbers of conidia formed by the strains at 24 h after starting point inoculation. (D) Top: Sizes of conidiophores formed by the virus-free and virus-infected strains. Data are presented as mean + SD of three independent experiments. P < 0.05, by two-tailed Student’s t-test. The data pair of panel B was not statistically significant. Bottom: SEM images of the virus-free (a) and virus-infected (b) strains. Calibration, 10 μm. (E) Comparisons of conidia swelling of virus-free (Free) and virus-infected (Virus) strains. Percentages of swelling (6 h) conidia formed by the virus-free and virus-infected strains. Data are presented as mean + SD of three independent experiments. ∗∗P < 0.01, by two-tailed Student’s t-test. (F) Mycelial growth. Growth was quantified by measuring dry weights of mycelia at 24 h after starting incubation of conidia.
FIGURE 6
FIGURE 6
Correlation of differential gene expression between virus-infected (Virus) and virus-free (Free) strains analyzed by RNA-seq. (A,B) Scatter plots of transcript levels (RPKMs) at the swelling stage (A: 4 h) and the hyphal stage (B: day 6). (C) Transition of gene expression patterns in the virus-infected (circle symbols) and virus-free (triangle) strains during swelling stage (4 h, white) and hyphal stage (day 6, black). The pattern was examined through principal component analysis (PCA).
FIGURE 7
FIGURE 7
Comparisons of tolerance to stresses of virus-free (Free) and virus-infected (Virus) strains. (A) IC50 of the strains under formate stress conditions (RPMI 1640 medium). (B) Sensitivity of the A. fumigatus strains to phagocytosis by J774A.1, a murine macrophage cell line. Techniques are described in the section “Materials and Methods.” (C) Effect of hypoxic stress (conidial growth under anaerobic culture conditions). Germination and growth rate are expressed as percentages of growth in the absence of stress. Experimental methods are detailed in the section “Materials and Methods.” (D) IC50 of the strains under NO stress conditions (NOC-18 in RPMI1640 medium). (E) Germination rates of the virus-free and virus-infected strains under oxidative stress (germination following 24-h exposure to 32.6 nM H2O2). (F) Growth of the virus-free and virus-infected A. fumigatus strains under osmotic stress conditions (conidial growth in the presence of 0.8 M NaCl). (G) Hydrophobicity. Data are presented as mean + SD of three independent experiments. P < 0.05, ∗∗P < 0.01, ∗∗∗P < 0.001, by two-tailed Student’s t-test.
FIGURE 8
FIGURE 8
Comparisons of murine virulence of virus-free (Free) and virus-infected (Virus) strains. (A) Survival rates of mice infected with the AfuCV41362 virus-infected and virus-free strains. ∗∗P < 0.05 by Kaplan–Meier log tank test. (B) Fungal growth from the lungs of infected mice. Fungal burdens were estimated as CFUs per gram of lung. Five mice per experiments and repeated three times. (C) Lung histology of mice at 3 days after infection (Gomori’s methenamine silver-staining-Grocott’s variation). (a,b) virus-free strains; (c,d) virus-infected strains. (D) Quantified mycelial growth in the lungs of mice infected with the virus-free and virus-infected fungal strains. The tissues were dissected for observation on day 3 after infection. For graphs B and D, data are presented as mean + SD of three independent experiments. P < 0.05, by two-tailed Student’s t-test.
FIGURE 9
FIGURE 9
Colony morphologies of the whole-virus infected KU strain, AfuCV41362 ORF-expressing KU strains and the native virus-free strain. 37°C, 24 h. KU, the virus-free KU strain. w, the whole-virus infected KU strain, 1–4, KU strains with forced expression of ORFs (introduced by transformation). -, KU strain carrying an empty vector.
FIGURE 10
FIGURE 10
Morphological comparisons of the whole-virus infected KU strain and the native virus-free KU. (A) Radial growth of colonies. (B) The number of conidia formed by the strains at 24 h after starting point inoculation. (C) Percentages of swelling (6 h, D conidia of the strains). (D) Mycelial growth. Growth was quantified by measuring dry weights of mycelia at 24 h after starting incubation of conidia. Data are presented as mean ± SD of three independent experiments. P < 0.05, by two-tailed Student’s t-test.
FIGURE 11
FIGURE 11
Comparisons of tolerance to stresses, response of mammalian cells, and virulence of the virus-infected KU strain and KU strain. KU, the virus-free KU strain. w, the virus-infected KU strain. The labels are common from A to G. (A) IC50 of the strains under formate stress conditions (RPMI 1640 medium). (B) Sensitivity of the A. fumigatus strains to phagocytosis by A.1, a murine macrophage cell line. Techniques are described in the section “Materials and Methods.” (C) Growth of the fungal strains under hypoxic stress conditions. (D) IC50 of the strains under NO stress conditions (NOC-18 in RPMI 1640 medium). (E) Effect of hydrogen peroxide on the growth of the fungal strains. (F) Growth of the fungal strains under osmotic stress conditions. (G) Hydrophobicity. (H) The number of colonies per gram of lung tissue isolated from mice at 72 h after fungal infection. Data are presented as mean ± SD using four mice per group. P < 0.05. For panels (B–G), data are presented as mean ± SD of three independent experiments. P < 0.05, ∗∗∗P < 0.001 by two-tailed Student’s t-test comparison of the virus-infected (w) strains to the KU strain.
FIGURE 12
FIGURE 12
Morphological comparisons of the AfuCV41362 ORF-expressing KU strains. (A) Radial growth of colonies by ORF-expressing KU strains. (B) The number of conidia formed by the strains at 24 h after starting point inoculation. (C) Percentages of swelling (6 h, D conidia of the strains). (D) Mycelial growth. Growth was quantified by measuring dry weights of mycelia at 24 h after starting incubation of conidia. Data are presented as mean ± SD of three independent experiments. P < 0.05, by one-way ANOVA, Dunnett’s test.
FIGURE 13
FIGURE 13
Comparisons of tolerance to stresses, response of mammalian cells, and virulence of ORF-expressing strains. -, KU strain carrying an empty vector. 1–4, KU strains with forced expression of each ORF. The labels are common from graphs (A) to (G). (A) IC50 of the strains under formate stress conditions (RPMI 1640 medium). (B) Sensitivity of the A. fumigatus strains to phagocytosis by J774A.1, a murine macrophage cell line. Techniques are described in the section “Materials and Methods.” (C) Growth of the fungal strains under hypoxic stress conditions. (D) IC50 of the strains under NO stress conditions (NOC-18 in RPMI 1640 medium). (E) Effect of hydrogen peroxide on the growth of the fungal strains. (F) Growth of the fungal strains under osmotic stress conditions. (G) Hydrophobicity. (H) The number of colonies per gram of lung tissue isolated from mice at 72 h after fungal infection. Data are presented as mean ± SD using four mice per group. P < 0.05, P < 0.15 (nominally not statistically significant). The labels are common from graphs (A) to (G). For graphs (B–G), data are presented as mean ± SD of three independent experiments. P < 0.05, by one-way ANOVA, Dunnett’s test. The data without “” were NS in comparison to control (KU strain carrying an empty vector).

References

    1. Agrawal N., Dasaradhi P. V. N., Mohmmed A., Malhotra P., Bhatnagar R. K., Mukherjee S. K. (2003). RNA interference: biology, mechanism, and applications. Microbiol. Mol. Biol. Rev. 67 657–685. 10.1128/mmbr.67.4.657-685.2003 - DOI - PMC - PubMed
    1. Attoui H., De Micco P., de Lamballerie X. (1997). Complete nucleotide sequence of Colorado tick fever virus segments M6, S1 and S2. J. Gen. Virol. 78(Pt 11), 2895–2899. 10.1099/0022-1317-78-11-2895 - DOI - PubMed
    1. Bhatti M. F., Bignell E. M., Coutts R. H. A. (2011). Complete nucleotide sequences of two dsRNAs associated with a new partitivirus infecting Aspergillus fumigatus. Arch. Virol. 156 1677–1680. 10.1007/s00705-011-1045-5 - DOI - PubMed
    1. Blosser S. J., Cramer R. A. (2012). SREBP-dependent triazole susceptibility in Aspergillus fumigatus is mediated through direct transcriptional regulation of erg11A (cyp51A). Antimicrob. Agents Chemother. 56 248–257. 10.1128/AAC.05027-11 - DOI - PMC - PubMed
    1. Brown A. J., Haynes K., Quinn J. (2009). Nitrosative and oxidative stress responses in fungal pathogenicity. Curr. Opin. Microbiol. 12 384–391. 10.1016/j.mib.2009.06.007 - DOI - PMC - PubMed