. 2020 Jan 17:10:3047.
doi: 10.3389/fmicb.2019.03047. eCollection 2019.

Differences in Gut Microbial and Serum Biochemical Indices Between Sows With Different Productive Capacities During Perinatal Period

Affiliations

Differences in Gut Microbial and Serum Biochemical Indices Between Sows With Different Productive Capacities During Perinatal Period

Yirui Shao et al. Front Microbiol. .

Abstract

Maternal gut microflora changes dramatically during perinatal period and plays a vital role in animal health and reproductive performance. However, little is known about the microbial differences between sows with different productive capacities during perinatal period. Hence, this study explored fecal microbial diversity, composition, metabolic functions, and phenotypes differences between high productive capacity (HPC, litter size ≥ 15) and low productive capacity (LPC, litter size ≤ 7) sows during late pregnancy (LP, the third day before due date) and early stage after parturition (EAP, the third day after parturition) as well as serum biochemical indices differences after parturition. Results showed that HPC sows had lower microbial richness at LP stage and higher microbial diversity at EAP stage than LPC sows. Several genera belonging to the Prevotellaceae family exhibited higher abundance, while some genera belonging to the Ruminococcaceae family exhibited lower abundance in HPC sows compared to LPC sows at LP stage. Moreover, the relative abundance of Eubacterium_coprostanoligenes_group and Ruminococcaceae_UCG-014 in HPC sows was significantly higher than that in LPC sows at EAP stage. The predicted metabolic functions related to Lipopolysaccharide biosynthesis were significantly higher in HPC sows at LP stage. Further, HPC sows had significantly higher blood urea nitrogen (BUN) and high-density lipoprotein cholesterol (HDL-C) levels after parturition, and there were strong correlations between BUN level and the relative abundance of genera belonging to the Ruminococcaceae families. These results indicated that the HPC sows may experience greater inflammation than LPC sows at LP stage. Inflammation environment might impact health but promote parturition. The microbial differences at EAP stage might be beneficial to hemostasis and anti-inflammation, which might contribute to postpartum recovery in HPC sow.

Keywords: gut microbiota; perinatal period; productive capacity; serum immunity; sows.


Figures

FIGURE 1
FIGURE 1
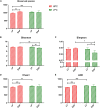
Alpha diversity and richness of gut microbiota from high productive capacity (HPC) and low productive capacity (LPC) sows at late pregnancy (LP) and early stage after parturition (EAP) stage. (A–E) Indices for alpha diversity and richness. Paired T-test (LP vs. EAP) or independent T-test (HPC vs. LPC) was used after accessing normality with Shapiro–Wilk W-test. Data are presented as mean ± SD (n = 6), P < 0.05, ∗∗P < 0.01, ∗∗∗P < 0.001.
FIGURE 2
FIGURE 2
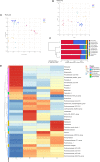
Composition differences of gut microbiota in sows. (A,B) Principal coordinate analysis (PCoA) and non-metric multidimensional scaling (NMDS) analyses. (C) Unweighted pair-group method with arithmetic mean (UPGMA) analysis. (D) Heatmap showing significantly different genera among groups. n = 6. A,C: sows with high productive capacity (HPC) at late pregnancy (LP) and early stage after parturition (EAP) separately; B,D: sows with low productive capacity (LPC) at late pregnancy (LP) and early stage after parturition (EAP) separately.
FIGURE 3
FIGURE 3
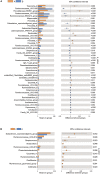
T-test bar plot of significantly different gut microbial species in sows at genus level (A,B). n = 6. A, C: sows with high productive capacity (HPC) at late pregnancy (LP) and early stage after parturition (EAP) separately; B, D: sows with low productive capacity (LPC) at late pregnancy (LP) and early stage after parturition (EAP) separately.
FIGURE 4
FIGURE 4
LEfSe analysis of gut microbial composition in sows with different productive capacities during perinatal period; (A) Histogram of the LDA scores, showing the biomarker taxa (LDA score > 4). (B) Cladogram obtained from LEfSe analysis, indicating the phylogenetic distribution of microbiota. n = 6. A, C: sows with high productive capacity (HPC) at late pregnancy (LP) and early stage after parturition (EAP) separately; B, D: sows with low productive capacity (LPC) at late pregnancy (LP) and early stage after parturition (EAP) separately.
FIGURE 5
FIGURE 5
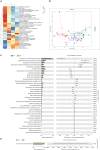
Differences in metabolic functions of gut microbiota. (A) Heatmap showing significantly different functional pathways. (B) Principal components analysis (PCA) plot of functional profiles among groups. (C,D) T-test bar plot of significantly differed metabolic pathways. n = 6. A, C: sows with high productive capacity (HPC) at late pregnancy (LP) and early stage after parturition (EAP) separately; B, D: sows with low productive capacity (LPC) at late pregnancy (LP) and early stage after parturition (EAP) separately.
FIGURE 6
FIGURE 6
Metabolic phenotypes of gut microbiota from high productive capacity (HPC) and low productive capacity (LPC) sows at late pregnancy (LP) and early stage after parturition (EAP) stage. (A–I) Different indices included in microbial phenotypes. Wilcoxon signed-rank test (LP vs. EAP) or Mann–Whitney U-test (HPC vs. LPC) was applied. P < 0.05, ∗∗P < 0.01 (n = 6).
FIGURE 7
FIGURE 7
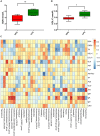
Serum biochemical indices differences in sows and correlations with gut microbial abundance during early stage after parturition. (A) Blood urea nitrogen (BUN, n = 6). (B) Serum high-density lipoprotein cholesterol (HDL-C, n = 6). (C) Heatmap of correlations between gut microbial abundance and serum biochemical indices at genus level. Paired T-test (LP vs. EAP) or independent T-test (HPC vs. LPC) was used after accessing normality with Shapiro–Wilk W-test to analyze serum biochemical indices differences. The correlations between microbial abundance at the genus level and serum biochemical indices were evaluated by Spearman’s correlation analysis. P < 0.05, ∗∗P < 0.01. HPC, high productive capacity; LPC, low productive capacity; BUN, blood urea nitrogen; CREA, creatinine; TG, triglyceride; HDL-C, high-density lipoprotein cholesterol; LDL-C, low-density lipoprotein cholesterol; GLU, glucose; AST, aspartate aminotransferase; ALT, alanine aminotransferase; TP, total protein; ALB, albumin; GLO, globulin; A/G, ration of albumin/globulin; CHO, cholesterol.

References

    1. Ajouz H., Mukherji D., Shamseddine A. (2014). Secondary bile acids: an underrecognized cause of colon cancer. World J. Surg. Oncol 12:164. 10.1186/1477-7819-12-164 - DOI - PMC - PubMed
    1. Alexopoulos C., Georgoulakis I., Tzivara A., Kritas S., Siochu A., Kyriakis S. (2004). Field evaluation of the efficacy of a probiotic containing Bacillus licheniformis and Bacillus subtilis spores, on the health status and performance of sows and their litters. J. Anim. Physiol. Anim. Nutr. 88 381–392. 10.1111/j.1439-0396.2004.00492.x - DOI - PubMed
    1. Bäckhed F., Ley R. E., Sonnenburg J. L., Peterson D. A., Gordon J. I. (2005). Host-bacterial mutualism in the human intestine. Science 307 1915–1920. 10.1126/science.1104816 - DOI - PubMed
    1. Bäckström L. (1973). Environment and animal health in piglet production. a field study of incidences and correlations. Acta Vet. Scand. Suppl. 41 1–240. - PubMed
    1. Barbour L. A., McCurdy C. E., Hernandez T. L., Kirwan J. P., Catalano P. M., Friedman J. E. (2007). Cellular mechanisms for insulin resistance in normal pregnancy and gestational diabetes. Diabetes Care (Suppl. 2):S112-9. 10.2337/dc07-s202 - DOI - PubMed

LinkOut - more resources