Gut Microbiota Are Associated With Psychological Stress-Induced Defections in Intestinal and Blood-Brain Barriers
- PMID: 32010111
- PMCID: PMC6974438
- DOI: 10.3389/fmicb.2019.03067
Gut Microbiota Are Associated With Psychological Stress-Induced Defections in Intestinal and Blood-Brain Barriers
Abstract
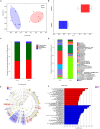
Altered gut microbiota has been identified during psychological stress, which causes severe health issues worldwide. The integrity of the intestinal barrier and blood-brain barrier regulates the process of bacterial translocation and can supply the nervous system with real-time information about the environment. However, the association of gut microbiota with psychological stress remains to be fully interpreted. In this study, we established a psychological stress model using an improved communication box and compared the expression of tight junction proteins in multiple regions of the intestinal (duodenum, jejunum, ileum) and blood-brain (amygdala, hippocampus) barriers between model and control rats. We also conducted fecal microbiota analysis using 16S rRNA gene sequencing. Expression levels of the stress-related indicators adrenocorticotropic hormone, NR3C1,2, and norepinephrine were increased in the model group compared to control group. Psychological stress reduced brain and intestinal levels of tight junction proteins, including claudin5, occludin, α-actin, and ZO-1. Microbiota analysis revealed elevated microbial diversity and fecal proportions of Intestinimonas, Catenisphaera, and Globicatella in the model group. Further analysis indicated a negative correlation of Allisonella and Odoribacter, as well as a positive correlation of norank_f__Peptococcaceae, Clostridium_sensu_stricto_1, and Coprococcus_2, with claudin5, occludin, α-actin, and ZO-1. Our use of a rodent model to explore the association between compromised intestinal and blood-brain barriers and altered fecal microbiota under psychological stress improves our understanding of the gut-brain axis. Here, cues converge to control basic developmental processes in the intestine and brain such as barrier function. This study provides new directions for investigating the pathogenesis of emotional disorders and the formulation of clinical treatment.
Keywords: blood–brain barrier; communication box; dysbiosis; gut microbiota; intestinal barrier; psychological stress; tight junction.
Copyright © 2020 Geng, Yang, Cheng, Zhang, Li, Liu, Li, Chen, Bao, Chen, Fei, Li, Hou, Lin, Liu, Zhang, Wang, Zhang, Wang, Wang and Zhang.
Figures


Similar articles
-
27-Hydroxycholesterol contributes to cognitive deficits in APP/PS1 transgenic mice through microbiota dysbiosis and intestinal barrier dysfunction.J Neuroinflammation. 2020 Jun 27;17(1):199. doi: 10.1186/s12974-020-01873-7. J Neuroinflammation. 2020. PMID: 32593306 Free PMC article.
-
Probiotic alleviate fluoride-induced memory impairment by reconstructing gut microbiota in mice.Ecotoxicol Environ Saf. 2021 Jun 1;215:112108. doi: 10.1016/j.ecoenv.2021.112108. Epub 2021 Mar 30. Ecotoxicol Environ Saf. 2021. PMID: 33799132
-
Poria cocos Polysaccharide Ameliorated Antibiotic-Associated Diarrhea in Mice via Regulating the Homeostasis of the Gut Microbiota and Intestinal Mucosal Barrier.Int J Mol Sci. 2023 Jan 11;24(2):1423. doi: 10.3390/ijms24021423. Int J Mol Sci. 2023. PMID: 36674937 Free PMC article.
-
Chronic stress-induced gut dysfunction exacerbates Parkinson's disease phenotype and pathology in a rotenone-induced mouse model of Parkinson's disease.Neurobiol Dis. 2020 Feb;135:104352. doi: 10.1016/j.nbd.2018.12.012. Epub 2018 Dec 21. Neurobiol Dis. 2020. PMID: 30579705 Review.
-
Stress and the gut-brain axis: an inflammatory perspective.Front Mol Neurosci. 2024 Jul 18;17:1415567. doi: 10.3389/fnmol.2024.1415567. eCollection 2024. Front Mol Neurosci. 2024. PMID: 39092201 Free PMC article. Review.
Cited by
-
Gut Microbiota Interaction with the Central Nervous System throughout Life.J Clin Med. 2021 Mar 21;10(6):1299. doi: 10.3390/jcm10061299. J Clin Med. 2021. PMID: 33801153 Free PMC article. Review.
-
Diet quality and anxiety: a critical overview with focus on the gut microbiome.Front Nutr. 2024 May 15;11:1346483. doi: 10.3389/fnut.2024.1346483. eCollection 2024. Front Nutr. 2024. PMID: 38812941 Free PMC article.
-
Microbiome Shifts and Their Impact on Gut Physiology in Irritable Bowel Syndrome.Int J Mol Sci. 2024 Nov 19;25(22):12395. doi: 10.3390/ijms252212395. Int J Mol Sci. 2024. PMID: 39596460 Free PMC article. Review.
-
Effects of ultrasound-induced stress on gut microbiota of mice.Vet World. 2023 May;16(5):929-938. doi: 10.14202/vetworld.2023.929-938. Epub 2023 May 7. Vet World. 2023. PMID: 37576770 Free PMC article.
-
Alternative splicing in mouse brains affected by psychological stress is enriched in the signaling, neural transmission and blood-brain barrier pathways.Mol Psychiatry. 2023 Nov;28(11):4707-4718. doi: 10.1038/s41380-023-02103-1. Epub 2023 May 23. Mol Psychiatry. 2023. PMID: 37217679
References
-
- Bailey M. T., Dowd S. E., Galley J. D., Hufnagle A. R., Allen R. G., Lyte M., et al. (2011). Exposure to a social stressor alters the structure of the intestinal microbiota: implications for stressor-induced immunomodulation. Brain Behav. Immun. 25 397–407. 10.1016/j.bbi.2010.10.023 - DOI - PMC - PubMed
LinkOut - more resources
Full Text Sources

