. 2020 Jan 17:10:3081.
doi: 10.3389/fmicb.2019.03081. eCollection 2019.

Proteomic Profiling Reveals the Architecture of Granulomatous Lesions Caused by Tuberculosis and Mycobacterium avium Complex Lung Disease

Affiliations

Proteomic Profiling Reveals the Architecture of Granulomatous Lesions Caused by Tuberculosis and Mycobacterium avium Complex Lung Disease

Shintaro Seto et al. Front Microbiol. .

Abstract

Tuberculosis (TB) and Mycobacterium avium complex lung disease (MAC-LD) are both characterized pathologically by granuloma lesions, which are typically composed of a necrotic caseum at the center surrounded by fibrotic cells and lymphocytes. Although the histological characterization of TB and MAC-LD granulomas has been well-documented, their molecular signatures have not been fully evaluated. In this research we applied mass spectrometry-based proteomics combined with laser microdissection to investigate the unique protein markers in human mycobacterial granulomatous lesions. Comparing the protein abundance between caseous and cellular sub-compartments of mycobacterial granulomas, we found distinct differences. Proteins involved in cellular metabolism in transcription and translation were abundant in cellular regions, while in caseous regions proteins related to antimicrobial response accumulated. To investigate the determinants of their heterogeneity, we compared the protein abundance in caseous regions between TB and MAC-LD granulomas. We found that several proteins were significantly abundant in the MAC-LD caseum of which proteomic profiles were different from those of the TB caseum. Immunohistochemistry demonstrated that one of these proteins, Angiogenin, specifically localized to the caseous regions of selected MAC-LD granulomas. We also detected peptides derived from mycobacterial proteins in the granulomas of both diseases. This study provides new insights into the architecture of granulomatous lesions in TB and MAC-LD.

Keywords: Mycobacterium avium complex lung disease; granuloma; necrotic caseum; proteomics; tuberculosis.


Figures

FIGURE 1
FIGURE 1
Comprehensive identification of proteins composing mycobacterial granulomatous lesions by a combination of LMD and MS-based proteomics. Representative hematoxylin-eosin (HE)-stained images of granulomatous lesions with necrotic caseum surrounded by fibrotic cells and lymphocytes caused by TB (A) or MAC-LD (B). Granulomatous sub-compartments were separately collected by LMD followed by processing for MS-based proteomics. The boundary line between the sub-compartment of necrotic caseum and that of fibrotic cells and lymphocytes is shown (yellow dots). (C) Boxplot of the number of identified protein groups with LFQ values from granulomatous sub-compartments of necrotic caseum (Caseum), and fibrotic cells and lymphocytes (Cell) from TB (MTB) and MAC-LD (MAC) granulomas. Bold lines indicate the median of identified protein numbers, a box captures 50% of the measurements, and whiskers span values of the 5–95% interval. The number of proteins identified in each sample is also plotted. (D) Venn diagrams comparing the number of identified proteins in mycobacterial granulomatous lesions. The numbers of proteins detected in at least one sample among sub-compartments are indicated. The protein numbers identified from TB and MAC-LD granulomas (left), caseous and cellular sub-compartments of granulomas (middle) or four mycobacterial granulomatous sub-compartments (right) are indicated. MTB caseum; necrotic caseum from TB granuloma, MTB cell; cellular region from TB granuloma, MAC caseum; necrotic caseum from MAC-LD granuloma, MAC cell; cellular region from MAC-LD granuloma. (E) GO terms related to biological processes of identified proteins in granulomatous sub-compartments. The proportions of annotated protein numbers related to indicated GO terms are presented.
FIGURE 2
FIGURE 2
Quantitative profiling of identified proteins in granulomatous sub-compartments. (A) Boxplot of LFQ intensity values of identified proteins in the samples. Log2-transformed LFQ intensity values of identified proteins in each sample are shown. Bold lines indicate the median of log2-transformed LFQ intensity values, a box captures 50% of the measurements, and whiskers span values of the 5–95% interval. Outliers are shown as dots. (B) Heatmap of Pearson correlation coefficient (PCC) matrix of all samples. The values of PCC were generated using the log2-transformed LFQ values from all pairwise correlation among the samples. Coefficient numbers are also indicated. (C) Principal component analysis (PCA) of all samples based on LFQ intensity values. The first two main components, PC1 and PC2, accounting for 41.3 and 10.8% of data variability from all samples, are used for the plot. (D) Hierarchical-clustering-based heatmap for identified proteins between granulomatous sub-compartments (n = 2812).
FIGURE 3
FIGURE 3
Dynamics of protein composition in granulomatous sub-compartments. (A) Volcano plot of protein abundance between caseous and cellular sub-compartments of granulomatous lesions combined with both TB and MAC-LD. The logarithmic ratios of average fold changes and negative logarithmic FDR values of the Welch’s t-test between samples from caseous and cellular sub-compartments are plotted on the x- and y-axes, respectively. Highlighting dots correspond to proteins with significantly different abundance (FDR < 0.05 and absolute value of fold change > 5). (B) Hierarchical-clustering-based heatmap for proteins with different abundance between granulomatous sub-compartments (n = 484). GO terms related to biological processes of significantly abundant proteins in Caseum (C) or Cell (D). Top 20 ranked GO terms are listed. The proportion of identified protein numbers related to indicated GO terms and FDR are also shown.
FIGURE 4
FIGURE 4
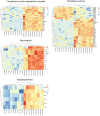
Heatmap based on LFQ intensity values of selected proteins. Hierarchical-clustering-based on LFQ intensity values of proteins involved in complement and coagulase cascades, neutrophils, apolipoproteins and peptidase activity are presented. Names of proteins involved in the pathways are also indicated.
FIGURE 5
FIGURE 5
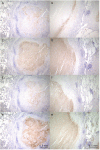
Immunohistochemistry of proteins abundant in the caseous regions. FFPE are stained with anti-Fibrinogen gamma antibody (A,B), anti-S100A9 antibody (C,D), anti-ApoE antibody (E,F) or anti-Vitronectin antibody (G,H). Images of granulomatous lesions from TB (A,C,E,G) or MAC-LD (B,D,F,H) are shown.
FIGURE 6
FIGURE 6
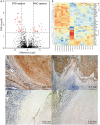
Heterogeneity of MAC-LD granulomatous lesions. (A) Volcano plot of protein abundance between TB caseum and selected MAC-LD caseum. The logarithmic ratios of average fold changes and negative logarithmic FDR values of the Welch’s t-test between samples from TB caseum and selected MAC-LD caseum are plotted on the x- and y-axes, respectively. Highlighted dots correspond to proteins with significantly different abundance (FDR < 0.05 and absolute value of fold change > 5). (B) Hierarchical-clustering-based heat map for proteins with significantly different abundance between TB caseum and selected MAC-LD caseum (n = 44). Protein names with significantly different abundance in the caseous sub-compartments from TB or MAC-LD are indicated. Proteins with significant abundance in the selected MAC-LD caseum (P < 0.05, Tukey–Kramer post hoc test following one-way ANOVA). Immunohistochemistry of Angiogenin in granulomatous lesions of selected MAC-LD (C,D), non-selected MAC-LD (E) and TB (F).
FIGURE 7
FIGURE 7
Proteomic profiling of proteins derived from M. tuberculosis in granulomatous lesions. (A) Boxplot of the number of identified M. tuberculosis proteins with LFQ values from MTB granulomatous sub-compartments. Bold lines indicate the median of identified number in the granulomatous sub-compartments, a box captures 50% of the measurements, and whiskers span values of the 5–95% interval. The protein number identified in each sample is also plotted. (B) Venn diagrams comparing the number of identified M. tuberculosis proteins in granulomatous lesions. The numbers of proteins detected in at least one sample among sub-compartments are indicated. (C) Boxplot of LFQ intensity values of identified M. tuberculosis proteins in samples. Bold lines indicate the median of log2-transformed LFQ intensity values, a box captures 50% of the measurements, and whiskers span values of the 5–95% interval. Outliers are shown as dots. (D) Volcano plot of protein abundance of identified M. tuberculosis proteins between TB granulomatous sub-compartments. The logarithmic ratios of average fold changes and negative logarithmic FDR values of the Welch’s t-test between samples from caseous and cellular sub-compartments are plotted on the x- and y-axes, respectively. Highlighting dots correspond to M. tuberculosis proteins with significantly different abundance (FDR < 0.05 and absolute value of fold change > 5). (E) Hierarchical-clustering-based heat map for M. tuberculosis with different abundance between the sub-compartments of TB granulomatous lesions (n = 20). Names of M. tuberculosis proteins with significantly different abundance are indicated.
FIGURE 8
FIGURE 8
Proteomic profiles of proteins derived from MAC in granulomatous lesions. (A) The average number and standard deviation of identified MAC proteins with LFQ values from MAC-LD granulomatous sub-compartments. (B) Venn diagrams comparing the number of identified MAC proteins in granulomatous lesions. The numbers of proteins detected in at least one sample among sub-compartments are indicated. (C) Volcano plot of protein abundance of identified MAC proteins between granulomatous sub-compartments. The logarithmic ratios of average fold changes and negative logarithmic FDR values of the Welch’s t-test between samples from caseous and cellular sub-compartments are plotted on the x- and y-axes, respectively.

Similar articles

Cited by

References

    1. Adjemian J., Olivier K. N., Seitz A. E., Holland S. M., Prevots D. R. (2012). Prevalence of nontuberculous mycobacterial lung disease in U.S. Medicare beneficiaries Am. J. Respir. Crit. Care Med. 185 881–886. - PMC - PubMed
    1. Chitale S., Ehrt S., Kawamura I., Fujimura T., Shimono N., Anand, et al. (2001). Recombinant Mycobacterium tuberculosis protein associated with mammalian cell entry. Cell. Microbiol. 3 247–254. - PubMed
    1. Cook J. L. (2010). Nontuberculous mycobacteria: opportunistic environmental pathogens for predisposed hosts. Br. Med. Bull. 96 45–59. 10.1093/bmb/ldq035 - DOI - PubMed
    1. Cox J., Hein M. Y., Luber C. A., Paron I., Nagaraj N., Mann M. (2014). Accurate proteome-wide label-free quantification by delayed normalization and maximal peptide ratio extraction, termed MaxLFQ. Mol. Cell. Proteomics 13 2513–2526. 10.1074/mcp.M113.031591 - DOI - PMC - PubMed
    1. Cox J., Mann M. (2008). MaxQuant enables high peptide identification rates, individualized p.p.b.-range mass accuracies and proteome-wide protein quantification. Nat. Biotechnol. 26 1367–1372. 10.1038/nbt.1511 - DOI - PubMed