. 2020 Jan 15:10:3008.
doi: 10.3389/fimmu.2019.03008. eCollection 2019.

egc Superantigens Impair Monocytes/Macrophages Inducing Cell Death and Inefficient Activation

Affiliations

egc Superantigens Impair Monocytes/Macrophages Inducing Cell Death and Inefficient Activation

Sofia Noli Truant et al. Front Immunol. .

Abstract

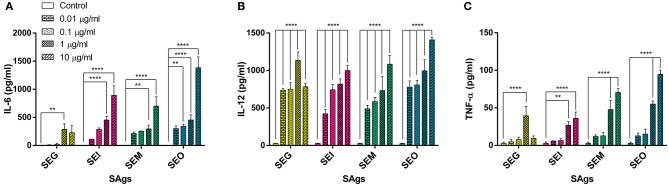
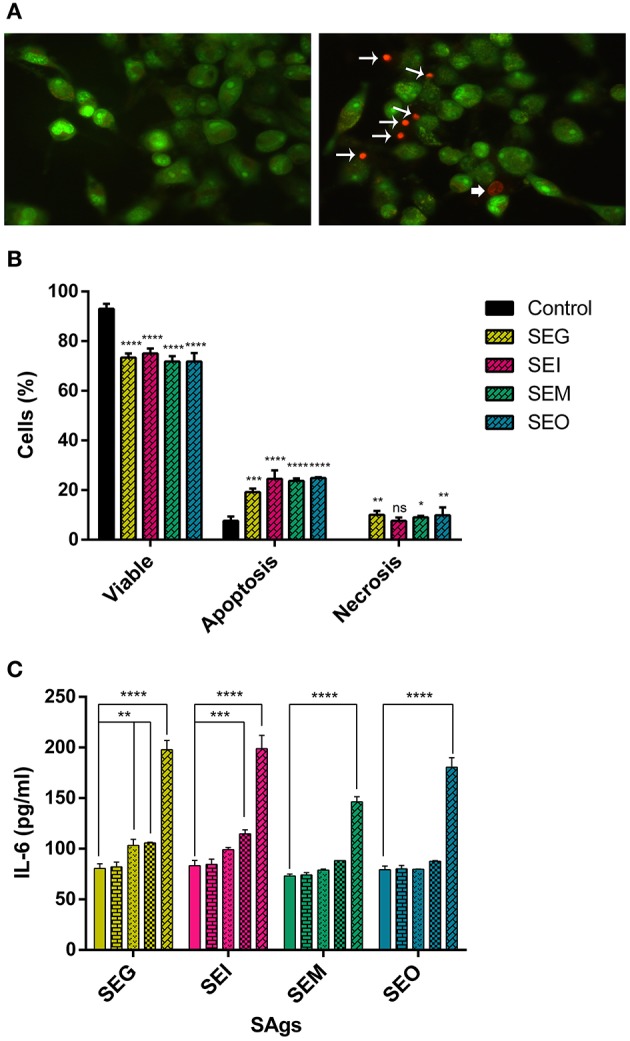
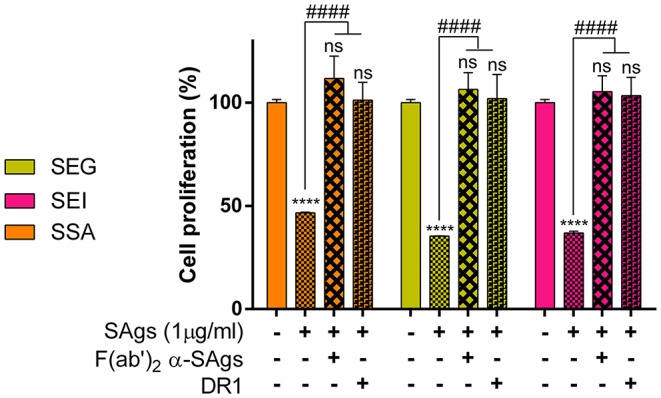
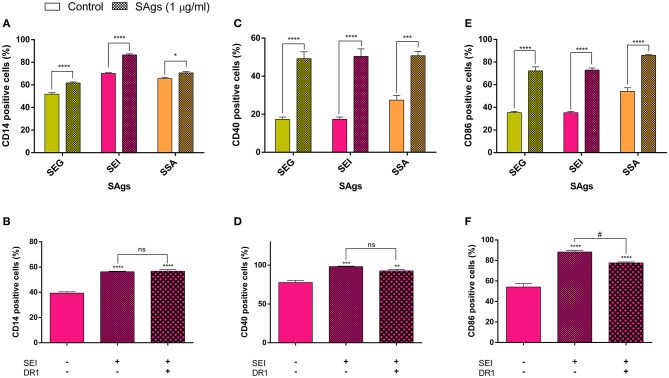
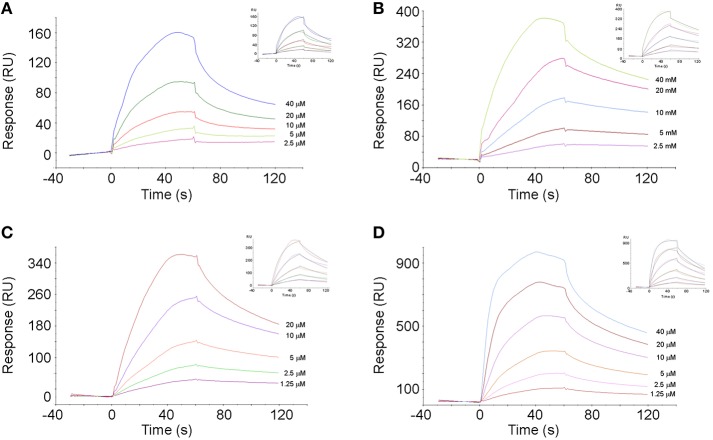
Bacterial superantigens (SAgs) are enterotoxins that bind to MHC-II and TCR molecules, activating as much as 20% of the T cell population and promoting a cytokine storm which enhances susceptibility to endotoxic shock, causing immunosuppression, and hindering the immune response against bacterial infection. Since monocytes/macrophages are one of the first cells SAgs find in infected host and considering the effect these cells have on directing the immune response, here, we investigated the effect of four non-classical SAgs of the staphylococcal egc operon, namely, SEG, SEI, SEO, and SEM on monocytic-macrophagic cells, in the absence of T cells. We also analyzed the molecular targets on APCs which could mediate SAg effects. We found that egc SAgs depleted the pool of innate immune effector cells and induced an inefficient activation of monocytic-macrophagic cells, driving the immune response to an impaired proinflammatory profile, which could be mediated directly or indirectly by interactions with MHC class II. In addition, performing surface plasmon resonance assays, we demonstrated that non-classical SAgs bind the gp130 molecule, which is also present in the monocytic cell surface, among other cells.

Keywords: MHC-II; THP-1; gp130; innate immune response; monocytes; superantigens.


Figures

Figure 1
Figure 1
Amino acid alignment and structure of SEG variants. (A) SEG sequence labeled as consensus has been reported in four strains (N315, Q8RR77, Mu50, and FRI572) (18, 64, 71). Group A includes strains 40900, 41026, 41226, and 41399. Group B includes strains 41395, 41668, and 41664. Fc30 is used as reference for pediatric isolates as reported by (45). Identical residues are shown in red. Arrows show sequence sites containing mutations. Sites where a unique sequence is mutated are shown in yellow, and mutated amino acids in two sequences are shown in white. (B) Overall structure of SEG (pdb 1XXG). Mutations are colored in blue, MHC-II binding site in yellow, and TCR binding site in green.
Figure 2
Figure 2
SAgs inhibit proliferation of THP-1 cells. THP-1 cells were incubated with Sags, and proliferation by [3H]-thymidine was evaluated at 48 h. Results are expressed as the percentage of proliferation related to untreated conditions. Data are expressed as the mean ± SEM of at least three independent experiments. Asterisks represent statistical significance with respect to untreated cells: ***p < 0.001, ****p < 0.0001.
Figure 3
Figure 3
SAgs of the egc operon induced monocytic cell death. (A) After 48 h of incubation with SAgs, THP-1 cells were labeled with fluorescent antibodies and observed under the microscope; DNA is shown in blue and SAgs in green. In the first column, images in bright field are shown. The upper panel shows the control condition with untreated cells. In the middle and lower panels, monocytes treated with SAgs are shown. In the middle panel, control 2, cells were incubated with a normal mouse serum and then stained with fluorescent antibodies. In all cases, representative images are shown. (B) Cellular complexity was determined as an increment of cells in the upper quadrants of FSC vs. SCC dot plot. THP-1 cell complexity was assessed by flow cytometry after 48 h of incubation with SAgs. For this purpose, THP-1 cells were gated for singlets, and then the monocytic population was evaluated by FSC and SCC. Values are expressed as percentage of cells in the upper quadrants. Representative dot plots are shown on the right. (C) THP-1 cells were incubated with SAgs for 48 h and then stained with FDA/PI. In this case, after singlet cell and monocytic population selection, the percentage of PI+ cells was measured for every SAg treatment and its basal. Values are expressed as the percentage of PI+ cells. Representative histograms are shown on the right. Data are expressed as the mean ± SEM of at least three independent experiments. Asterisks represent statistical significance with respect to untreated cells: *p < 0.05, **p < 0.01, ***p < 0.001, ****p < 0.0001.
Figure 4
Figure 4
SAgs induced cell death in THP-1 cells by different mechanisms. After 48 h of incubation with SAgs, THP-1 cells were incubated with Annexin V-PE and 7AAD, and the proportion of positive cells was measured before the singlet and monocytic population gating strategy. Values are expressed as the percentages of 7AAD positive cells (A), Annexin V positive cells (B), and Annexin V-positive/7AAD-negative cells (C). Data are expressed as the mean ± SEM of at least three independent experiments. Asterisks represent statistical significance with respect to untreated cells: **p < 0.01, ***p < 0.001, ****p < 0.0001, ns, non-significant difference.
Figure 5
Figure 5
SAgs induced cell death in THP-1 cells by apoptosis and some necrosis. Acridine orange-ethidium bromide staining of monocytic cells (THP-1) under different treatment conditions (representative images). (A) Control THP-1 cells (left panel) and SAgs treatment (right panel) are shown. Asterisks indicate early apoptosis cells, regular arrows show late apoptosis cells, and wide arrows show necrosis. (B) Viability and type of death percentage of THP-1 cells treated with SAgs or untreated (control). The result is based on the analysis of live and apoptotic/necrotic cells following acridine orange-ethidium bromide (AO/EtBr) staining. (C) Analysis of LDH assay of THP-1 cells treated with SAgs or left untreated. *p < 0.05, ***p < 0.001, ****p < 0.0001.
Figure 6
Figure 6
All SAgs induced production of pro-inflammatory cytokines by THP-1 cells. Cytokines were measured in supernatants of treated cells; values are expressed in pg/ml. IL-6 (A), IL-12 (B), and TNF-α (C) production is shown. No production of IL-10, IL-17, or IFN-γ was detected in any case. Data are expressed as the mean ± SEM of at least three independent experiments. Asterisks represent statistical significance with respect to untreated cells: **p < 0.01, ****p < 0.0001.
Figure 7
Figure 7
PMA THP-1 differentiated cells are more sensitive than THP-1 cells to the SAg effect. Acridine orange-ethidium bromide staining of PMA-treated THP-1 cells under different treatment conditions (representative images). (A) Control THP-1/PMA cells (left panel) and SAgs treatment (right panel) are shown. Asterisks indicate early apoptosis cells, regular arrows show late apoptosis cells, and wide arrows show necrosis. (B) Viability and type of death percentage of THP-1/PMA cells treated with SAgs or untreated (control). The result is based on the analysis of live and apoptotic/necrotic cells following acridine orange-ethidium bromide (AO/EtBr) staining. (C) Cytokines were measured in supernatants by ELISA; production of IL-6 is shown. Values are expressed in pg/ml. Data are expressed as the mean ± SEM of at least three independent experiments. Asterisks represent statistical significance with respect to untreated cells: *p < 0.05, **p < 0.01, ***p < 0.001, ****p < 0.0001.
Figure 8
Figure 8
Inhibition of cell proliferation is prevented when SAgs are preincubated with HLA-DR1 or F(ab)'2. THP-1 cells were incubated with SAgs alone or with SAgs preincubated with DR1 or F(ab)'2 α-Sags, and proliferation was evaluated by [3H]-thymidine at 48 h. Results are expressed as the percentage of proliferation related to untreated condition (basal) for each SAg. In this experiment and the following, only the most studied egc SAgs, SEG, and SEI and streptococcal SSA were assessed. Data are expressed as the mean ± SEM of at least three independent experiments. Asterisks represent statistical significance with respect to the untreated cells in each treatment: ****p < 0.0001, ns, non-significant difference. Hashes represent statistical significance with respect to cells treated only with SAgs in each treatment: ####p < 0.0001.
Figure 9
Figure 9
SAgs affect the expression of cluster differentiation (CD) markers. THP-1 monocytic cells were treated for 48 h with SAgs and then were incubated with antibodies to CD14 (A), CD40 (C), and CD86 (E). Moreover, using SEI as a representative SAg, we performed the same assay with pre-incubation of SEI with DR1 in order to evaluate its effect on CD expression (B,D,F). Specific interaction of SEI and tSEI was evaluated by SPR. Cytometry results were expressed as the percentage of positive cells for each marker. Data are expressed as the mean ± SEM of at least three independent experiments. Asterisks represent statistical significance with respect to the untreated cells in each treatment: *p < 0.05, **p < 0.01, ***p < 0.001, ****p < 0.0001, ns, non-significant difference. Hashes represent statistical significance with respect to treated cells with SAgs alone: #p < 0.05, ns, non-significant difference.
Figure 10
Figure 10
Specific interaction of SAgs with gp130. Sensorgrams of gp130–SAgs interaction are shown. Specific interaction between gp130 and SEG (A), SEI (B), SEM (C), and SEO (D) are shown. The adjustments of experimental data to an interaction model 1:1 are shown as insets.

References

    1. Chesney PJ. Clinical aspects and spectrum of illness of TSS: overview. Cli Infect Dis. (1989) 11:S1–7. 10.1093/clinids/11.Supplement_1.S1 - DOI - PubMed
    1. Tong SYC, Davis JS, Eichenberger E, Holland TL, Fowler VG. Staphylococcus aureus infections: epidemiology, pathophysiology, clinical manifestations, and management. Clin Microbiol Rev. (2015) 28:603–61. 10.1128/CMR.00134-14 - DOI - PMC - PubMed
    1. Lowy FD. Staphylococcus aureus Infections. New Engl J Med. (1998) 339: 520–32. 10.1056/nejm199808203390806 - DOI - PubMed
    1. Yew MS, Leong WM. Contemporary management and outcomes of infective tunnelled haemodialysis catheter-related right atrial thrombi: a case series and literature review. Singapore Med J. (2019) 1–15. - PMC - PubMed
    1. Fraser JD, Proft T. The bacterial superantigen and superantigen-like proteins. Immunol Rev. (2008) 225:226–43. 10.1111/j.1600-065X.2008.00681.x - DOI - PubMed

Publication types

MeSH terms

Substances