Clinical Trial
. 2020 Jan 15:10:3090.
doi: 10.3389/fimmu.2019.03090. eCollection 2019.

Lymphoid Aggregates in the CNS of Progressive Multiple Sclerosis Patients Lack Regulatory T Cells

Affiliations
Clinical Trial

Lymphoid Aggregates in the CNS of Progressive Multiple Sclerosis Patients Lack Regulatory T Cells

Luisa Bell et al. Front Immunol. .

Abstract

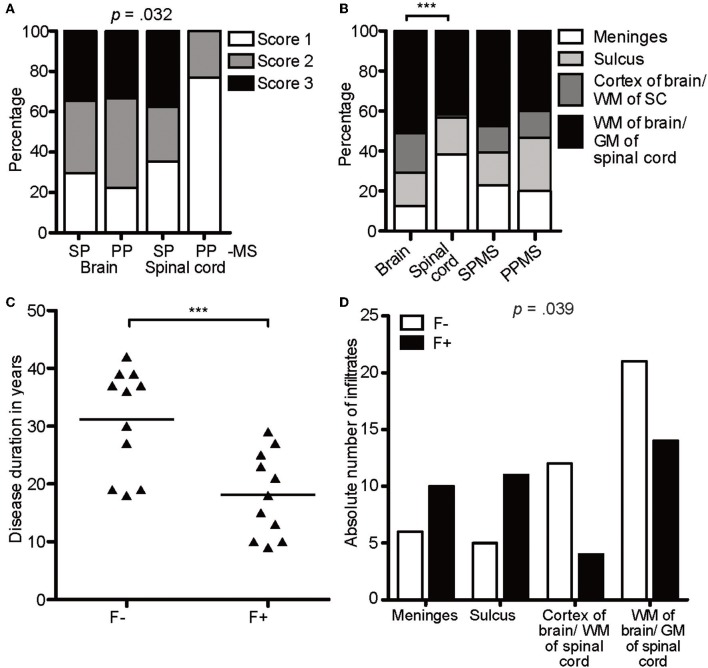
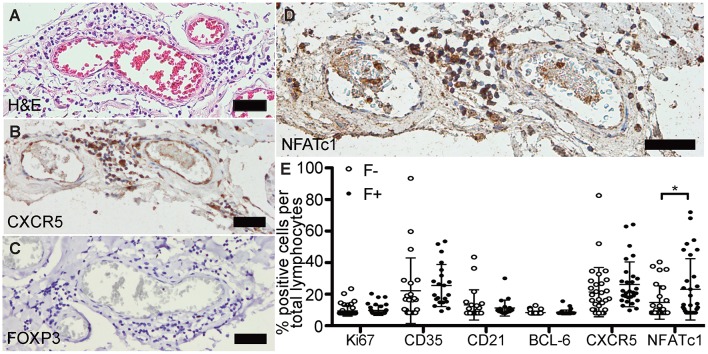
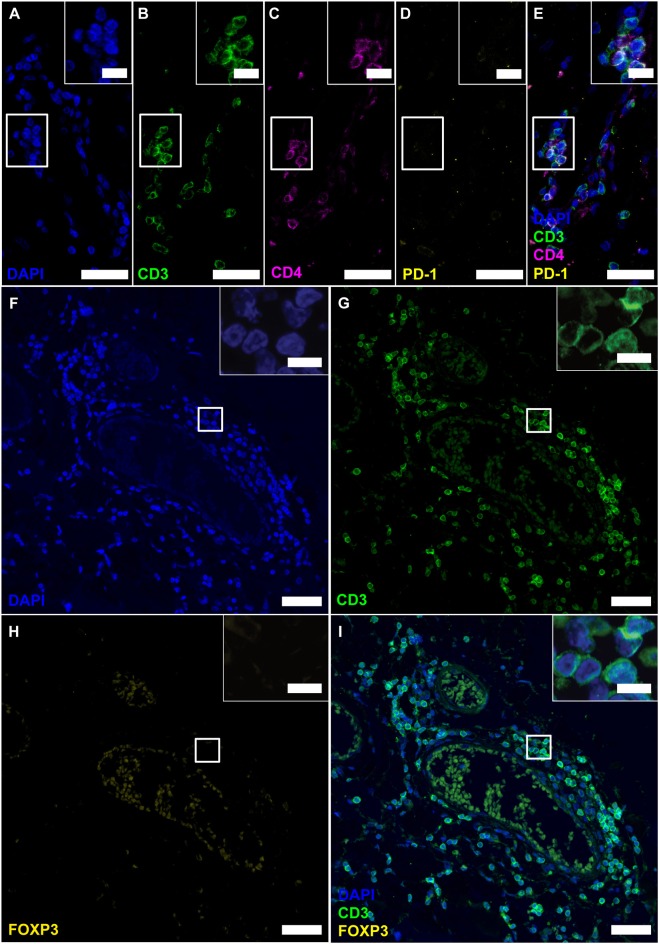
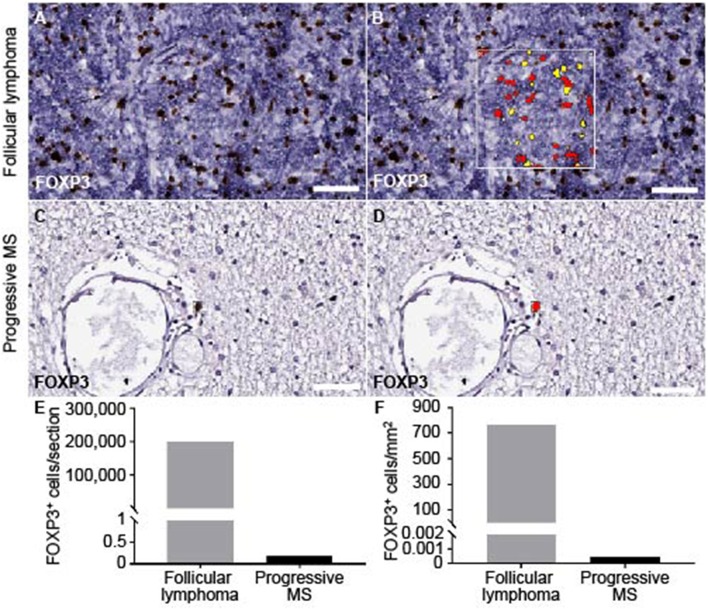
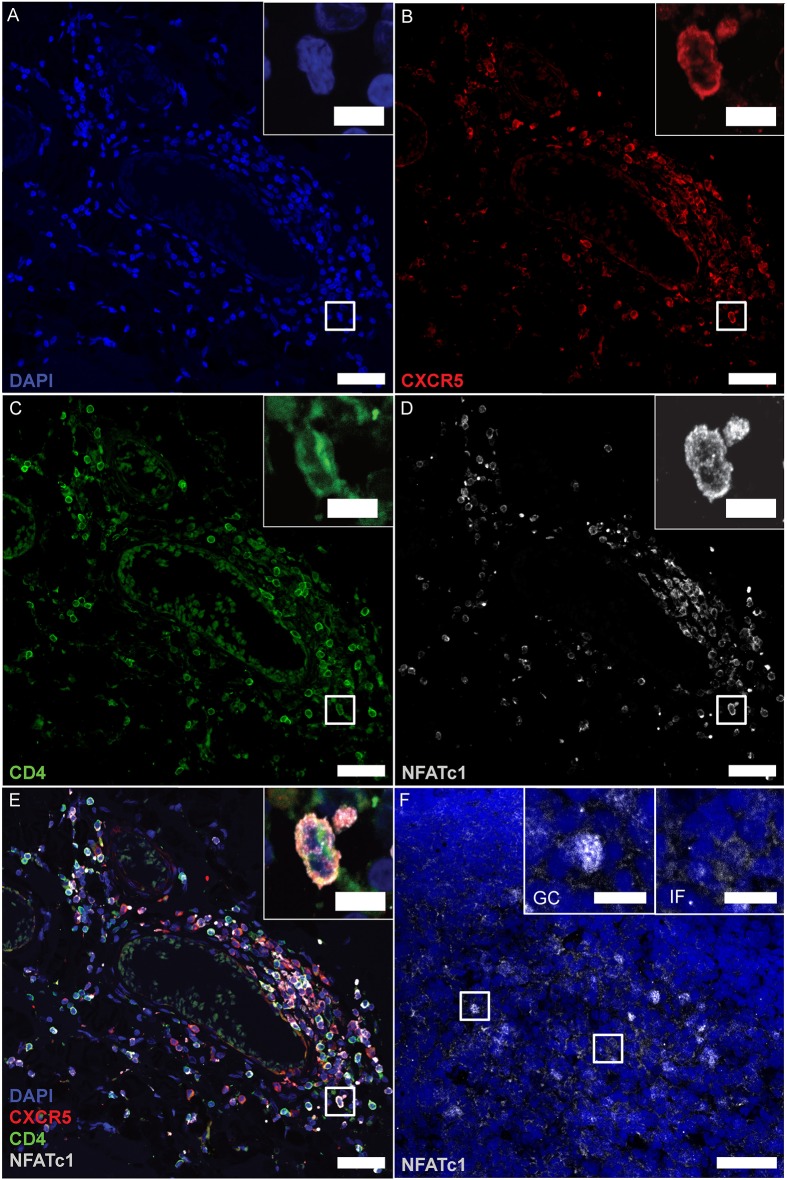
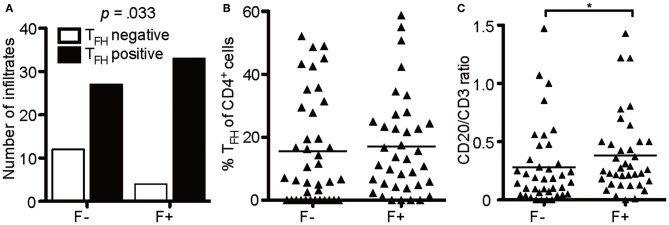
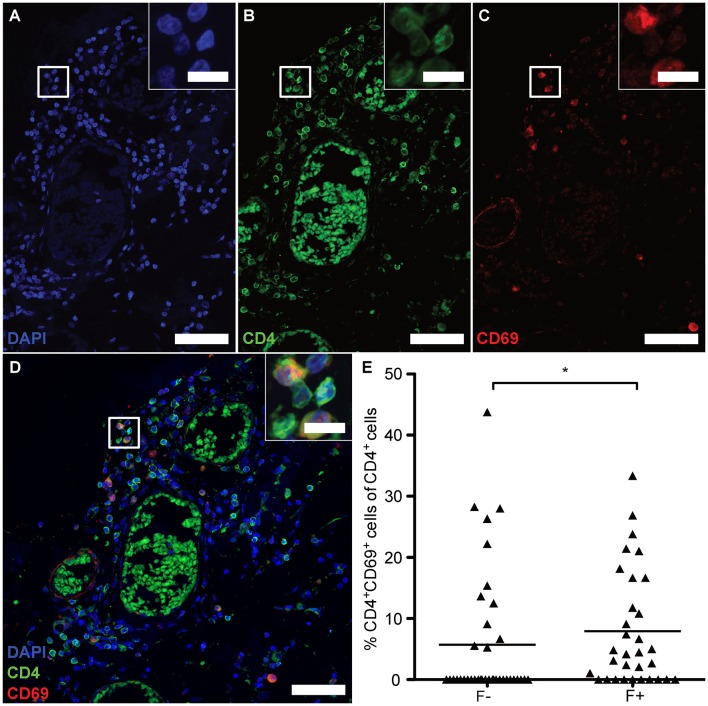
In gray matter pathology of multiple sclerosis, neurodegeneration associates with a high degree of meningeal inflammatory activity. Importantly, ectopic lymphoid follicles (eLFs) were identified at the inflamed meninges of patients with progressive multiple sclerosis. Besides T lymphocytes, they comprise B cells and might elicit germinal center (GC)-like reactions. GC reactions are controlled by FOXP3+ T-follicular regulatory cells (TFR), but it is unknown if they participate in autoantibody production in eLFs. Receiving human post-mortem material, gathered from autopsies of progressive multiple sclerosis patients, indeed, distinct inflammatory infiltrates enriched with B cells could be detected in perivascular areas and deep sulci. CD35+ cells, parafollicular CD138+ plasma cells, and abundant expression of the homing receptor for GCs, CXCR5, on lymphocytes defined some of them as eLFs. However, they resembled GCs only in varying extent, as T cells did not express PD-1, only few cells were positive for the key transcriptional regulator BCL-6 and ongoing proliferation, whereas a substantial number of T cells expressed high NFATc1 like GC-follicular T cells. Then again, predominant cytoplasmic NFATc1 and an enrichment with CD3+CD27+ memory and CD4+CD69+ tissue-resident cells implied a chronic state, very much in line with PD-1 and BCL-6 downregulation. Intriguingly, FOXP3+ cells were almost absent in the whole brain sections and CD3+FOXP3+ TFRs were never found in the lymphoid aggregates. This also points to less controlled humoral immune responses in those lymphoid aggregates possibly enabling the occurrence of CNS-specific autoantibodies in multiple sclerosis patients.

Keywords: NFATc1; T-follicular regulatory cell; ectopic lymphoid follicle; lymphoid aggregate; meningeal inflammation; progressive multiple sclerosis.


Figures

Figure 1
Figure 1
Ectopic lymphoid structures in progressive MS are characterized by infiltration of lymphocytes, FDCs and plasma cells. (A) Parenchyma of FFPE sections of brain and spinal cord of progressive MS patients were screened for infiltrated regions by H&E staining. (B) IF staining for CD3+ T cells and CD20+ B cells on serial sections were used to determine the infiltration score. Score 0, no or <5 lymphocytes; score 1, at least five but <30 lymphocytes; score 2, 31 to 60 lymphocytes; score 3, more than 60 lymphocytes. (C) Meninges and sulci of FFPE sections of brain and spinal cord of progressive MS patients were screened for infiltrated regions by H&E staining. (D) IF staining for CD3+ T cells and CD20+ B cells on serial sections were used to determine the infiltration score. Score 0, no or <5 lymphocytes; score 1, at least five, but <30 lymphocytes; score 2, 31 to 60 lymphocytes; score 3, more than 60 lymphocytes. (E) Whole slides were screened for infiltration on H&E, representative infiltration area depicted in the box (F), and serial sections were stained, depicted in the box (G–O). eLFs are characterized by (G) CD3+ T cells and CD20+ B cells, (H) CD4+ T cells and CD138+ plasma cells, (I) CD3+ T and CD3+CD4+ T helper cells (J) Ki67+ proliferating cells, (K) CD35+ and, (L) CD21+ FDCs, (M) CD68+ macrophages as well as (N) BCL-6+ and (O) CXCR5+ GC-like lymphocytes. (P) CD3+CD8+ cytotoxic T cells as well as some CD3+CD27+ memory T cells were also present in eLFs. Scale bars (A–D), (F) indicate 100 μm; (E) indicates 2,000 μm; (G–P) indicate 50 μm.
Figure 2
Figure 2
CXCR5-rich lymphoid aggregates are most prominent within meninges of SPMS patients. (A) Percentage of score infiltration in SPMS and PPMS in CAL brain and spinal cord. SPMS brain infiltrates, n = 78; SPMS spinal cord, n = 48; PPMS brain, n = 9; PPMS spinal cord, n = 13. Chi-square test, X2(6) = 13.77, p = 0.032, d = 0.641. (B) Percentage of regional infiltration in meninges, sulcus, cortex of the brain/WM of the spinal cord and parenchyma of the brain/GM of the spinal cord in CAL SPMS and PPMS. SPMS, n = 145; PPMS, n = 15; brain, n = 96; spinal cord, n = 64. Chi-square test for SPMS vs. PPMS, X2(6) = 1.02, p = 0.799, d = 0.168; Chi-square test for brain vs. spinal cord, X2(3) = 21.19, p < 0.001, d = 0.793. (C) Disease duration in years in follicle-like structures (F+) vs. other infiltrates (F-) in SPMS. F-, M = 31.18, SD = 9.05, n = 11; F+, M = 18.18, SD = 7.26, n = 11; unpaired t-test, t(20) = 3.72, p = 0.001. (D) Absolute number of infiltrates in meninges, sulcus, cortex of brain/WM of spinal cord, WM of brain/GM of spinal cord in follicle-like structures (F+) vs. other infiltrates (F-) of SPMS cases. F-, n = 44, F+, n = 39; X2(3) = 8.38, p = 0.039. ***p < 0.001.
Figure 3
Figure 3
Follicle-like structures of SPMS brains are devoid of FOXP3 expression, but exhibit NFATc1+ cells. (A) Representative meningeal follicle-like structure of SPMS spinal cord, which was screened based on H&E staining and characterized by >60 lymphocytes (score 3), detection of Ki67+, CD35+/CD21+, and CD138+ cells on serial sections, termed F+. F–, if no or not all criteria were fulfilled. (B) Follicle-like structures could be characterized by CXCR5+, (C) but not by FOXP3+ cells. (D) NFATc1+ cells were present in follicle-like structures. (E) IHC stainings of Ki67, CD35, CD21, BCL-6, CXCR5, and NFATc1 were quantified as frequency of total cells in follicle-like structures (F+) and less defined infiltrates (F-). Ki67: F-, M = 1.52, SD = 3.73, n = 45; F+, M = 1.89, SD = 3.55, n = 38; Mann Whitney test, U = 734.0, p = 0.161. CD35: F-, M = 15.41, SD = 22.95, n = 22; F+, M = 19.05, SD = 14.75, n = 21; Mann Whitney test, U = 159.0, p = 0.081. CD21: F-, M = 5.68, SD = 10.63, n = 21; F+, M = 3.51, SD = 5.60, n = 20; Mann Whitney test, U = 183.5, p = 0.488. BCL-6: F-, M = 0.32, SD = 1.08, n = 44; F+, M = 0.49, SD = 1.62, n = 38; Mann Whitney test, U = 803.0, p = 0.642. CXCR5: F-, M = 14.72, SD = 17.24, n = 30; F+, M = 20.11, SD = 15.73, n = 29; Mann Whitney test, U = 319.0, p = 0.080. NFATc1: F-, M = 7.15, SD = 11.68, n = 28; F+, M = 16.36, SD = 21.46, n = 31; Mann Whitney test, U = 307.0, p = 0.043. Scale bars A-D indicate 100 μm. *, p < 0.05.
Figure 4
Figure 4
Follicle-like structures of SPMS brains exhibit CD3+CD4+ T cells, which neither express PD-1 nor FOXP3. (A–E) IF staining of CD3, CD4 and PD-1 reveal CD3+CD4+PD-1 T-helper cells in progressive MS. Inserts in the upper right corners show magnification of the white box. (F–I) IF staining of CD3 and FOXP3 on serial sections of a representative meningeal follicle-like structure in SPMS (same region as Figure 3). CD3+ T cells, but no FOXP3+ cells were detected. Inserts show magnification of the white box. Scale bars indicate 100 μm, inserts 10 μm.
Figure 5
Figure 5
Quantification of FOXP3 staining on brain and spinal cord of progressive MS and follicular lymphoma. The module cytonuclear v1.6 (Halo, Indica Lab) was used to define FOXP3+ in follicular lymphoma (A,B) and applied on progressive MS tissue (C,D). Representative raw images detecting FOXP3+ staining (A,C) and the mark-up (yellow, low positive; red, highly positive) are depicted (B,D). (E) Absolute number of FOXP3+ cells per whole section in follicular lymphoma (M = 200849) and across progressive MS samples (M = 0.176, n = 36) as well as (F) FOXP3+ cells per tissue area in mm2 are counted in follicular lymphoma (M = 767.71) and across all available progressive MS samples (M = 0.00051, n = 36). Note, that in 83% of the samples (n = 30) no FOXP3+ cells were detected, in 11% samples (n = 4) one FOXP3+ cell within parenchyma, in 6% of samples 2 FOXP3+ cells within parenchyma. Scale bars indicate 50 μm.
Figure 6
Figure 6
CD4+CXCR5+ TFHs mark positive for cytoplasmic NFATc1. (A–E) Consecutive IF staining of CD4, CXCR5 and NFATc1 on serial sections of follicle-like structures in SPMS (same region as Figures 3, 4E–H). Inserts show magnification of the white box. (F) NFATc1 appears to be cytoplasmic in MS brains, compared to nuclear localization within tonsillar GCs (left insert) and cytoplasmic predominance in inter-follicular cells (right insert). Scale bars indicate 100 μm, inserts 10 μm.
Figure 7
Figure 7
B cells enrich in lymphoid aggregates. (A) Absolute number of infiltrates that were positive for TFH in follicle-like structures (F+) and less defined infiltrates (F-). Fisher's exact test, N = 76, X2(1) = 4.55, p = 0.048, d = 0.505. (B) Mean percentage of TFH cells defined as CD4+CXCR5+ cells of CD4+ cells in two serial FFPE sections of follicle-like structures (F+) and less defined infiltrates (F-) in SPMS brains and spinal cords. F-, M = 15.57, SD = 17.13, n = 39; F+, M = 17.04, SD = 15.85, n = 37. Mann Whitney test, U = 635.0, p = 0.369. (C) CD20/CD3 ratio in follicle-like structures (F+) and less defined infiltrates (F-) based on IF co-staining of CD3 and CD20. F-, M = 0.28, SD = 0.33, n = 39; F+, M = 0.38, SD = 0.34, n = 37; Mann Whitney test, U = 525.5, p = 0.042. *p < 0.05.
Figure 8
Figure 8
eLFs of brain and spinal cord exhibit more CD4+CD69+ cells. (A–D) Consecutive IF co-staining of CD4 and CD69 in follicle-like structures of SPMS brains and spinal cords. Inserts show co-localization of CD4+ cells with CD69 suggesting tissue-resident T cells in a representative meningeal eLF of SPMS spinal cord (same region as Figures 3, 4E–H, 5). Scale bar indicate 100 μm, scale bars of the inserts indicate 10 μm. (E) Percentage of tissue-resident cells defined as CD4+CD69+ cells of CD4+ cells in follicle-like structures (F+) and less defined infiltrates (F-) in SPMS brains and spinal cords. F-, 5.70, SD = 10.67, n = 38; F+, M = 7.92, SD = 9.39, n = 32; Mann Whitney test, U = 434.0, p = 0.028.

References

    1. Genain CP, Cannella B, Hauser SL, Raine CS. Identification of autoantibodies associated with myelin damage in multiple sclerosis. Nat Med. (1999) 5:170–5. 10.1038/5532 - DOI - PubMed
    1. Flach AC, Litke T, Strauss J, Haberl M, Gomez CC, Reindl M, et al. . Autoantibody-boosted T-cell reactivation in the target organ triggers manifestation of autoimmune CNS disease. Proc Natl Acad Sci USA. (2016) 113:3323–8. 10.1073/pnas.1519608113 - DOI - PMC - PubMed
    1. Lodygin D, Hermann M, Schweingruber N, Flugel-Koch C, Watanabe T, Schlosser C, et al. . Beta-Synuclein-reactive T cells induce autoimmune CNS grey matter degeneration. Nature. (2019) 566:503–8. 10.1038/s41586-019-0964-2 - DOI - PubMed
    1. Meinl E, Krumbholz M, Hohlfeld R. B lineage cells in the inflammatory central nervous system environment: migration, maintenance, local antibody production, and therapeutic modulation. Ann Neurol. (2006) 59:880–92. 10.1002/ana.20890 - DOI - PubMed
    1. Stangel M, Fredrikson S, Meinl E, Petzold A, Stuve O, Tumani H. The utility of cerebrospinal fluid analysis in patients with multiple sclerosis. Nat Rev Neurol. (2013) 9:267–76. 10.1038/nrneurol.2013.41 - DOI - PubMed

Publication types