. 2020 Feb;19(2):913-922.
doi: 10.3892/etm.2019.8285. Epub 2019 Dec 5.

Both UFH and NAH alleviate shedding of endothelial glycocalyx and coagulopathy in LPS-induced sepsis

Affiliations

Both UFH and NAH alleviate shedding of endothelial glycocalyx and coagulopathy in LPS-induced sepsis

Xiao Huang et al. Exp Ther Med. 2020 Feb.

Abstract

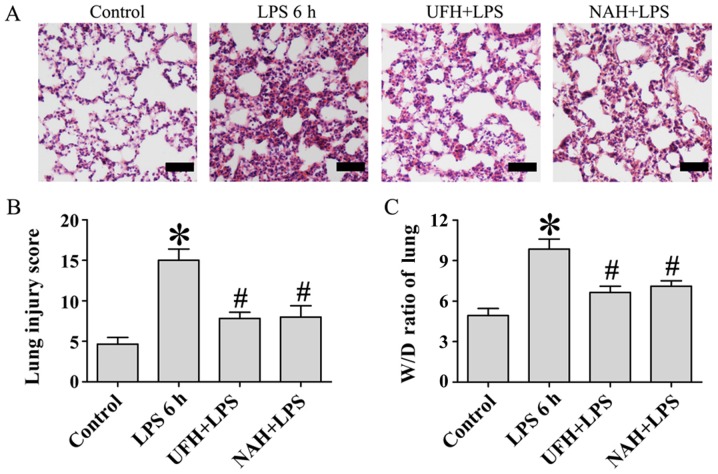
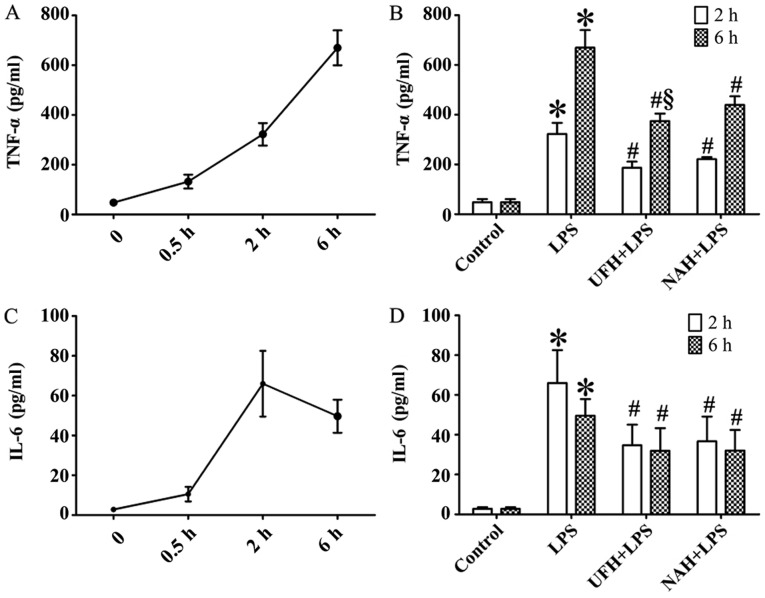
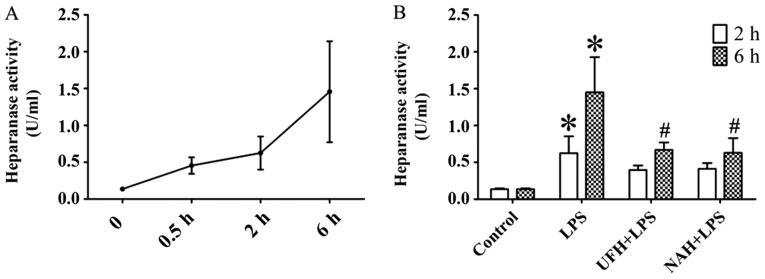
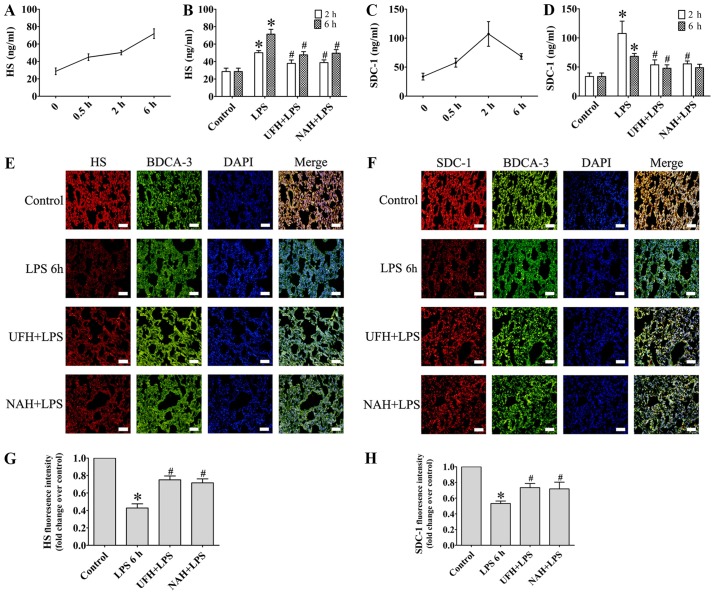
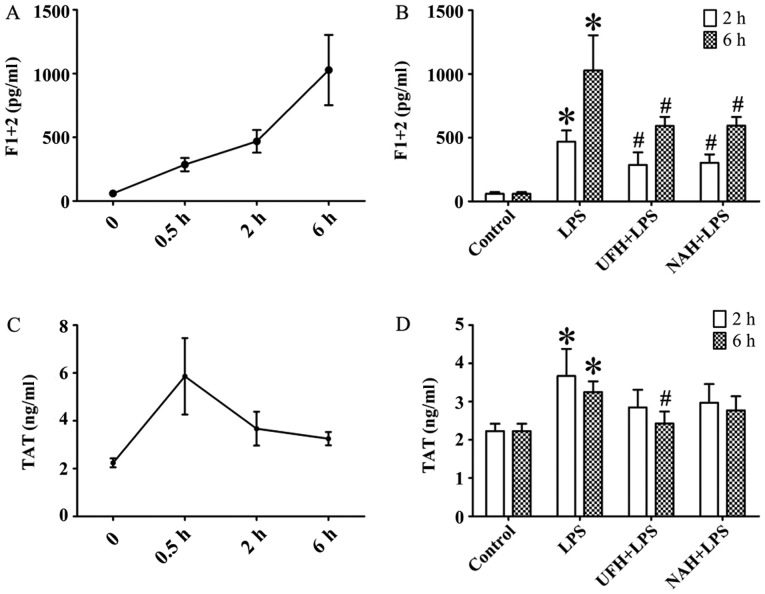
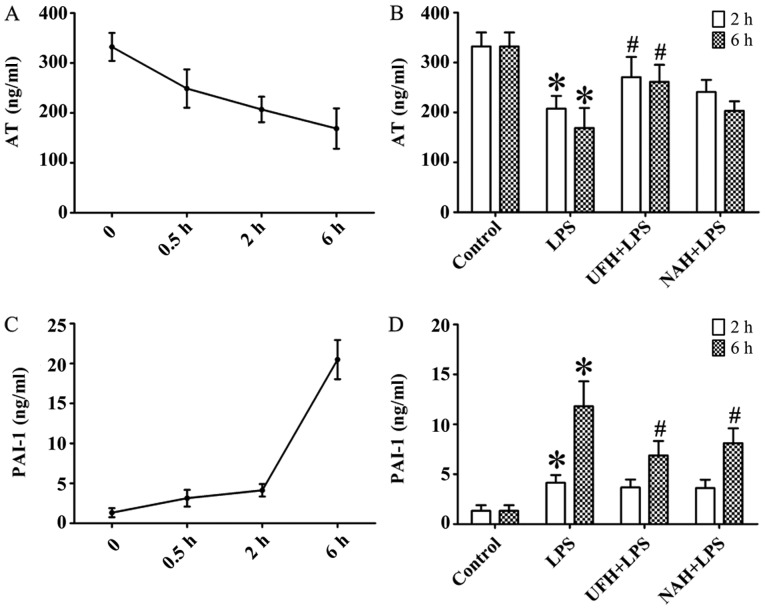
Sepsis commonly progresses to disseminated intravascular coagulation and induces the activation of heparanase (HPA) and the shedding of endothelial glycocalyx constituents, including syndecan-1 (SDC-1) and heparan sulphate (HS). However, the degradation of glycocalyx and its association with coagulation disorders remains undetermined. The present study aimed to evaluate the effect of unfractionated heparin (UFH) and N-acetylheparin (NAH), which is a non-anticoagulant heparin derivative, on endothelial glycocalyx and coagulation function in a lipopolysaccharide (LPS)-induced sepsis rat model, and to compare the differences observed in coagulation function between UFH and NAH. Experimental rats were randomly assigned to four groups: Control; LPS; UFH + LPS; and NAH + LPS. Rats were administered UFH or NAH and subsequently, ~1 min later, administered LPS (10 mg/kg; intravenous). The blood and lung tissues of rats were collected 0.5, 2 and 6 h after LPS injection, and were used for subsequent analysis. The results demonstrated that HPA activity and SDC-1 and HS levels increased, and this increase was associated with inflammatory cytokines and coagulation/fibrinolysis markers in the sepsis rat model. Histopathological examination was performed, and the lung injury score and lung wet/dry ratio indicated that UFH and NAH also significantly improved lung tissue injury. The results of the ELISA analysis demonstrated that UFH and NAH treatment: i) significantly decreased the levels of inflammatory cytokines including tumor necrosis factor-α and interleukin-6; ii) inhibited HPA activity and protected the integrity of the glycocalyx, which was identified by decreased HS and SDC-1 levels; and iii) decreased the levels of prothrombin fragment 1+2, thrombin-antithrombin complex, and plasminogen activator inhibitor-1 and increased the levels of fibrinogen and antithrombin-III. Preconditioning with UFH decreased the plasma activated partial thromboplastin time. These results indicated that UFH and NAH may alleviate sepsis-induced coagulopathy, and this effect may have been due to an inhibition of HPA activity and decrease in the shedding of the endothelial glycocalyx.

Keywords: N-acetylheparin; coagulation; glycocalyx; sepsis; unfractionated heparin.


Figures

Figure 1.
Figure 1.
Effect of heparin on histopathologic changes and lung W/D ratio in LPS-induced lung injury. Sprague-Dawley male rats were injected i.v. with UFH (100 U/kg) or NAH (1 mg/kg) and subsequently treated with LPS (10 mg/kg; 1 ml/kg of body weight; i.v.). Rats in the control group were injected i.v. with an equal volume of NS. A total of 6 h following LPS injection, the lung histopathologic changes were observed using (A) hematoxylin and eosin staining (n=6 rats/group; magnification, ×200; scale bar, 50 µm). (B) Lung tissues from each experimental group were processed and the lung injury score was used for histological evaluation. (C) The lung W/D ratios in each treatment group were quantified. Data are presented as mean ± standard deviation from 3 independent experiments. *P<0.05 vs. the control group; #P<0.05 vs. the LPS 6 h group. Statistical comparisons were determined using a one-way analysis of variance followed by the Student-Newman-Keuls test for multiple group comparisons. W/D, wet/dry; LPS, lipopolysaccharide; UFH, unfractionated heparin; NAH, N-acetylheparin; NS, normal saline; i.v., intravenous.
Figure 2.
Figure 2.
Effect of heparin on inflammatory cytokines in plasma of rats with LPS-induced sepsis. (A) TNF-α and (C) IL-6 were assessed using an ELISA at 0.5, 2 and 6 h after LPS injection, respectively. Effect of UFH or NAH on levels of (B) TNF-α and (D) IL-6 in plasma at 2 and 6 h after LPS injection. Data are presented as mean ± standard deviation. There were 6 animals in each group at 0.5, 2 and 6 h. *P<0.05 vs. the control group; #P<0.05 vs. the LPS group; §P<0.05 vs. the NAH + LPS group. The TNF-α data were analyzed using a Kruskal-Wallis test followed by a pairwise comparisons test. The IL-6 data were analyzed using a one-way analysis of variance followed by a Student-Newman-Keuls test for multiple group comparisons. LPS, lipopolysaccharide; TNF-α, tumor necrosis factor-α; IL, interleukin; UFH, unfractionated heparin; NAH, N-acetylheparin.
Figure 3.
Figure 3.
Effect of heparin on heparanase activity in rats with LPS-induced sepsis. (A) Heparanase activity was determined using an ELISA at 0.5, 2 and 6 h after LPS injection. (B) Effect of UFH or NAH on heparanase activity in plasma at 2 and 6 h after LPS injection. Data are presented as mean ± standard deviation. There were 6 animals in each group at 0.5, 2 and 6 h. *P<0.05 vs. the control group; #P<0.05 vs. the LPS group. The HPA data were analyzed using a one-way analysis of variance, followed by a Student-Newman-Keuls test for multiple group comparisons. LPS, lipopolysaccharide; UFH, unfractionated heparin; NAH, N-acetylheparin.
Figure 4.
Figure 4.
Effect of heparin on endothelial glycocalyx degradation products in an LPS-induced sepsis rat model. (A) HS and (C) SDC-1 in plasma was determined using an ELISA at 0.5, 2 and 6 h after LPS injection. Effect of UFH or NAH on (B) HS and (D) SDC-1 in plasma at 2 and 6 h after LPS injection. The distribution of (E) HS (red) and (F) SDC-1 (red) in rat lungs was assessed using staining with specific antibodies. Endothelial cell marker of pulmonary vascular was assessed using BDCA-3 (green) staining (magnification, ×200; scale bar, 50 µm). (G) Fluorescence intensity analyses of the images presented in (E). (H) Fluorescence intensity analyses of the images presented in (F). Data are presented as mean ± standard deviation for 3 independent experiments. *P<0.05 vs. the control group; #P<0.05 vs. the LPS group. The HS and SDC-1 data were determined using a one-way analysis of variance followed by a Student-Newman-Keuls test for multiple group comparisons. LPS, lipopolysaccharide; HS, heparan sulphate; SDC-1, syndecan-1; UFH, unfractionated heparin; NAH, N-acetylheparin; BDCA-3, thrombomodulin.
Figure 5.
Figure 5.
Effect of heparin on activated coagulation parameters in an LPS-induced sepsis rat model. (A) F1+2 and (C) TAT were determined using an ELISA at 0.5, 2 and 6 h after LPS injection, respectively. Effect of UFH or NAH on (B) F1+2 and (D) TAT in the plasma at 2 and 6 h after LPS injection. Data are presented as mean ± standard deviation. There were 6 animals in each group at 0.5, 2 and 6 h. *P<0.05 vs. the control group; #P<0.05 vs. the LPS group. The F1+2 data were analyzed using a Kruskal-Wallis test along with Bonferroni correction. The TAT data were analyzed using a one-way analysis of variance followed by a Student-Newman-Keuls test for multiple group comparisons. LPS, lipopolysaccharide; F1+2, prothrombin fragment 1+2; TAT, thrombin-antithrombin complex; UFH, unfractionated heparin; NAH, N-acetylheparin.
Figure 6.
Figure 6.
Effect of heparin on anti-coagulation and fibrinolysis parameters in an LPS-induced sepsis rat model. (A) AT and (C) PAI-1 were determined using an ELISA at 0.5, 2 and 6 h after LPS injection, respectively. Effect of UFH or NAH on (B) AT and (D) PAI-1 in plasma at 2 and 6 h after LPS injection. Data are presented as mean ± standard deviation. There were 6 animals in each group at 0.5, 2 and 6 h, respectively. *P<0.05 vs. the control group; #P<0.05 vs. the LPS group. The AT data were analyzed using a Kruskal-Wallis test along with Bonferroni correction. The PAI-1 data were analyzed using a one-way analysis of variance followed by a Student-Newman-Keuls test for multiple group comparisons. LPS, lipopolysaccharide; AT, antithrombin; PAI-1, plasminogen activator inhibitor-1; UFH, unfractionated heparin; NAH, N-acetylheparin.

References

    1. Rhodes A, Evans LE, Alhazzani W, Levy MM, Antonelli M, Ferrer R, Kumar A, Sevransky JE, Sprung CL, Nunnally ME, et al. Surviving sepsis campaign: International guidelines for management of sepsis and septic shock: 2016. Intensive Care Med. 2017;43:304–377. doi: 10.1007/s00134-017-4683-6. - DOI - PubMed
    1. Berthelsen LO, Kristensen AT, Tranholm M. Animal models of DIC and their relevance to human DIC: A systematic review. Thromb Res. 2011;128:103–116. doi: 10.1016/j.thromres.2010.12.002. - DOI - PubMed
    1. Schouten M, Wiersinga WJ, Levi M, van der Poll T. Inflammation, endothelium, and coagulation in sepsis. J Leukoc Biol. 2008;83:536–545. doi: 10.1189/jlb.0607373. - DOI - PubMed
    1. Levi M, van der Poll T. Coagulation and sepsis. Thromb Res. 2017;149:38–44. doi: 10.1016/j.thromres.2016.11.007. - DOI - PubMed
    1. Simmons J, Pittet JF. The coagulopathy of acute sepsis. Curr Opin Anaesthesiol. 2015;28:227–236. doi: 10.1097/ACO.0000000000000163. - DOI - PMC - PubMed