

The Clinical Efficacy and Safety of Stem Cell Therapy for Diabetes Mellitus: A Systematic Review and Meta-Analysis
- PMID: 32010488
- PMCID: PMC6961772
- DOI: 10.14336/AD.2019.0421
The Clinical Efficacy and Safety of Stem Cell Therapy for Diabetes Mellitus: A Systematic Review and Meta-Analysis
Abstract
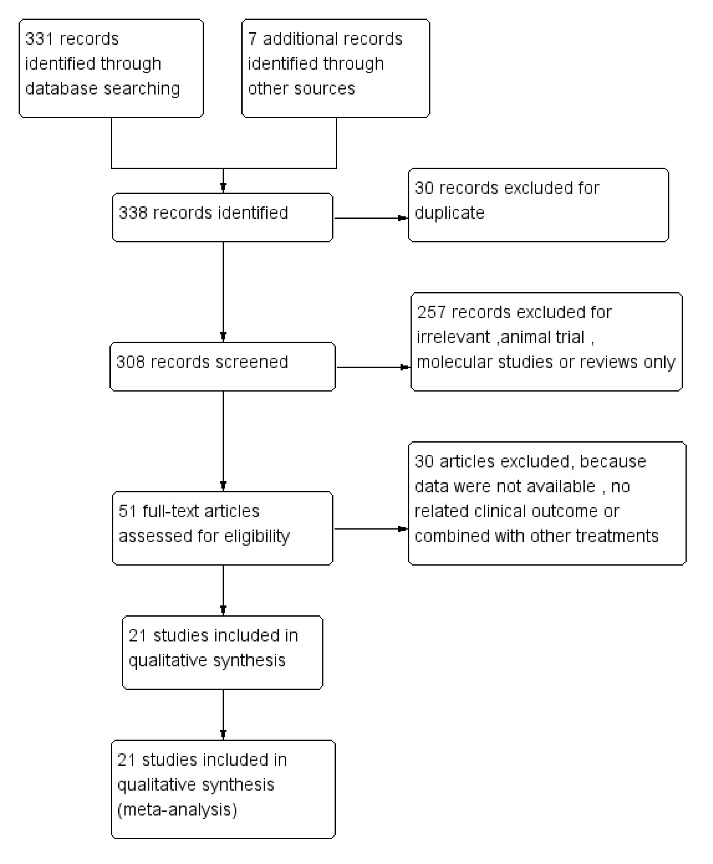
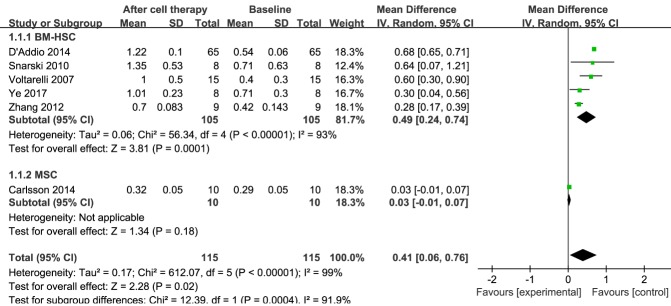
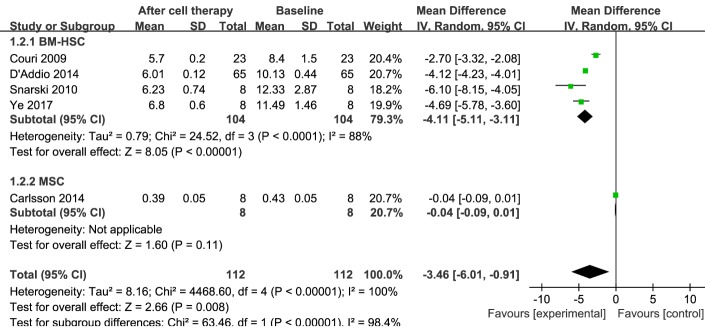
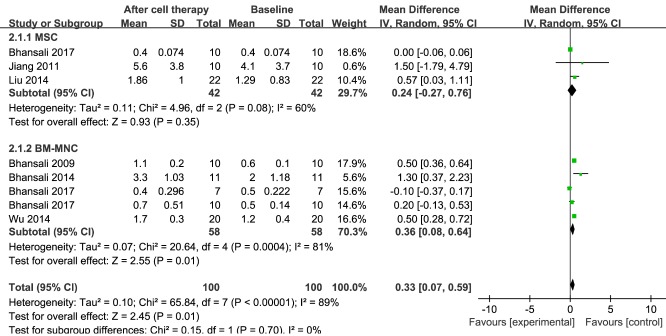
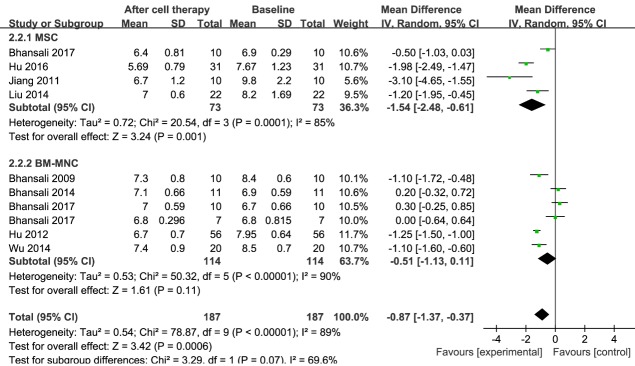
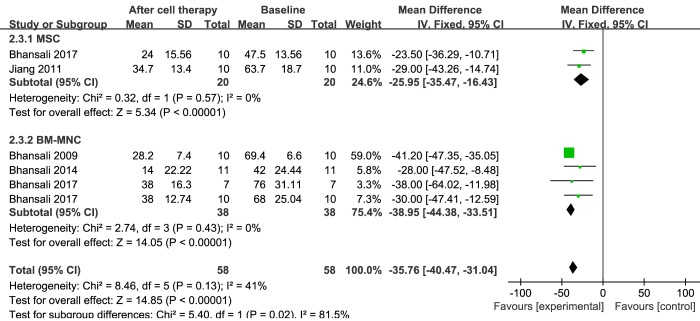
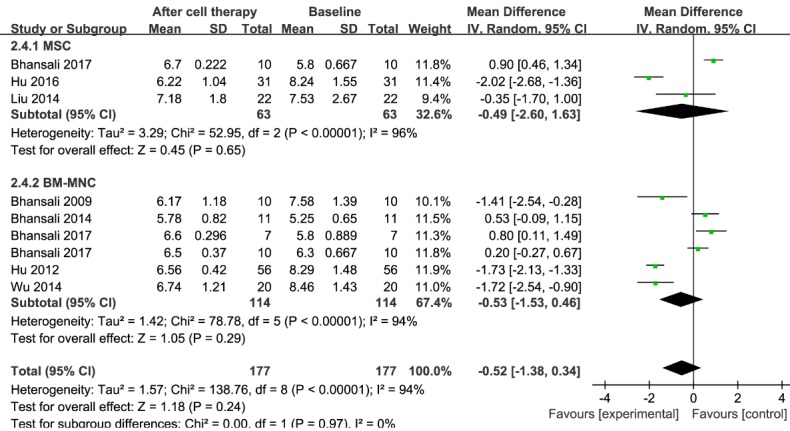
Diabetes mellitus (DM) is a chronic metabolic disease with high morbidity and mortality. Recently, stem cell-based therapy for DM has shown considerable promise. Here, we undertook a systematic review and meta-analysis of published clinical studies to evaluate the efficacy and safety of stem cell therapy for both type 1 DM (T1DM) and type 2 DM (T2DM). The PubMed, Cochrane Central Register of Controlled Trials, EMBASE, and ClinicalTrials.gov databases were searched up to November 2018. We employed a fixed-effect model using 95% confidence intervals (CIs) when no statistically significant heterogeneity existed. Otherwise, a random-effects statistical model was used. Twenty-one studies met our inclusion criteria: ten T1DM studies including 226 patients and eleven T2DM studies including 386 patients. Stem cell therapy improved C-peptide levels (mean difference (MD), 0.41; 95% CI, 0.06 to 0.76) and glycosylated hemoglobin (HbA1c; MD, -3.46; 95% CI, -6.01 to -0.91) for T1DM patients. For T2DM patients, stem cell therapy improved C-peptide levels (MD, 0.33; 95% CI, 0.07 to 0.59), HbA1c (MD, -0.87; 95% CI, -1.37 to -0.37) and insulin requirements (MD, -35.76; 95% CI, -40.47 to -31.04). However, there was no significant change in fasting plasma glucose levels (MD, -0.52; 95% CI, -1.38 to 0.34). Subgroup analyses showed significant HbA1c and C-peptide improvements in patients with T1DM treated with bone marrow hematopoietic stem cells (BM-HSCs), while there was no significant change in the mesenchymal stem cell (MSC) group. In T2DM, HbA1c and insulin requirements decreased significantly after MSC transplantation, and insulin requirements and C-peptide levels were significantly improved after bone marrow mononuclear cell (BM-MNC) treatment. Stem cell therapy is a relatively safe and effective method for selected individuals with DM. The data showed that BM-HSCs are superior to MSCs in the treatment of T1DM. In T2DM, MSC and BM-MNC transplantation showed favorable therapeutic effects.
Keywords: cell therapy; diabetes mellitus; meta-analysis; regenerative medicine; stem cells; systematic review.
Copyright: © 2019 Zhang et al.
Conflict of interest statement
Conflict of interest The authors declare no conflict of interest.
Figures
References
-
- International Diabetes Federation.IDF Diabetes Atlas 8th edn. Brussels, Belgium: International Diabetes Federation, 2017.
-
- American Diabetes Association (2004). Diagnosis and classification of diabetes mellitus. Diabetes Care, 27 Suppl 1:S5-s10. - PubMed
-
- Kolb H, Mandrup-Poulsen T (2005). An immune origin of type 2 diabetes? Diabetologia, 48:1038-1050. - PubMed
-
- Todd JA (2010). Etiology of type 1 diabetes. Immunity, 32:457-467. - PubMed
-
- Melendez-Ramirez LY, Richards RJ, Cefalu WT (2010). Complications of type 1 diabetes. Endocrinol Metab Clin North Am, 39:625-640. - PubMed
Publication types
Grants and funding
LinkOut - more resources
Full Text Sources
Medical
Miscellaneous