

Characterization of volatile organic compounds (VOCs) in their liquid-phase by terahertz time-domain spectroscopy
- PMID: 32010495
- PMCID: PMC6968772
- DOI: 10.1364/BOE.11.000001
Characterization of volatile organic compounds (VOCs) in their liquid-phase by terahertz time-domain spectroscopy
Abstract
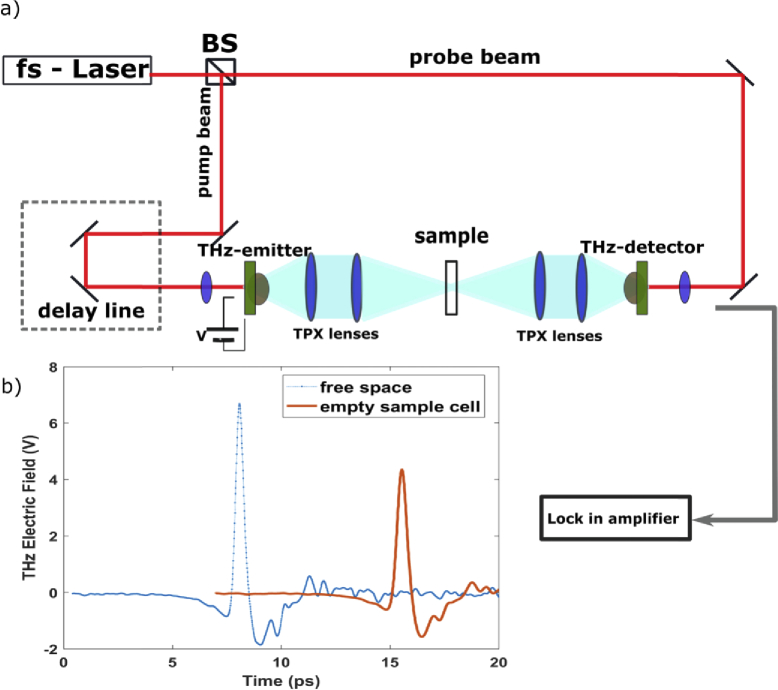
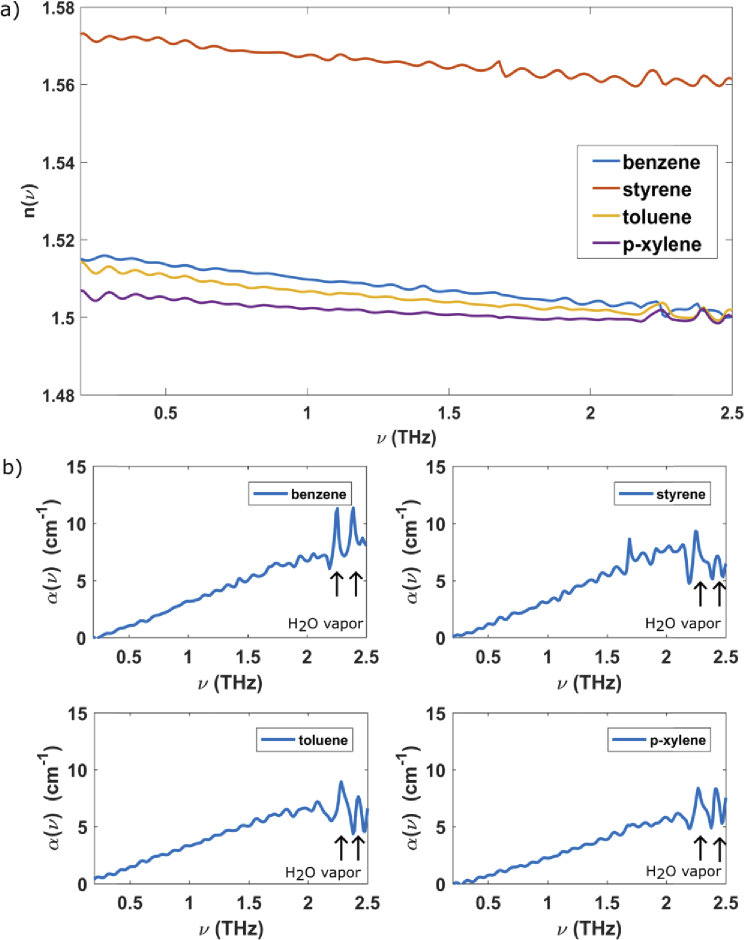
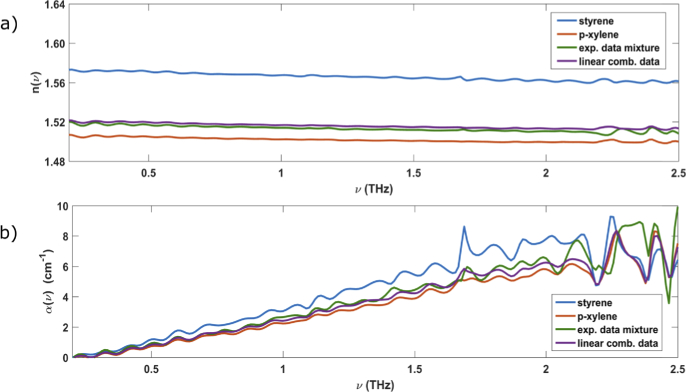
In this work the terahertz spectra of benzene, toluene, p-xylene and styrene-four volatile organic compounds (VOCs) of interest in environmental pollution studies-have been measured in their liquid phase at room temperature using terahertz time-domain spectroscopy (THz-TDS). Their frequency-dependent refractive index and absorption coefficient have been extracted and analyzed in the spectral range from 0.2 to 2.5 THz. The optical properties of bi-component VOCs mixtures have also been investigated and described in terms of a linear combination of pure VOCs optical components.
© 2019 Optical Society of America under the terms of the OSA Open Access Publishing Agreement.
Conflict of interest statement
The authors declare that there are no conflicts of interest related to this article.
Figures
References
-
- Khan F. I., Kr. Ghoshal A., “Removal of Volatile Organic Compounds from polluted air,” J. Loss Prev. Process Ind. 13(6), 527–545 (2000). 10.1016/S0950-4230(00)00007-3 - DOI
-
- Liu Y., Shao M., Fu L., Lu S., Zeng L., Tang D., “Source profiles of volatile organic compounds (VOCs) measured in China: Part I,” Atmos. Environ. 42(25), 6247–6260 (2008). 10.1016/j.atmosenv.2008.01.070 - DOI
-
- Al-Douseri F. M., Chen Y., Zhang X. C., “THz wave sensing for petroleum industrial applications,” Int. J. Infrared Millimeter Waves 27(4), 481–503 (2007). 10.1007/s10762-006-9102-y - DOI
-
- Yu C., Crump D., “A Review of the Emission of VOCs from Polymeric Materials used in Buildings,” Build. Environ. 33(6), 357–374 (1998). 10.1016/S0360-1323(97)00055-3 - DOI
LinkOut - more resources
Full Text Sources