. 2019 Dec 23;11(1):432-447.
doi: 10.1364/BOE.11.000432. eCollection 2020 Jan 1.

Cavitation induced by shock wave focusing in eye-like experimental configurations

Affiliations

Cavitation induced by shock wave focusing in eye-like experimental configurations

Tomaž Požar et al. Biomed Opt Express. .

Abstract

During laser-induced, breakdown-based medical procedures in human eyes such as posterior capsulotomy and vitreolysis, shock waves are emitted from the location of the plasma. A part of these spherically expanding transients is reflected from the concave surface of the corneal epithelium and refocused within the eye. Using a simplified experimental model of the eye, the dominant secondary cavitation clusters were detected by high-speed camera shadowgraphy in the refocusing volume, dislocated from the breakdown position and described by an abridged ray theory. Individual microbubbles were detected in the preheated cone of the incoming laser pulse and radially extending cavitation filaments were generated around the location of the breakdown soon after collapse of the initial bubble. The generation of the secondary cavitation structures due to shock wave focusing can be considered an adverse effect, important in ophthalmology.


Conflict of interest statement

The authors T.P. and R.P. declare that they have filed a patent application PCT/SI2018/050020 for an acoustic diverter for improved safety during ophthalmic laser treatments.

Figures

Fig. 1.
Fig. 1.
Illustration of the shock wave refocusing mechanism at four time instants. (a) Laser-induced breakdown takes place at the focus. (b) After the breakdown, a cavitation bubble starts to grow and a compressional shock wave (solid blue circle) is launched spherically into the surrounding tissue. (c) The shock wave travelling posteriorly continues its propagation into soft tissues, while a portion of its anterior wavefront is reflected from the corneal epithelium as a tensile wave (dashed blue line). (d) The reflected shock wave is refocused reaching negative pressure amplitudes that exceed the threshold for secondary acoustic (inertial) cavitation. After the first collapse of the bubble, steps (b)–(d) are repeated with the following differences: smaller isolated cavitation bubbles induced predominantly in the anterior laser cone are now accompanied by larger secondary cavitation clouds near the acoustic focus and radial cavitation filaments are formed in the vicinity of the collapse.
Fig. 2.
Fig. 2.
Schematics of the experimental setup in two perspectives (side and top view). The dimensions of the water tank and ophthalmic lens are in right proportions.
Fig. 3.
Fig. 3.
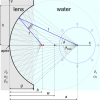
Geometry of the lens-water system. A shock wave (light blue circle) is emitted at a distance a (blue dot). A portion of the shock wave entering the spherical cap (0ϕϕmax) is refocused on the axis (red line). The paraxial rays cross the axis farthest away (red dot) from the apex of the acoustic mirror (posterior concave surface of the ophthalmic lens). The dark blue line represents an arbitrary ray declined by an angle ϕ from the axis and reflected by the acoustic mirror.
Fig. 4.
Fig. 4.
(a) For each distance of the shock wave source a˜, there is an interval of b˜, given by the dark gray shaded area, where the shock wave refocuses on the axis. The pale gray bands mark the experimentally visually inaccessible values. The presented results are plotted for the experimental size of the cup given by g˜=0.553. The dashed black line corresponds to the paraxial rays which always intersect the axis furthest away from the apex of the acoustic mirror. The solid black line corresponds to the rays reflected from the edge of the cup. As a reference, if these results were mapped on the dimensions of an adult human eye (top and right axis labels), the solid blue lines would denote the anterior and the posterior surfaces of the ocular lens. The corneal epithelium would be at {a˜,b˜}=0, the posterior surface of the lens close to {a˜,b˜}=1 and the retina at {a˜,b˜}=3. For direct comparison with this theory, the empty black circles show the experimentally determined locations of the dominant secondary cavitation, extracted from Figs. 6(q)–6(v). (b) The time of flight (ToF) s/α1 of the shock wave from the point of emission back to the axis assuming it propagates with a constant acoustic velocity of α1 = 1482 m/s. The ToFs reside within the dark gray shaded area bounded by the ToF curve of the paraxial rays (dashed black line) and the ToF curve of the rays reflected from the edge of the cup (solid black line) which arrive earlier.
Fig. 5.
Fig. 5.
(a) Relative pressure profiles log[p(b˜b˜max)] in the refocusing interval for various values of the shock wave origin a˜. The chosen values of a˜ are labeled in red for a˜<1 in blue for a˜=1 and in black for 1<a˜. (b) Maximum pressure log[pmax(a˜)] as a function of shock wave origin.
Fig. 6.
Fig. 6.
(a)–(k) Dynamics of the cavitation structures following the breakdown at a distance a = 9.53 mm (a˜=1.222) from the apex of the lens (left column). (l)–(v) Secondary cavitation structures acquired soon after the first collapse of the initial bubble generated at various locations along the optical axis (right column). Laser pulse energy was 15 mJ. The scale (1 mm) is given by the white bar. The meaning of the overlaying lines and labels is described in the main text.
Fig. 7.
Fig. 7.
The first secondary bubbles formed in the anterior cone (a)–(c), the maximum extent of the initial cavitation bubble (d)–(f), the first collapse (g)–(i) and the secondary cavitation structures acquired soon after the first collapse of the initial bubble (j)–(l) at three selected energies of the laser pulse: 5 mJ (left column), 10 mJ (middle column), 15 mJ (right column). The location of the breakdown is the same as in Figs. 6(a)–6(k) (a = 9.53 mm, a˜=1.222). The scale (1 mm) is given by the white bar. The meaning of the overlaying lines and labels is described in the main text.

References

    1. Niemz M. H., Laser-Tissue Interactions: Fundamentals and Applications (Springer, 2007).
    1. Vogel A., Capon M. R. C., Asiyo-Vogel M. N., Birngruber R., “Intraocular Photodisruption with Picosecond and Nanosecond Laser-Pulses - Tissue Effects in Cornea, Lens, and Retina,” Invest. Ophth. Vis. Sci. 35(7), 3032–3044 (1994). - PubMed
    1. Lauterborn W., Vogel A., “Shock wave emission by laser generated bubbles,” in Bubble Dynamics and Shock Waves Delale C. F., ed. (Springer, 2013), pp. 67–103.
    1. Vogel A., Busch S., Parlitz U., “Shock wave emission and cavitation bubble generation by picosecond and nanosecond optical breakdown in water,” J. Acoust. Soc. Am. 100(1), 148–165 (1996).10.1121/1.415878 - DOI
    1. Vogel A., Venugopalan V., “Mechanisms of pulsed laser ablation of biological tissues,” Chem. Rev. 103(2), 577–644 (2003).10.1021/cr010379n - DOI - PubMed

LinkOut - more resources